")
")

Benchmarking the hardness of a particular ore deposit can provide valuable intelligence as to whether its comminution properties are typical of other deposits and if not, the extent to which they are likely to depart from the norm. Such intelligence is vital in the early investigative and developmental stages of a prospective ore deposit as it provides an indication as to whether the likely comminution energy requirement, the cost of which is often a major economic factor, will be more or less the same as that of existing concentrators. In an existing circuit this benchmarking is also valuable as it helps identify whether its energy costs relative to other operations within its commodity sector are reasonable in relation to its relative hardness, ie are its energy costs high in relation to other concentrators due to its ores relative hardness? If not then this may indicate a relatively inefficient comminution circuit which has the potential to reduce its energy costs and improve company profitability.
By leveraging our extensive, 35000-strong database, SMC Testing now offers a new and deep insight into ore hardness via focused analysis of global trends and is able to position a specific ore deposit within its commodity (valuable mineral content) hardness distribution (Figure 1). In some cases further analysis is also possible based on commodity hardness distributions within geographical location (Figure 2).
This world-first insight is based on aggregated highly detailed analysis of over 35000 completed SMC Tests, carried out on ore samples from 80 countries (Table 1), spanning six continents (Figure 3), and covering over 30 different commodities (Table 2 and Figure 4).
The ongoing analysis conducted by SMC Testing shows distinct differences in the hardnesses between some of the major commodities, demonstrated clearly in Figure 1 below. Figure 1 shows the cumulative distribution of the SMC Test® DWi hardness parameter for the entire database compared to one of the commodity sub-sets.
Further evidence indicates that there is also a significant difference between continents in the distributions of the hardnesses of the principal commodities. Figure 4 shows a good example of this, illustrated by the variation in DWi hardness of a single commodity based on geographic location. The aggregated geographic and commodity compositions of the full SMC Test® database can be seen in Figure 3 and 4.
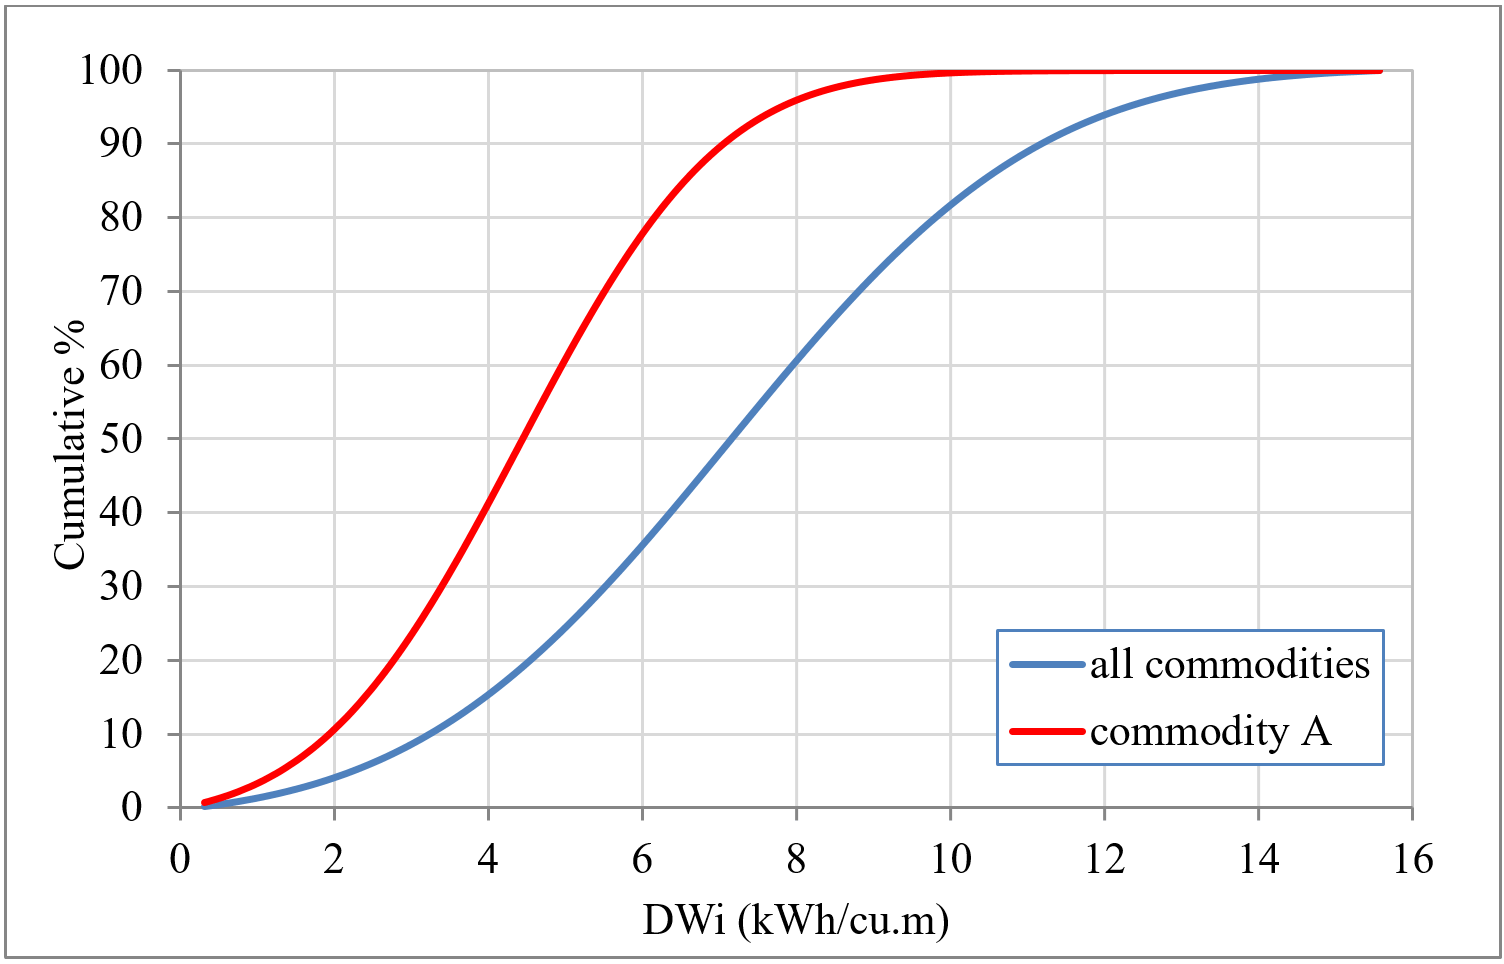
Figure 1 – Cumulative Distributions of the DWi Parameter of a Particular Commodity vs All Commodities Combined
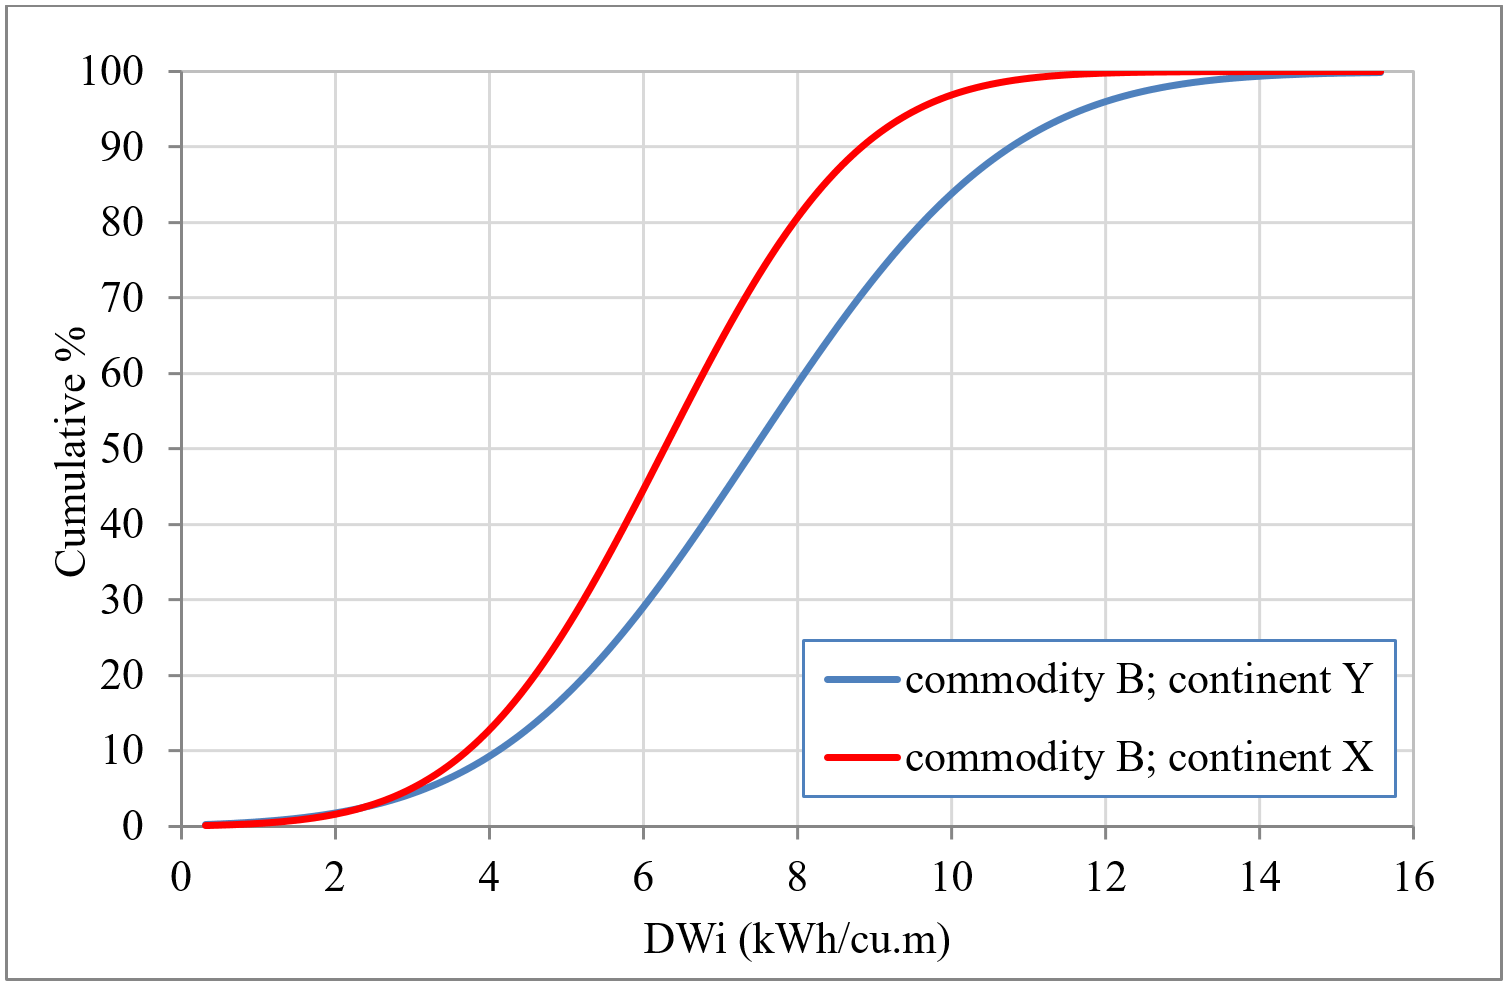
Figure 2 – Cumulative Distributions of the DWi Parameter of a Particular Commodity vs Continent
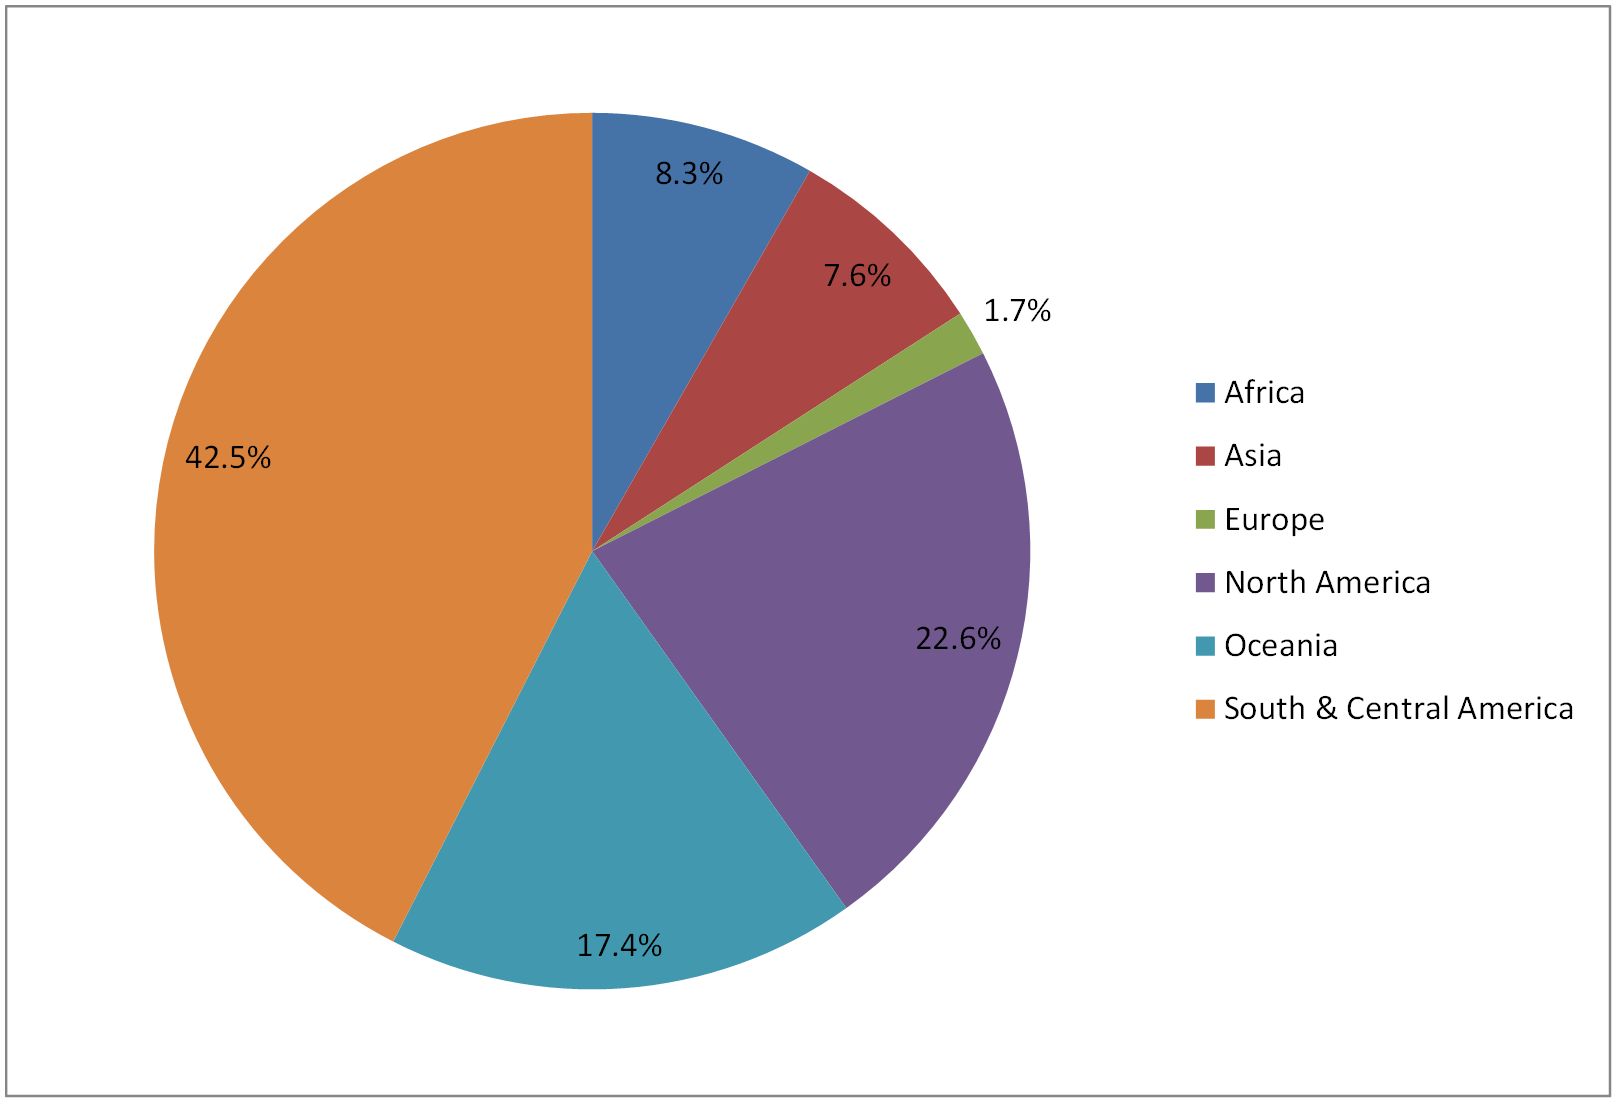 Figure 3 – Distribution of SMC Tests by Continent
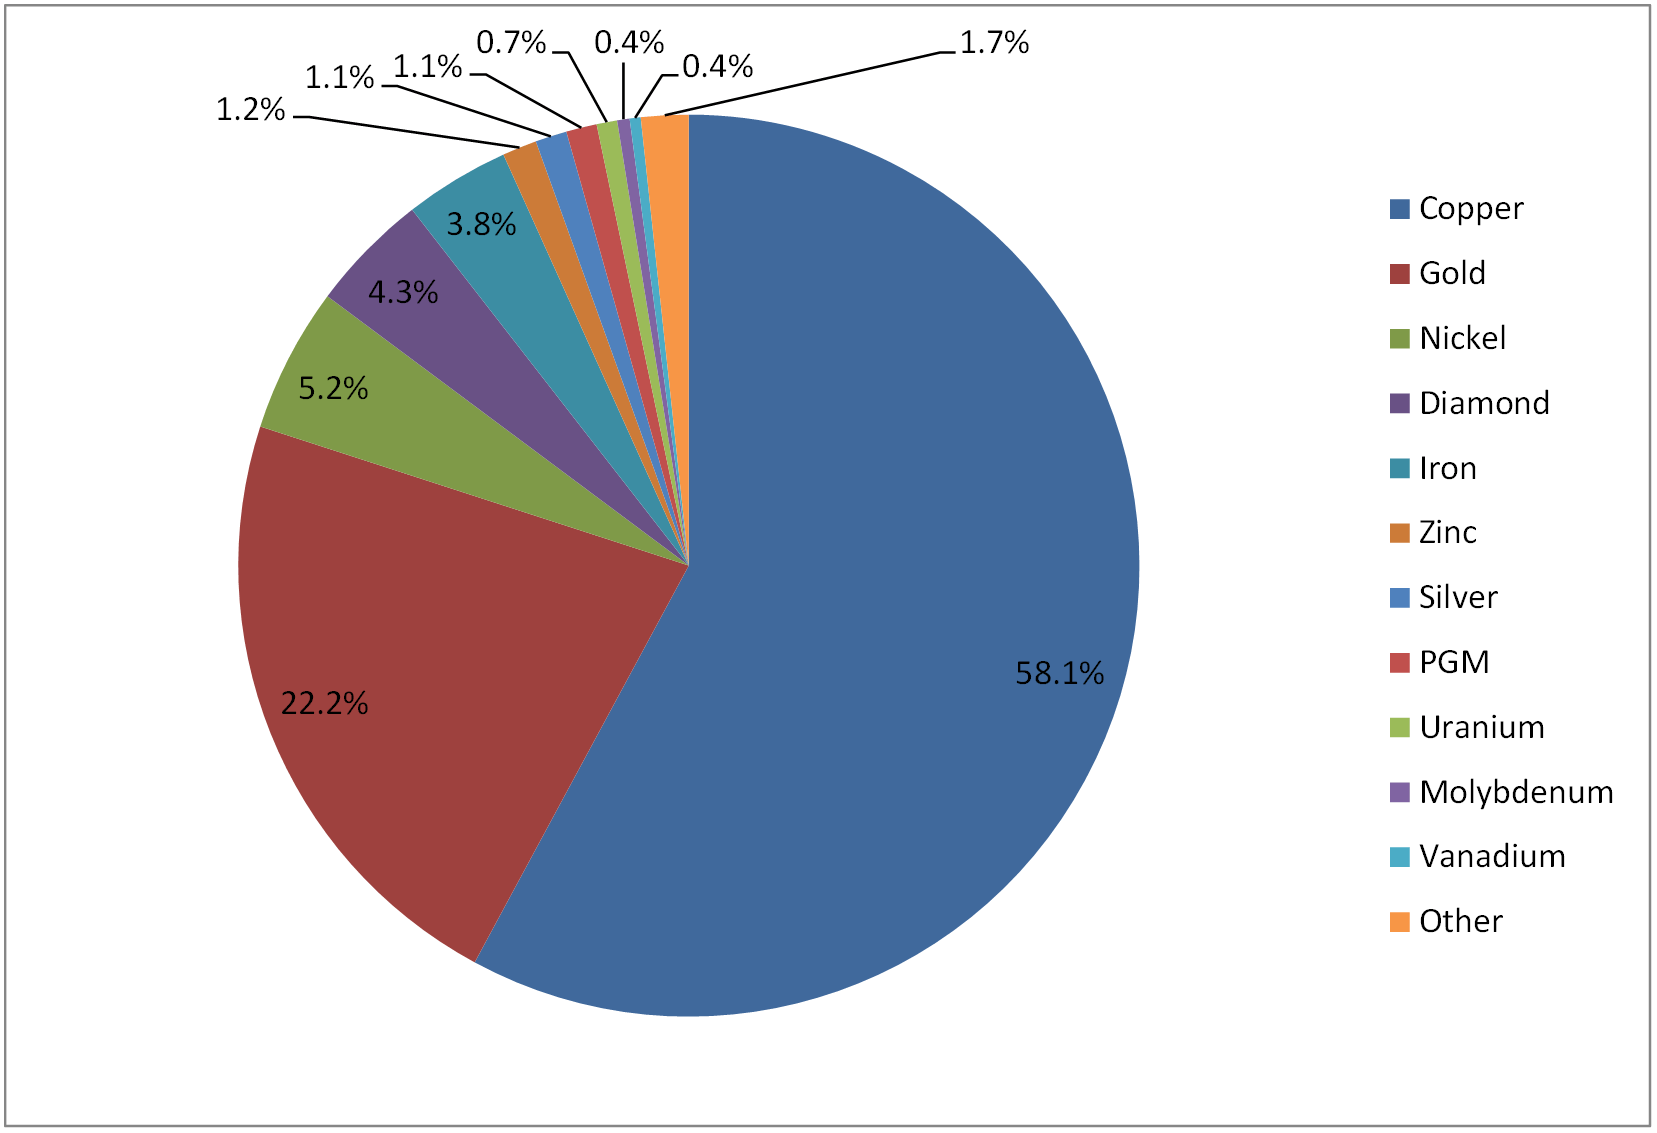
Figure 4 – Distribution of SMC Tests by Commodity
These findings reflect the innovative and continually-improving nature of SMC Testing as the world’s leading comminution test provider. We continue to leverage the extensive SMC Test® database to offer our customers unrivalled reporting insight and value.
In a little over 10 years since its introduction to the Minerals Processing world, the SMC Test® has established itself as one of the most popular, versatile and accurate laboratory comminution tests available. Furthermore, the SMC Test® database—the largest of its kind in the world—gives unique and superior testing insight unmatched in other comminution tests available.
Contact us today to start benefitting from SMC Testing’s unique comminution insight.
TABLE 1 – COUNTRIES FROM WHICH SAMPLES HAVE HAD SMC TESTS CARRIED OUT ON THEM
Argentina
Armenia
Australia
Austria
Bolivia
Botswana
Brazil
Burkina Faso
Canada
Central African Republic
Chile
China
Colombia
Congo
Cote d'Ivoire
Democratic Rep. Congo
Ecuador
Egypt
Eritrea
Ethiopia
Fiji
Finland
Ghana
Greece
Greenland
Guatemala
Guinea
Guyana
India
Indonesia
Iran
Ireland
Kazakhstan
Kyrgyzstan
Laos
Lesotho
Liberia
Malawi
Mali
Mauritania
Mexico
Mongolia
Morocco
Mozambique
Namibia
New Zealand
Nicaragua
Niger
Nigeria
Pakistan
Panama
Papua New Guinea
Peru
Philippines
Poland
Portugal
Romania
Russia
Saudi Arabia
Senegal
Serbia
Sierra Leone
South Africa
South Korea
Spain
Suriname
Sweden
Tajikistan
Tanzania
Thailand
Turkey
Ukraine
United Kingdom
Uruguay
USA
Uzbekistan
Venezuela
Vietnam
Zambia
Zimbabwe
TABLE 2 – PRIMARY COMMODITY CONTAINED IN ORE SAMPLES WHICH HAVE HAD SMC TESTS CARRIED OUT ON THEM
Basalt
Bauxite
Bentonite
Coal
Cobalt
Copper
Diamond
Fluorspar
Gold
Graphite
Hematite
Iodine
Iron ore pellets
K-Feldspar
Lead
Lithium
Magnetite
Manganese
Molybdenum
Nickel
Niobium
PGM
Phosphate
Polymetallic sulphides
Rare Earths
Silver
Tin
Titanium
Tungsten
Uranium
Vanadium
Zinc