")
")

The SMC Test® is the most widely-used comminution test in the world for AG & SAG Mills, HPGRs and Crushers.
The SMC Test® was developed to provide a range of useful comminution parameters through highly controlled breakage of rock samples. Drill core, even quartered small diameter core is suitable. Only relatively small quantities of sample are required and can be re-used to conduct Bond ball work index tests.
The results from conducting the SMC Test® are used to determine the so-called drop-weight index (DWi) which is a measure of the strength of the rock as well as the comminution indices Mia, Mih and Mic. In conjunction with the Bond ball mill work index they can be used to accurately predict the overall specific energy requirements of circuits containing:
• AG and SAG mills.
• Ball mills
• Rod mills
• Crushers
• High Pressure Grinding Rolls (HPGR)
For detailed information about how this can be done click here for the document “Using the SMC Test® to Predict Comminution Circuit Performance” (PDF, 99KB) which describes the equations and/or click here to use our on-line specific energy calculator. This easy-to-use calculator is based on equations which have been benchmarked against large and varied data bases of operating circuits and equipment, ensuring that the resultant predictions should match operating experience as shown in Figures 1-3 .
The SMC Test® also generates the JK rock breakage parameters A, b and ta as well as the JK crusher model’s t10-Ecs matrix, all of which are generated as part of the standard report output from the test. These values can be used to simulate crushing and grinding circuits using JKTech’s simulator – JKSimMet.
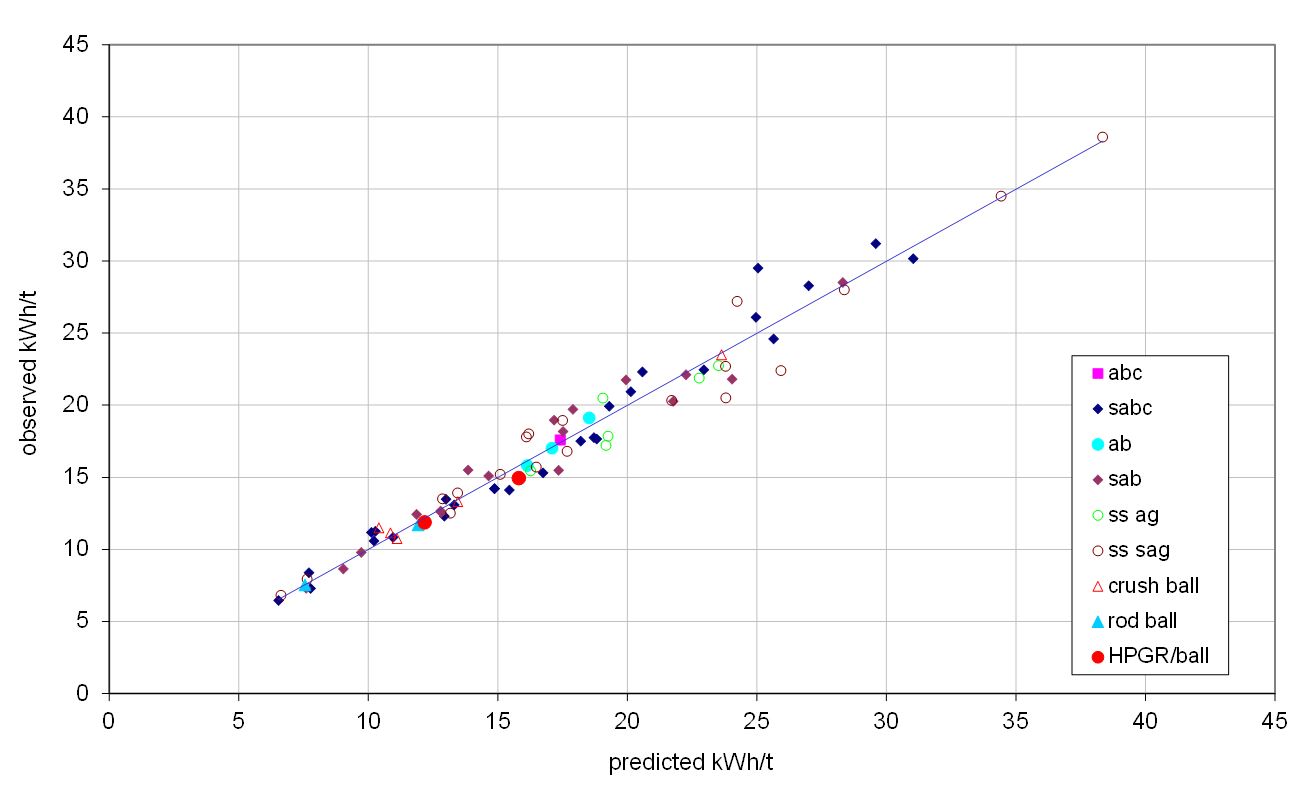
Figure 1 – Measured vs Predicted Total Comminution Circuit Specific Energy for a Wide Range of Different Circuit Types
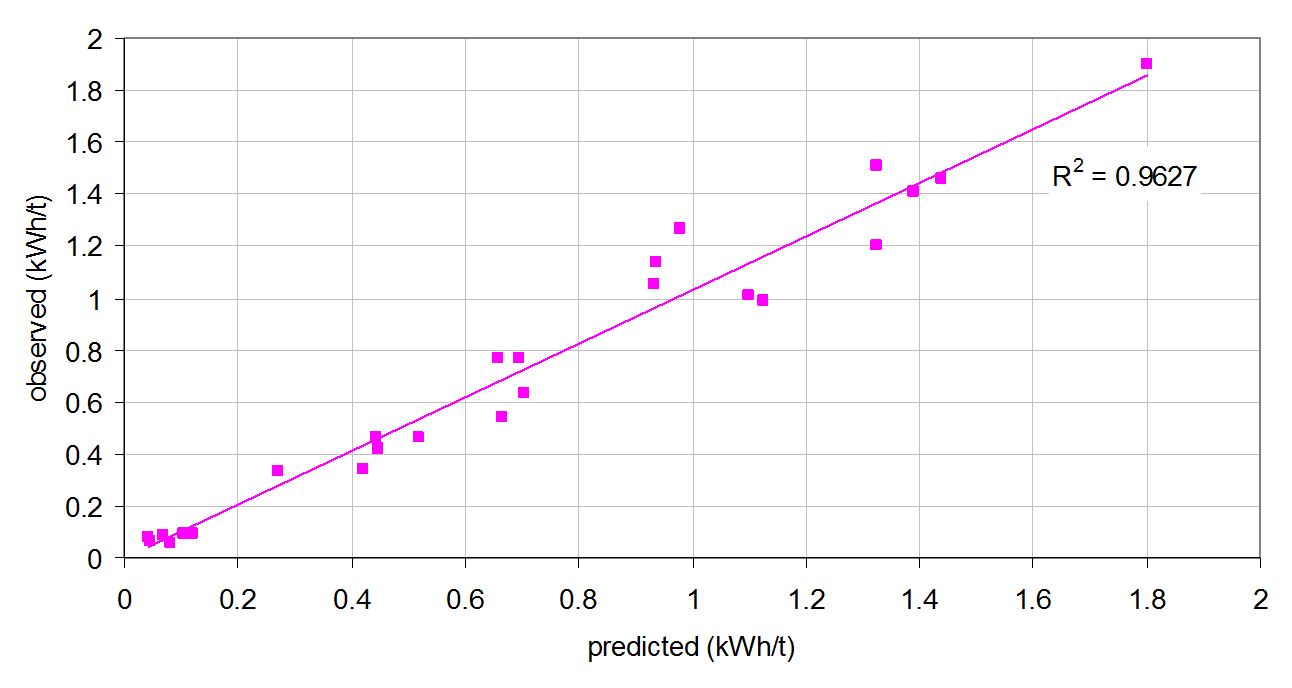
Figure 2 – Measured vs Predicted Specific Energy for Primary, Secondary, Tertiary and Pebble Crushers
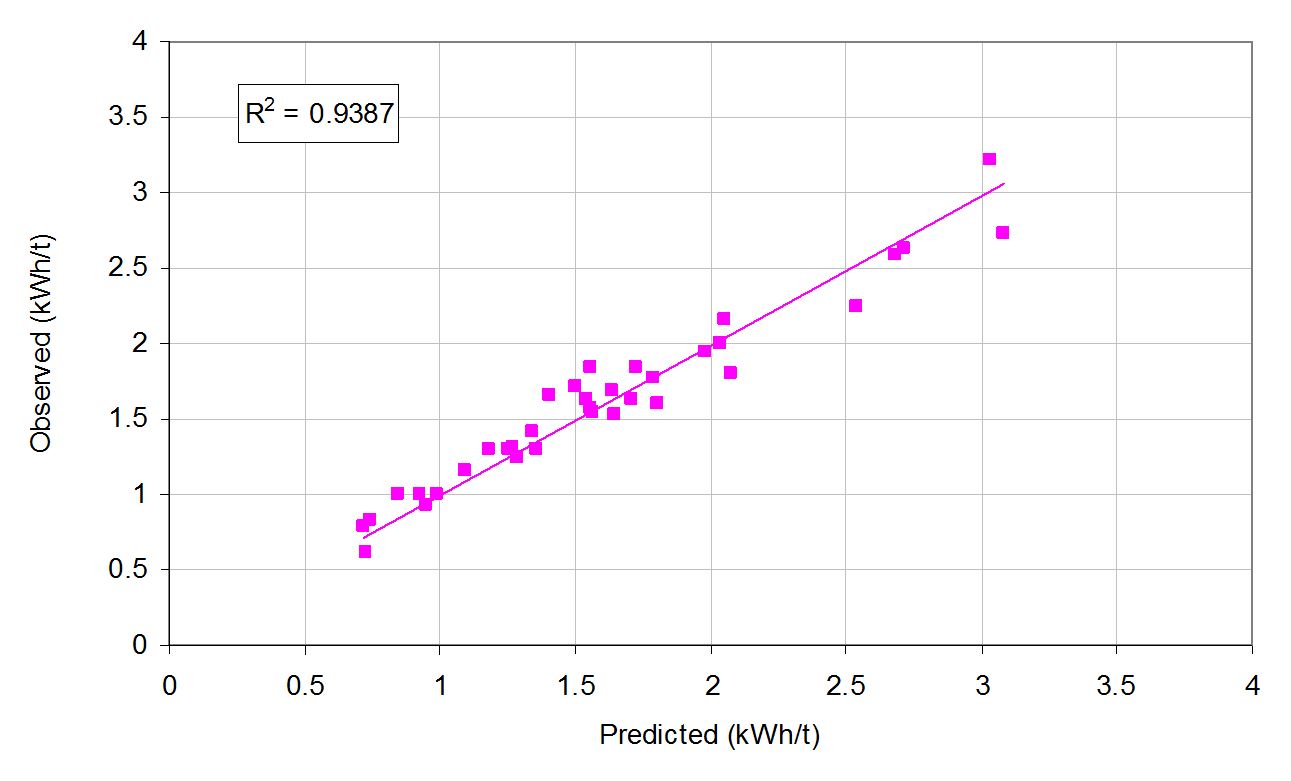
Figure 3 – Measured vs Predicted Specific Energy for High Pressure Grinding Rolls
BACKGROUND
The SMC Test® is a precision test that uses either crushed rock pieces that are very closely sized (so-called crush and select method) (Figure 4) or particles that are cut to similar size from drill core using a diamond saw (Figure 5). The latter approach (so-called cut-core method) is used when limited drill core sample is available. Almost any drill core size is suitable, even core that has been quartered (slivered). The chosen particles are broken using a closely controlled range of impact energies. The high degree of control imposed on both the size of particles and the energies used to break them means that the test is largely free of the repeatability problems which plague tumbling mill rock characterisation tests. Such tests usually suffer from variations in feed size, which are not closely controlled, as well as energy input, which although is often assumed to be constant is often highly variable.

Figure 4 – Particles Selected for SMC Testing from Crushed Rock

Figure 5 - Particles Selected for SMC Testing from Cutting Drill Core
The question is sometimes asked as to whether there is any difference in SMC Test results between using cut core or crushed core samples. This was considered during the early development of the SMC Test and testing protocols were tailored to ensure that no differences resulted. To confirm this experiments were carried out in which large lumps of ore were cored and the remains of the lumps then crushed. Test pieces were then prepared from the drill core using the cut core method whilst the crush and select method was used on the crushed lump material. Both types of sample were then broken independently in the drop-weight tester to determine if there were differences in the results. The raw data from these tests are shown in Figure 6. No significant difference between the two data sets was found.
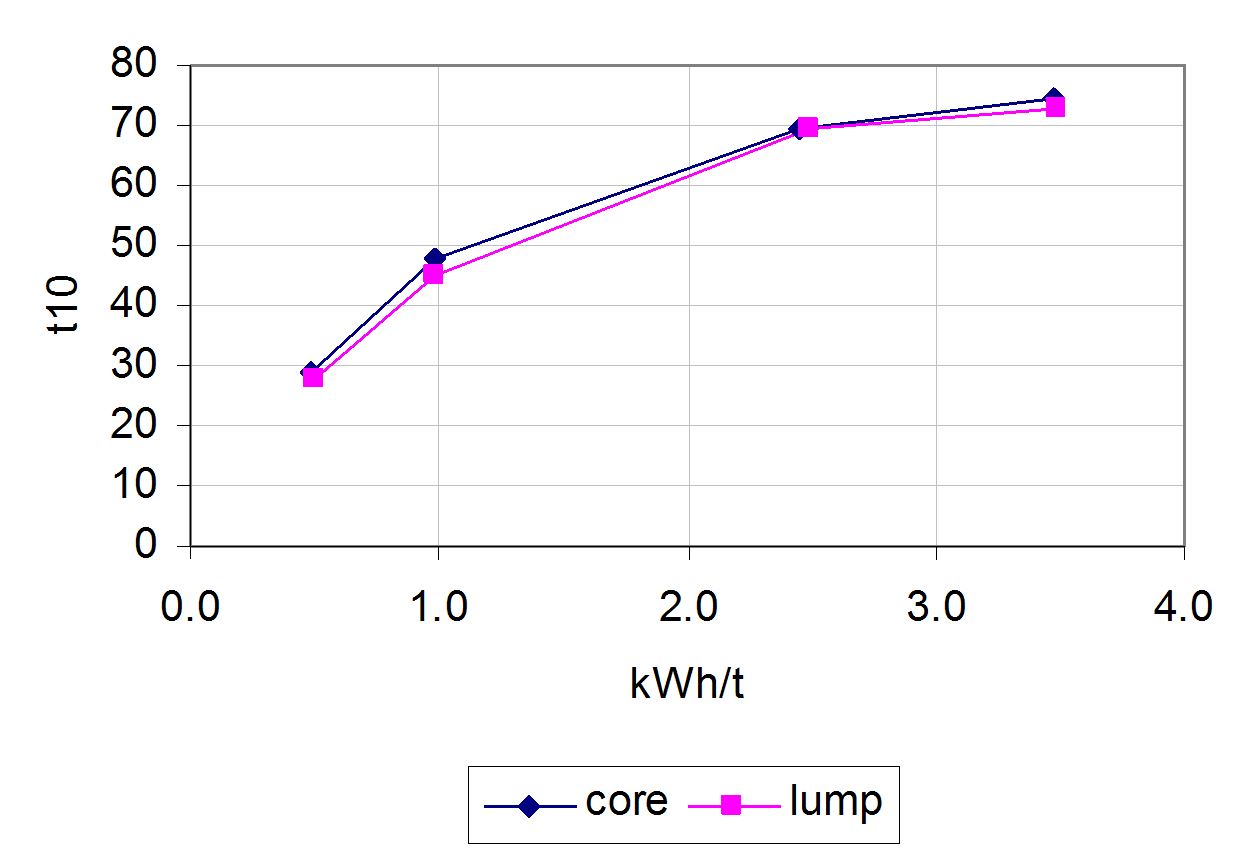
Figure 6 – Cut Core vs Crushed Core Test Results
SAMPLE QUANTITY
The amount of sample that is required depends on what sources are available to provide the rock samples eg, is it drill core, what size of core is it, is it whole, halved or quartered as well as the size fraction chosen to do the SMC Test® and whether the sample is going to be prepared by crushing or cutting. These factors are best discussed with your local metallurgical laboratory when you are at the planning stage. However, in the majority of cases 15-20 kilograms is more than enough to conduct a single test if feed preparation is being carried out by crushing the drill core first of all (crush-and-select method). However, if the sample is to be prepared by cutting with a diamond saw (cut-core method) as little as 5kg is normally sufficient. Also remember that the products from the SMC Test® can be re-used for Bond ball work index testing, the SMC Test® being effectively used as a feed preparation step for the Bond ball work index test. As a general rule Bond ball work index tests are recommended when SMC Tests® are carried out as this provides valuable additional information on the way that much finer particles break.
NUMBER OF SAMPLES
Contrary to what some published literature claims, the number of samples required is related to the variability of the deposit and not the type of comminution test used. Also the end use will influence the number of samples required. Hence if samples are required for a pre-feasibility study the number will be relatively low, whilst if samples are required for the development of a Geometallurgical model that has the ability to accurately forecast daily grinding circuit throughput, the number required will be at least an order of magnitude higher. In all cases a staged approach to sample selection and laboratory testwork is recommended to ensure that costs are kept to a minimum. Each stage should be designed to build on the knowledge gained from preceding ones, particularly concerning variability, both spatially within the pit as well as in terms of absolute hardness values. For information on how to determine what the appropriate number of samples should be, click here to download the paper “How to Formulate an Effective Ore Characterization Program”
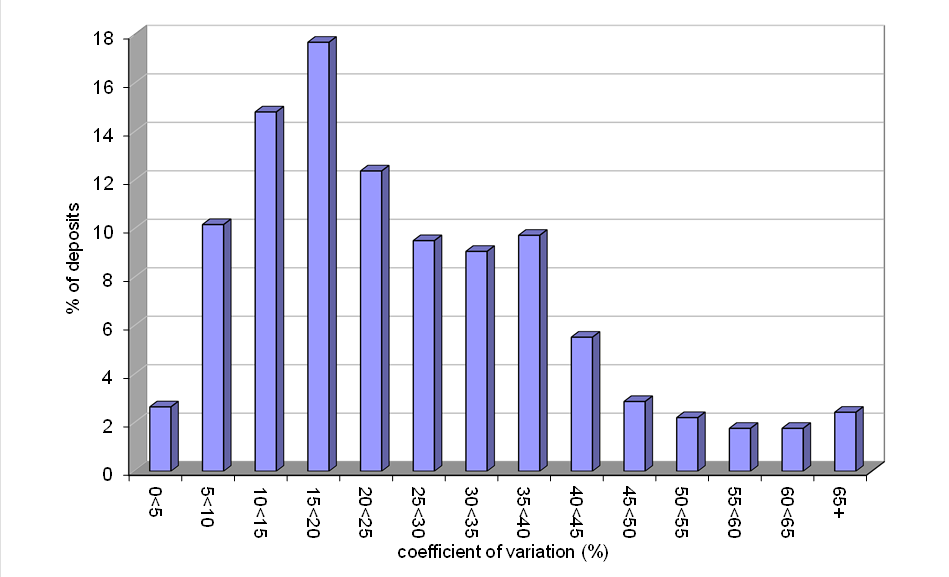
Figure 7 – Histogram of Ore Body Variability as Indicated By the DWi Parameter
SIZE SCALING
For Determination of Mia, Mih and Mic Parameters
Formerly called “Calibration”, a more appropriate term is particle “Size Scaling”. NO SIZE SCALING is required to generate Mia, Mih and Mic parameters from a SMC Test as they are fixed functions of the DWi, which in turn is produced as a standard output from the SMC Test®.
For Determination of A and b Parameters
Where the SMC Test® is used to estimate values of A and b (used in the JK AG/SAG mill model) a so-called “Size Scaling ” factor may be required. The relationship between the DWi and the JK rock breakage parameters A and b makes use of the size-by-size nature of rock strength that is often apparent from the results of well controlled tests on different size fractions. This is illustrated for a range of different rock types in Figure 8, which shows how the gradients of the plots of normalised values of A*b vary with particle size. In the case of a conventional drop-weight test the A*b values for each particle size are effectively averaged and a mean value of A and b is reported. The SMC Test® uses a single size and makes use of relationships such as that shown in Figure 8 to predict the A and b of the particle size that has the same value as the mean for a full drop-weight test through the use of a size scaling factor. The average particle size of a full drop-weight test is approximately 30mm and where the SMC Test® is carried out on particles similar to this size the size scaling factor approaches unity. In cases where the particle size used in the SMC Test® is not 30mm, eg where only relatively small diameter drill core is available or the drill core has already been slivered into half or quarter core, then a size scaling factor will need to be applied.
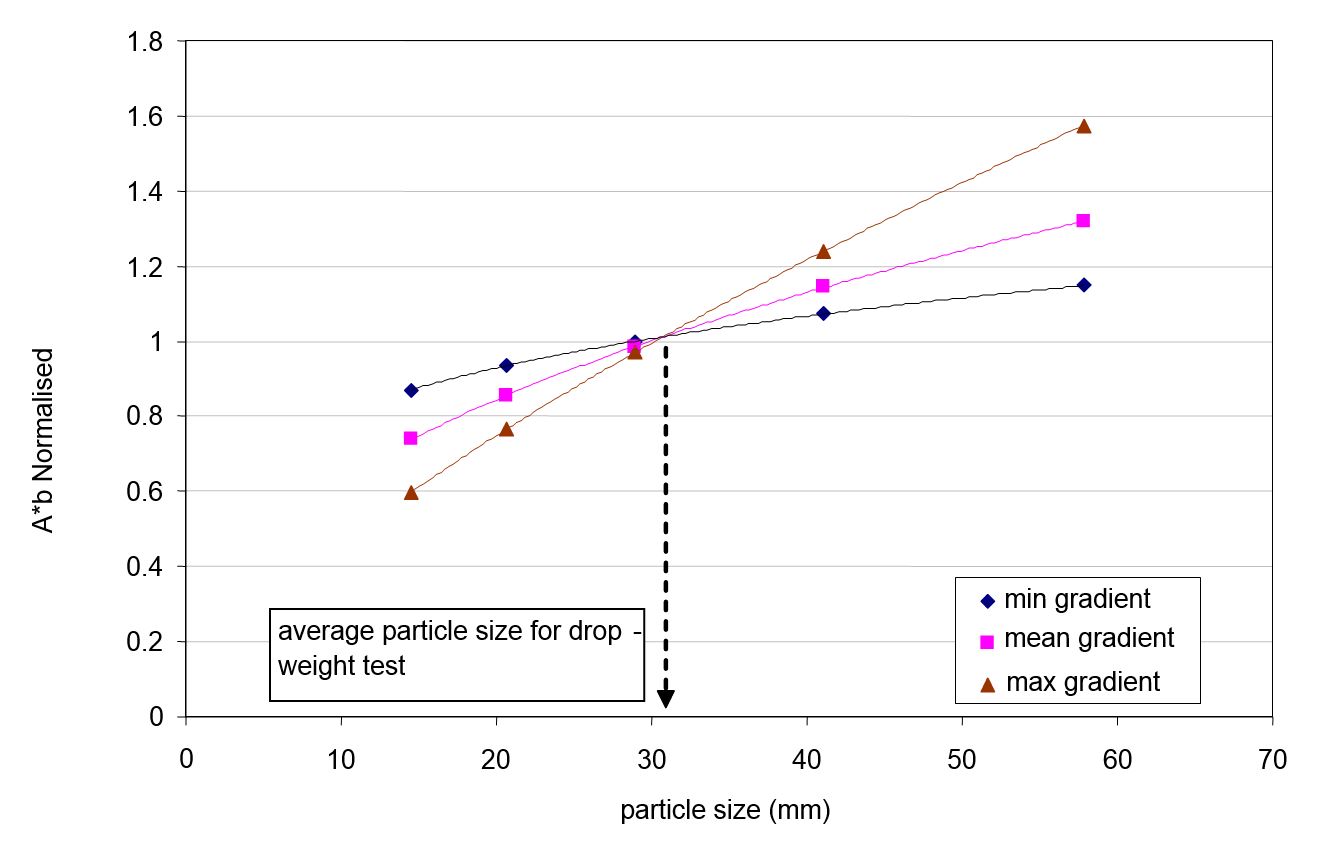
Figure 8 – Relationships Between Particle Size and the Product of A and b
Determination of the size scaling factor can be done in three ways:
- Using the SMC Testing data base: size scaling factors may be applied by using SMC Testing’s extensive data base. The choice of whether to do so will depend on the particle size that is used for the tests, the end-use of the results and the accuracy required by the user. To help guide clients in this decision over 500 drop-weight tests on different ores were analysed together with SMC Tests carried out on the same samples. Figure 9 shows the results of the SMC Tests that were carried out using nominal 28mm particles. The tests were analysed using SMC Testing’s data base size scaling and also using c size scaling factors derived from the associated drop-weight tests. As can be seen the correspondence between results is excellent with scatter from using the data base size scaling factors being marginally greater than when drop-weight tests were used. Figure 10 shows a similar graph but this time SMC Tests that were carried out on 20mm are shown. The results are still very good but the scatter has increased marginally indicating an equivalent marginal loss in accuracy.
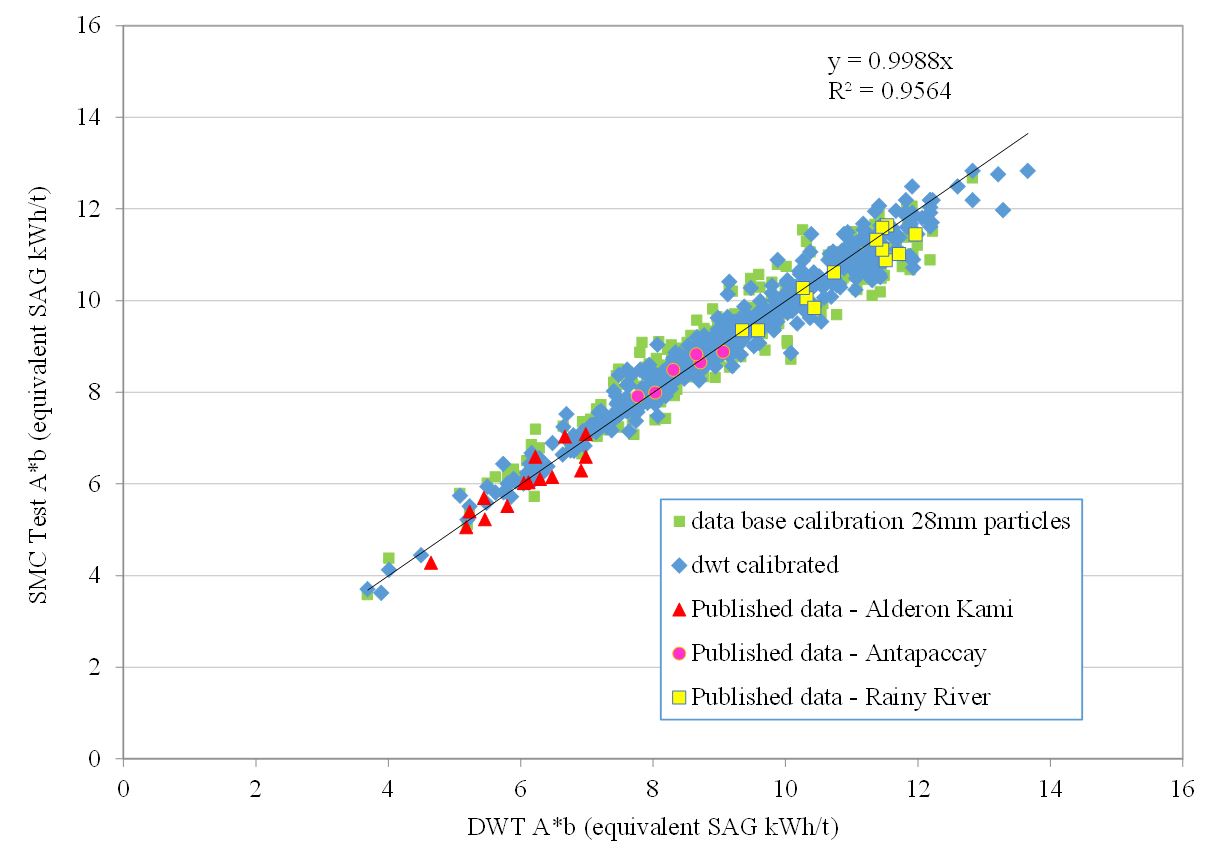
Figure 9 – SMC Test A*b Values From Using 28mm Particles Using Size Scaling Factors from SMC Testing’s Data base Compared to Using Drop-weight Tests
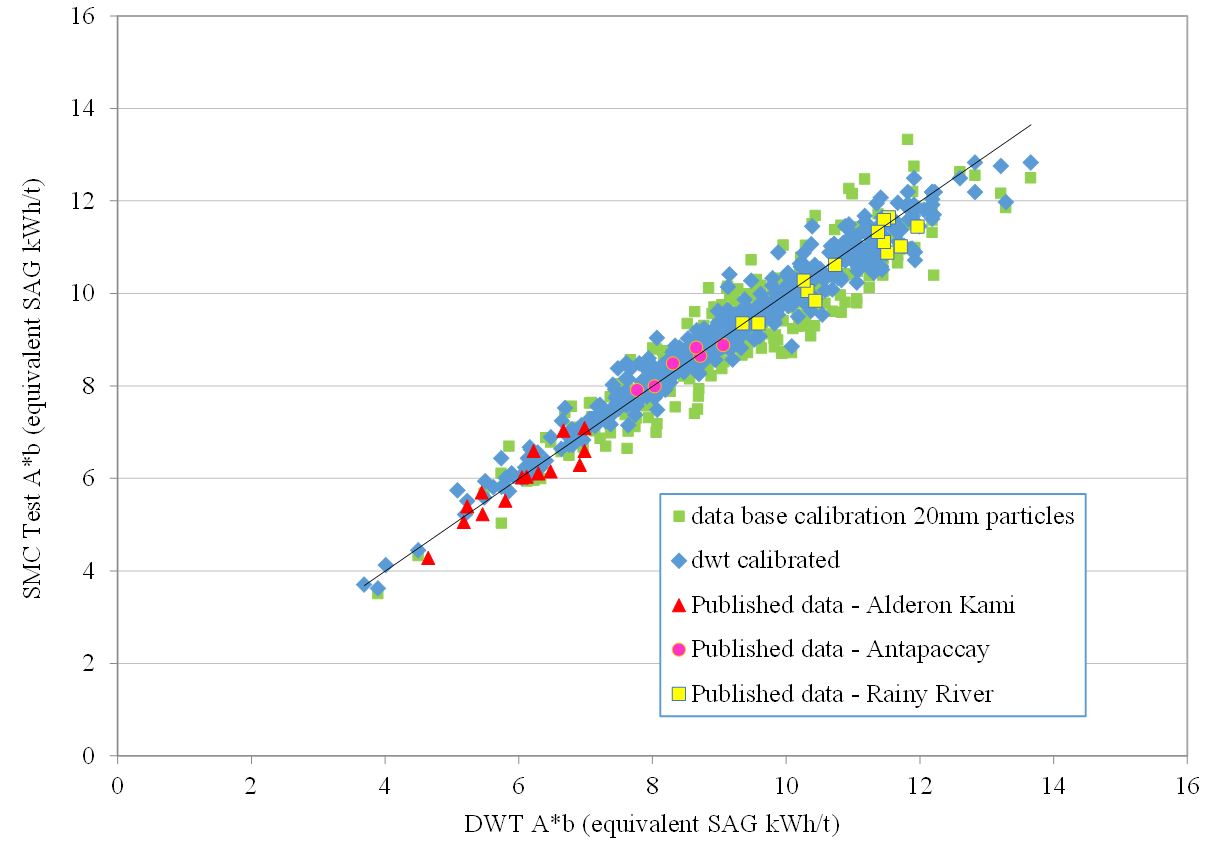
Figure 10 – SMC Test A*b Values From Using 20mm Particles Using Size Scaling Factors from SMC Testing’s Data Base Compared to Using Drop-weight Tests
- Using the results from a full drop-weight test on an ore sample representative of the type used in the SMC Test®: In this case the standard drop-weight test raw data are analysed on a size-by-size basis. As 5 different size fractions are used in a full drop-weight test, this generates 5 different values for A*b which should fall on a smooth curve such as those illustrated in Figure 8. This curve is used to estimate the A*b value of the average size used in the drop-weight test and the A*b value of the size used in the SMC Test®. The results are used to determine the size scaling factor appropriate for other SMC Tests® on similar ore types. Due to the way the drop-weight test is carried out and the fact that only three data points are available per size fraction to determine the size-by-size A*b relationship, scatter is often apparent in the result, making the determination of the true size-by-size relationship difficult. As a result the preferred technique is to use the third method.
- SMC Tests® are carried out on three different size fractions from a representative ore sample. The recommended size fractions are: -31.5+26.5mm, -22.4+19.0mm, -16.0+13.2mm. As the SMC Test® is so closely controlled, plus the fact that five data points per size fraction are generated, the A*b variation with particle size is much easier to determine than in a full drop-weight test. This relationship is then used to determine the size scaling factor appropriate for other SMC Tests® on similar ore types.