")
")

Benchmarking is the process of comparing something, in this case energy consumed for comminution at a particular concentrator, with a standard, the purpose being to determine whether the comminution circuit is achieving best performance. If it is not, then an opportunity exists for improving performance. Clearly, for benchmarking to be possible a standard needs to be available. Such a standard exists, via the so-called “Morrell Method” which was formally adopted by the Global Mining Standards and Guidelines Group in 2008. The methodology involves surveying the comminution circuit in question and obtaining accurate measurements of the feed size, product size, throughput and power draw. At the same time a representative sample of the feed ore is taken and subjected to SMC Test and Bond ball work index tests. Using the feed size and product size from the survey and the results from the SMC Test and Bond tests, Morrell’s equations are then used to predict what the expected overall comminution energy should be. This value, which is represented as the ratio of the energy consumed divided by the tonnes processed, constitutes the benchmark value for this circuit. This ratio is called the “specific energy” and in the metric system is represented in the units of kWh/tonne. A detailed description of the Morrell method, including equations and worked examples, can be found from the document “Morrell method for determining comminution circuit specific energy and assessing energy utilization efficiency of existing circuits” which can be downloaded from this page or from the Global Mining Standards and Guidelines Group’s (GMG Group) website.
All of the following circuits are covered by the Morrell Method Benchmark:
- Autogenous (AG) milling followed by ball milling
- AG miiling with pebble crushing followed by ball milling
- Semi-autogenous (SAG) milling followed by ball milling
- SAG milling with pebble crushing followed by ball milling
- Single stage AG milling
- Single stage SAG milling
- Multi-stage crushing followed by ball milling
- Multi-stage crushing followed by rod milling followed by ball milling
- Multi-stage crushing followed by High Pressure Grinding Rolls followed by ball milling
The Morrell Method, therefore, gives the benchmarking standard with which to compare the specific energy (kWh/tonne) that the circuit in question is actually consuming. As the survey of the comminution circuit measures the operational power draw (kW) and throughput (tonnes/hr), ratioing these two values gives the actual specific energy of the circuit. If this actual value is higher than the Morrell Method standard value then there is a potential for improving the energy efficiency of the circuit. Graphically this can be seen from Figure 1, the data coming from Barrick Gold’s 2008 benchmarking project. If the actual kWh/t from the survey data of the comminution circuit in question is plotted on this graph against the associated Morrell method standard and it falls to the right of the Benchmark line the performance of the circuit is judged to be less than expected. The further the data point is from the Benchmark line the greater the opportunity is for improving energy efficiency. Data points falling on the Morrell Benchmark line are judged to be performing as expected, whilst if they fall to the left of the line they represent world’s best practice.
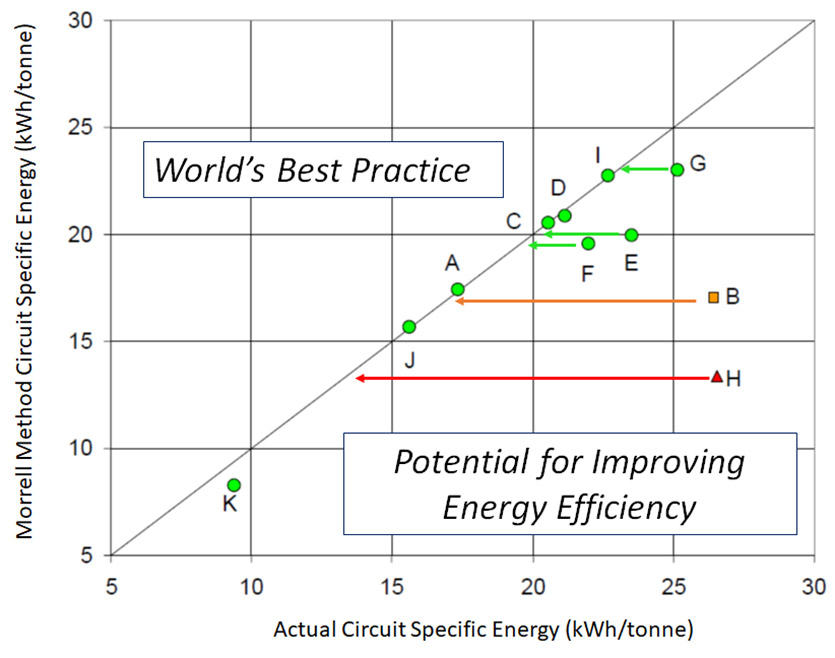
Figure 1 – Actual Specific Energy for Comminution Circuits A-K vs Morrell Method Benchmarking Standard Value (Circuits B,E,F,G and H have the potential to improve energy efficiency)
By way of a specific example let us consider an operating SABC circuit that we wish to benchmark to determine whether it is operating efficiently. A survey of the circuit was carried out during which selected on-line data were recorded as averages over the same period of time that samples were collected from selected streams. As a general guide for conducting such surveys, as far as possible the period selected for the survey should be when the grinding circuit is operating under conditions that reflect normal performance. The circuit should also be as far as possible under steady state conditions ie throughput and power draw relatively stable. The minimum period for the duration of survey should be about 1 hour.
On-line data were as follows:
|
Circuit throughput: |
1687 tonnes/hr |
|
SAG mill power draw: |
19875 kW |
|
Ball mill power draw: |
17980 kW |
|
Pebble crusher power draw: |
650 kW |
|
Pebble crusher no-load power: |
120 kW |
Checks were made to ensure that the throughput data were in terms of dry tonnes/hr. Dry tonne/hr are obtained from raw weightometer readings less a moisture content allowance. Power draw data were also checked to determine whether they were raw motor input readings or were adjusted figures to approximate net/power-at-pinion values. In this case the throughput data were found to be raw weightometer readings and hence were adjusted to dry figures by using a moisture content of 3%. Throughput was hence estimated to be 1636 dry tonnes/hr. Power draw data were confirmed as being measured at motor input. The Morrell Method for grinding mills is based on predicting the specific energy at the pinion shaft. To adjust the power draw measured at the motor input to power at the pinion a 6.5% correction was made. In the case of crushers the Morrell Method relates to motor input power less no-load power (net power). Hence the original survey data after corrections is now:
|
Circuit throughput: |
1636 dry tonnes/hr |
|
SAG mill power draw at pinion: |
18583 kW |
|
Ball mill power draw at pinion: |
16811 kW |
|
Pebble crusher net power draw: |
530 kW |
The total milling circuit specific energy and pebble crushing specific energy is therefore given by:
|
Total milling specific energy at pinion: |
21.63 kWh/tonne |
|
Pebble crushing net specific energy: |
0.32 kWh/tonne |
|
Total circuit specific energy: |
21.95 kWh/t |
From samples taken from the SAG mill feed and ball mill cyclone overflow, sizings returned the following values:
|
SAG mill feed P80: |
100 mm |
|
Ball mill cyclone overflow P80: |
106 microns |
A number of samples were taken from the SAG mill feed belt and subjected to SMC Tests and Bond ball mill work index tests. Note that the Bond tests were conducted using 150 microns as the closing screen size so that the final product size from the tests was similar to the 106 microns measured during the survey. The results from these tests are averaged and the results below are obtained:
|
Parameters |
value |
|
sg |
2.7 |
|
DWi |
6.5 kWh/m3 |
|
Mia |
19.4 kWh/t |
|
Mib |
18.8 kWh/t |
|
Mic |
7.4 kWh/t |
|
Mih |
13.9 kWh/t |
Using the Comminution Specific Energy resource on this website or following the detailed procedure from the GMG Group’s document “Morrell method for determining comminution circuit specific energy and assessing energy utilization efficiency of existing circuits” which can be downloaded from this page, the above data returns the following values:
|
Total milling specific energy at pinion: |
18.0 kWh/tonne |
|
Pebble crushing net specific energy: |
0.30 kWh/tonne |
|
Total circuit specific energy: |
18.3 kWh/t |
The analysis indicates that the SABC circuit is less energy efficient than expected (see Figure 2) and in this case there is a potential saving in energy to be gained of about 3.65 kWh/t (approximately 20%).
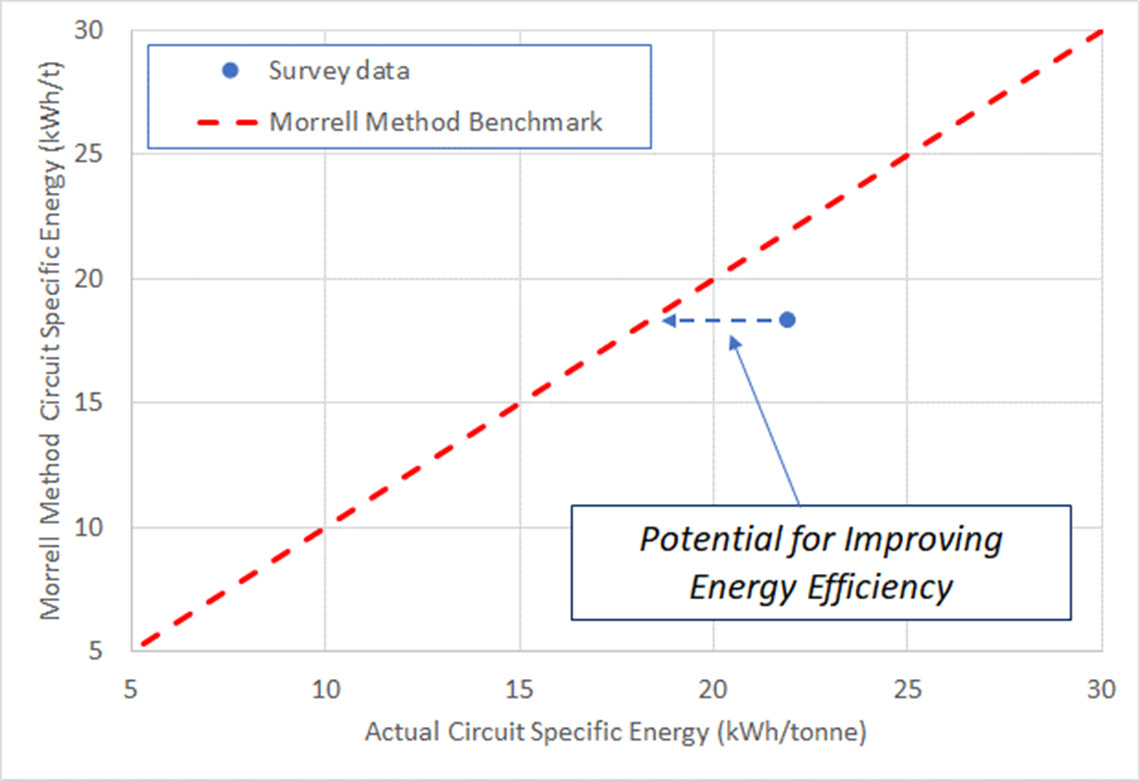
Figure 2 – Actual Specific Energy vs Morrell Method Benchmarking
Further information on how this technique has been used for benchmarking purposes and subsequently to improve energy efficiency can be found in Barrick Gold Corporation’s paper “Improving Energy Efficiency in Barrick Grinding Circuits” which is available for download on the SMC Testing website. The work described in this paper was awarded the prestigious CEEC medal in 2012 (https://www.ceecthefuture.org/news/2012-winner ).