")
")

Where a comminution circuit is already in operation, there are typically two phases to energy efficiency analysis. The first involves the determination of whether the circuit is using more energy than is necessary to crush/grind from a specified feed to a specified product. If it is, then there is an opportunity to reduce energy consumption, and hence save money whilst at the same time lowering greenhouse gas emissions. Alternatively, the saved energy can be used to increase production, thereby increasing revenues for no additional energy cost. The question is: “how do I determine whether a particular circuit is using more energy than is necessary?”. The answer can be found by following the so-called “Morrell Method” in the “Morrell method for determining comminution circuit specific energy and assessing energy utilization efficiency of existing circuits”, which can be downloaded from this page. The methodology involves surveying the circuit in question and obtaining accurate measurements of the feed size, product size, throughput and power draw. At the same time a representative sample of the feed ore is taken and subjected to SMC Test and Bond ball work index tests. Using the feed size and product size from the survey and the results from the SMC Test and Bond tests, Morrell’s equations are then used to predict what the expect overall specific energy (kWh/t) should be. This value constitutes the benchmark value for this circuit. During the development of Morrell’s equations this same exercise was done at 120 different circuits that were considered to have been operated reasonably well. The result was the graph shown in Figure 1, which is the Morrell method’s benchmarking curve. If the measured specific energy is higher than the Morrell equation’s value, ie to the right of the benchmarking curve, then there is a possibility that the circuit is operating with a lower energy efficiency than expected. Hence there exists an opportunity to improve energy efficiency. Barrick Gold used this methodology over the period 2008-2009 across all of their sites to identify where the potential existed to improve energy efficiency. Figure 2 shows the results they obtained from initially benchmarking their sites using the Morrell method. Barrick went on to make significant energy efficiency and productivity gains at sites B, E and H (Buckingham et al 20111). This work was awarded the prestigious CEEC medal in 2012.
Before savings can be realised the second phase needs to be carried out in which sources of inefficiency have to be identified and then corrected. This phase typically involves studying how individual units within the circuit are being operated and whether there is scope to operate them in a better way. For example, it may be that the cyclones in the classification circuit are being operated such that large amounts of final product are finding their way back to the grinding mill. If so, this unnecessarily uses up energy in the grinding mill. Often adjustments to cyclone geometry, operating pressures and feed water content can correct this behaviour, leading to gains in ball mill circuit energy efficiency. Another example may be that the balls in the ball mill are too large for the final grind being targeted. Using smaller balls increases grinding ball surface area and, within limits, may allow more particles to be ground for the same amount of energy. Once again gains in ball mill circuit energy efficiency may result. Such opportunities can only be discovered by detailed study of the individual units by experienced comminution practitioners. Once potential operating improvements have been identified, simulations can then be run and the magnitude of the likely gains in energy efficiency that will result can be determined. Once this has been done an implementation program can then be carried out based on the changes that have been simulated to result in the most significant gains. Such simulations need models with the proven ability to reflect what will most likely happen in practice when changes to the circuit are made. JKSimMet is the best comminution simulator in this respect and should be the simulator of choice in such studies. The hardness parameters that the comminution models in JKSimMet require are all provided by the SMC Test. This is one of a number of unique features of the SMC Test – that it can be used for both power-based and simulation modelling.
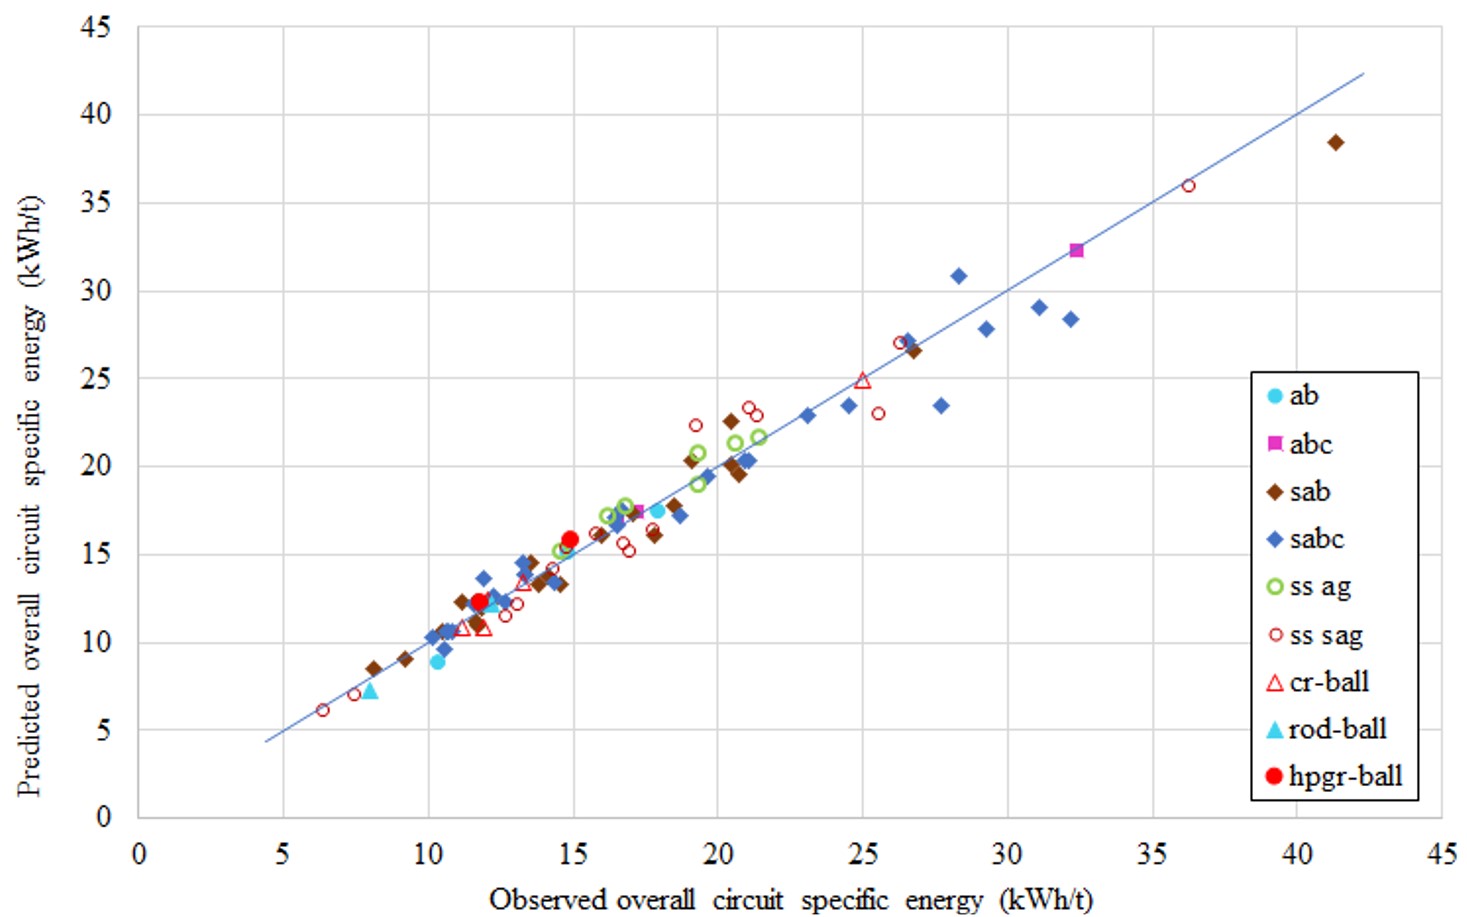
Figure 1 – Observed vs Predicted comminution circuit specific energy using Morrell equations
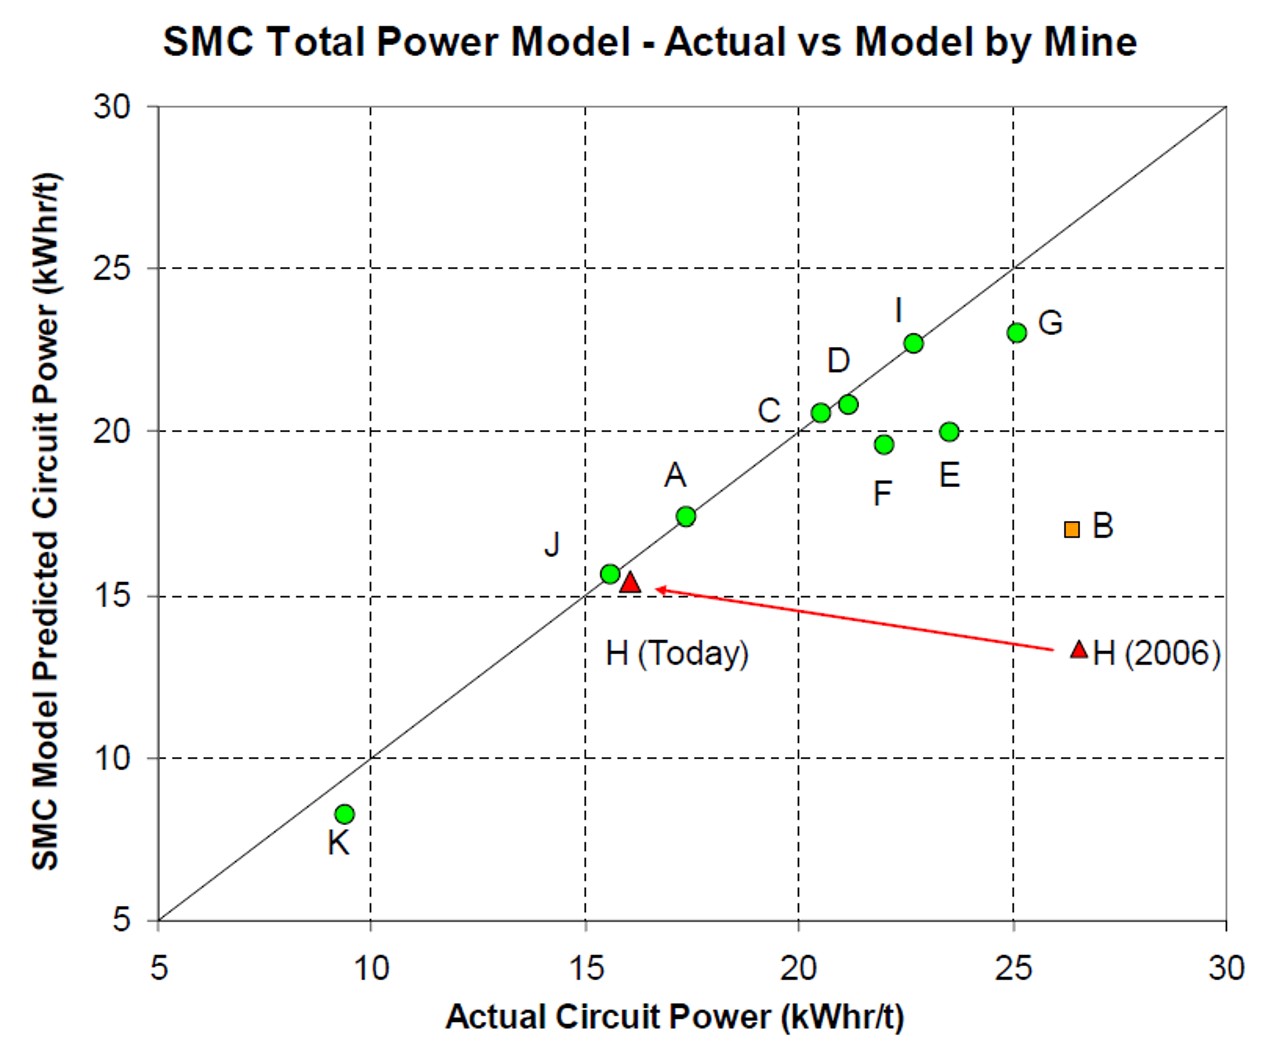
Figure 2 – Initial benchmarking of Barrick sites using Morrell method (taken from Barrick’s presentation “Grinding Circuit Modelling, Barrick’s Global Benchmarking Exercise”, CMP Annual Meeting, Ottawa, Canada, 2009.)
The discussion so far has centred on comminution circuits which are already in operation and the potential at these sites for energy savings by improving operating methods. However the energy efficiency of comminution circuits also varies depending on the flowhseet design of the circuit. So for example it is generally recognised that a crush-HPGR-ball mill circuit is more energy efficient than, say, one comprising crush-sag mill-ball-mill (Morrell,20082). At the design stage, therefore, there is an oportunity to select the most energy efficient circuit. The same “Morrell” equations that are used to benchmark existing ciruits are used in the design situation. In this case representative ore samples are sourced from diamond drill cores and are subjected to the same SMC Tests and Bond ball work index tests, the results from which are input to the Morrell equations. The specific energy requirements of a wide variety of different circuits can be then be predicted. With reference to Figure 1, which illustrates the accuracy of the equations, this includes the following configurations:
|
ab |
Ag milling followed by ball milling |
|
abc |
Ag miling with pebble crushing followed by ball milling |
|
sab |
Sag milling followed by ball milling |
|
sabc |
Sag milling with pebble crushing followed by ball milling |
|
ss ag |
Single stage ag milling |
|
ss sag |
Single stage sag milling |
|
cr-ball |
Multi-stage crushing followed by ball milling |
|
rod-ball |
Multi-stage crushing followed by rod milling followed by ball milling |
|
hpgr-ball |
Multi-stage crushing followed by hpgr followed by ball milling |
You can access calculators that utilise these equations in our resources section.
References
1.Buckingham, L., Dupont, J., Stieger, J., Blain, B., and Brits,C. 2011,”Improving Energy Efficiency in Barrick Grinding Circuits” , Proceedings of SAG 2011, Vancouver, Canada, paper #150
2. Morrell. S, 2008. “Predicting the Overall Specific Energy Requirements of AG/SAG, Ball Mill and HPGR Circuits on the Basis of Small-Scale Laboratory Ore Characterisation Tests”, Proceedings Procemin Conference, Santiago, Chile