



The content on this page was automatically generated from the PDF publication document and may contain errors or inaccuracies. Please refer to the original PDF for the most accurate information.
A Comparison through Observation and Simulation of the Power Utilisation and Performance of Two Dissimilar Comminution Plants
S MORRELL1, G JOHNSON2 and T REVY3
ABSTRACT
Dominion Mining Ltd. and the JKMRC have conducted a detailed investigation of the performance of two of Dominion Mining's gold treatment plants (Haveluck and Paddy's Flat). In terms of design each plant is considerably different. The Paddy's Flat plant uses a single stage SAG mill with recycle crusher, followed by single stage ball milling. The Haveluck plant uses the more traditional approach of multi-stage crushing and ball milling. The performance of these two plant designs in terms of energy efficiency and cost of comminution equipment, developed at the JKMRC, to accurately predict both power draw and size reduction characteristics at these plants is evaluated.
INTRODUCTION
The accurate prediction of the size reduction capability, power draw, energy utilitsation and operating costs associated with specific comminution circuit configurations is of vital importance to the plant designer. With the increasing popularity of fully autogenous (FAG) and semi-autogenous grinding (SAG), the choice in new plant design is predominantly between multi-stage crushing and ball milling, and single stage FAG/SAG followed by single stage ball milling.
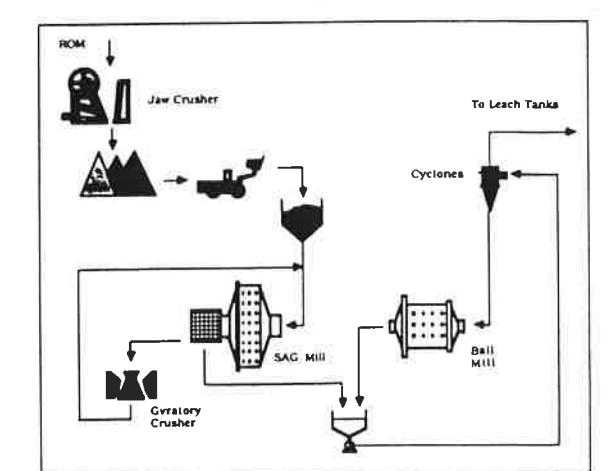
To provide comprehensive, comparative performance data on these two plant designs, Dominion Mining and Julius Kruttschnitt Mineral Research Centre (JKMRC) staff conducted detailed surveys of two of Dominion Mining's gold treatment plants. Both plants treated identical ore blends during the survey period. The two plants chosen where Paddy's Flat and Haveluck. Paddy's Flat is an example of the modern SAG mill/recycle crusher/ball mill design whilst Haveluck uses the more traditional multi-stage crushing/ball milling approach.
The JKMRC's mineral process simulator - JKSimMet - was used to mass balance the considerable volume of survey data and to model each of the circuits. Using these models in conjunction with recently developed power prediction techniques, the ability of simulation to accurately predict size reduction and power performance of complex plant configurations was evaluated.
PLANT DESCRIPTION
The Haveluck and Paddy's Flat plants are both located in the Meekatharra district of Western Australia. Haveluck opened in 1980 as the first carbon-in-leach plant in Australia. Due to rationalization its operation was recently discontinued, but up till that time it treated approximately 650,000 tonnes of ore per year. Paddy's Flat was commissioned in 1988 and is now Dominion Mining's sole treatment plant in this area, milling up to 1.3 million tonnes per year.
- Project Leader Julius Kruttschnitt Mineral Research Centre. 1.
- Group Metallurgist Dominion Mining Ltd.
- Senior Metallurgist Dominion Mining Ltd.
A schematic of the Paddy's Flat comminution circuit is shown in Figure 1. It comprises an open circuit jaw crusher feeding a SAG Mill in closed circuit with a gyratory crusher. This circuit is followed by a single stage ball mill in closed circuit with cyclones. Crushing and milling equipment details are given below.
Jaw Crusher:
Type
# Jaques 42" x 36"
Motor
150 kW
Nominal OSS
: 150 mm
Gyratory Crusher:
Type
Jaques #35 Gyracone
No Load Power
: 30 kW : Variable
CSS SAG Mill:
Diameter
4.05 m (inside lines)
Length
4.6 m (inside grate)
Speed
variable (0-85% critical)
Grate Aperture Pebble Port Aperture
12 x 30 mm
Ball Charge
90 x 90 mm
: 6-8% 125 mm
Ball Size Liners
: grid
Motor
: 1000 kW
Ball Mill
3.48 m (inside liners)
Diameter Length
4.62 m (inside liners)
Speed
: 16 rpm
Ball Charge
: 39-40%
Ball Size
Liners
: 67%-52 mm, 33%-65 mm
Motor
rubber 11000 kW
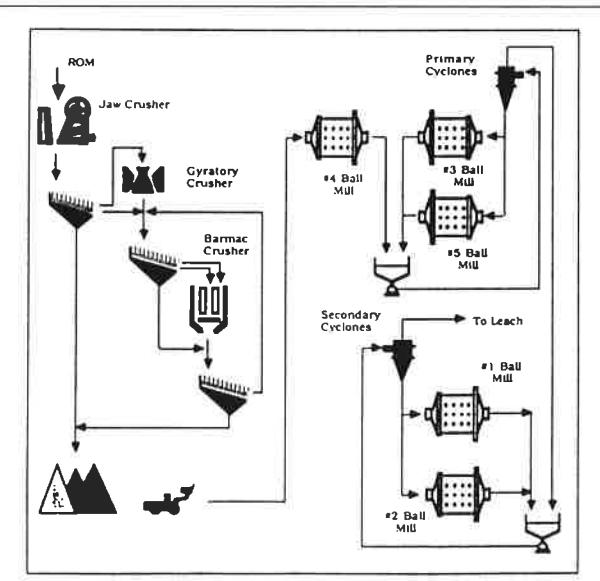
The Haveluck crushing and milling flowsheet is shown in Figure 2. This much older plant uses a more traditional approach to comminution. Crushing is carried out in 3 stages using jaw, gyratory and impact (Barmac) crushers. The milling plant has 5 ball mills configured in 3 stages. Equipment details are as follows:
Jaw Crusher:
Type
Godwin Barsby 1.05 x 0.87 m
Motor
: 150 kW
Nominal OSS
: 100 mm
Gyratory Crusher: Type
: Jaques 24"
No Load Power
: 25 kW
CSS
: 28.5 mm
Impact Crusher: Type
: Barmac
Rotor Diameter
: 0.96 m
Rotor Speed
: 1470 rpm
No Load Power
: 60 kW
Ball Mills:
| #1 | #2 | #3 | #4 | #5 | |
|---|---|---|---|---|---|
| Diameter (m) | 1.09 | 1.83 | 2.6 | 2.7 | 2.4 |
| Length (m) | 2.44 | 2.44 | 3.7 | 3.4 | 4.5 |
| Speed (%critical) | 70.3 | 70.3 | 68.5 | 78.3 | 84.1 |
| Ball Charge (%) | 35 | 35 | 35 | 36 | 36 |
| Ball Diameter (mm) | 40 | 40 | 52 | 65 | 52 |
PLANT ENERGY CONSUMPTION
Over a period of 8-10 hours both plants were fed with the same ore at a constant feedrate near to their operational capacity. During this time, frequent direct readings of power or amps were taken from all pumps, conveyors, screens, mills and crushers between (though not including) the primary crusher and leach tanks. In addition, a number of samples were taken from all ore and slurry streams and size distributions and flowrates measured. Expressed in terms of kWh/t headfeed, the power data are summarized in Table 1. Haveluck uses overall about 1 kWh/t more than Paddy's Flat in the form of comminution and screening/conveying energy. As the final grind size at each plant was different, for comparison purposes the data were corrected by calculating a Bond operating work index (Table 2). The ore treated through each plant was identical and hence comparison of the work indices solely reflects differences in overall equipment performance. It can be seen that the difference between the values is very small and is considered to be well within measurement error. It is hence concluded that there is no difference in the size reduction efficiency of the two plants. This result somewhat contradicts what has beeen generally held to be true - i.e. that SAG/FAG milling is less efficient than conventional crushing and grinding (Kjos, 1985; Jergensen and Pena, 1985).
|
Paddy's Flat
(kWh/t) |
Haveluck
(kWh/t) |
|
|---|---|---|
| Crushing (excl., primary) | 0.28 | 0.87 |
| SAG Milling | 4.86 | ė |
| Ball Milling | 5.96 | 11.04 |
| Total Comminution | 11.1 | 11.91 |
| Pumps | 1.25 | 1.30 |
| Screens and Conveyors | 0.11 | 0.33 |
| Total Materials Handling | 1.36 | 1.63 |
| Total | 12.46 | 13.54 |
| Plant |
Leach
feed |
kWh/t | |
|---|---|---|---|
| P 80 (μm) | |||
| Paddy's Flat | 143 | 13.85 | |
| Haveluck | 123 | 13.77 | |
MODELLING
Power Draw Modelling
The JKMRC's mineral process simulator; - JKSimMet incorporates models of a range of equipment including crushers, ball mills, SAG mills, screens and cyclones. The crusher model (Andersen, 1988) has an in-built power prediction capability. It is based on the theoretical power required to reduce the crusher feed in a pendulum breakage device (Narayanan and Whiten, 1983). A correction factor, indicative of the efficiency of the crusher relative to the pendulum, is applied to the pendulum power. From previous experience this factor has been found to be of the order of 1.25, varying slightly with the type of crusher. Mill power predictions can be made off-line using a model recently developed at the JKMRC. The model is based on the motion of the mill charge and its interaction with both mill speed and the volume of the charge.
Using an efficiency factor of 1.25 in the crusher model and the new mill power model for the SAG and ball mills, simulations were run to predict the power draw of the comminution machines at both plants. The accuracy of the predictions is illustrated in Table 3. It can be seen that the predicted values are very close to those observed in practice. On a variety of ball, FAG and SAG mills ranging in power draw from 100-3000 kW, the mill power model has so far been found to be accurate to within 5-10 per cent. Further development of the model is underway. On current results, however, it offers a very high degree of accuracy.
Interestingly, the predictions of the Barmac power were most in error. The data suggested that the true efficiency factor should be of the order of 1.5 rather than the 1.25 found typical of cone and gyratory crushers. Further investigations of the performance of the Barmac, however, are required to determine whether its size reduction mechanism is less efficient than conventional crushers.
| Observed kW | Predicted kW | |
|---|---|---|
| Paddy's Flat | ||
| Gyratory Crusher | 36 | 39 |
| Ball Mill | 852 | 871 |
| SAG Mill | 688 | 672 |
| Total | 1576 | 1582 |
| Haveluck | ||
| Gyratory Crusher | 31 | 33 |
| Barmac Crusher | 180 | 153 |
| Ball Mills (total) | 1003 | 1026 |
| Total | 1214 | 1212 |
Process Modelling
All the survey data from the two plants were mass balanced and crusher, SAG mill, ball mill, cyclone and vibrating screen model parameters fitted to the data. JKSimMet enables the plant operator and designer to use these parameters to evaluate flowsheet changes, optimization strategies and new plant designs.
To illustrate this ability, the Paddy's Flat ball mill parameters were used to predict the size reduction performance and material flow around the much more complex Haveluck grinding circuit (Figure 2). The results are shown in Table 4 and indicate good accuracy in the predictions of most streams both in terms of size and throughput.
| (µm) | t/h | ||
|---|---|---|---|
| Observed | Dradiated | ||
| Predicted | Observed | Predicted | |
| 769 | 731 | 203 | 245 |
| 163 | 151 | 90 | 90 |
| 326 | 323 | 200 | 237 |
| 132 | 130 | 90 | 90 |
|
163
326 |
163 151
326 323 |
163 151 90
326 323 200 |
Plant Design
Further development and testing of the JKMRC comminution models will continue. However, on the basis of the Paddy's Flat and Haveluck data, simulation can now offer accurate predictions not only of the size reduction capability of equipment but also their power utilisation as well. For existing plant flowsheet changes and for green-field plant design this facility has considerable potential. For the first time, simulation can be used to evaluate the efficiency of comminution plant designs in terms of their energy usage. It, therefore, enables the plant operator and designer to more fully evaluate the performance of a range of comminution equipment and their interaction with one another in plant configurations of considerable complexity.
OPERATING COSTS
The cost of power is only one of the components of the total operating cost associated with running a comminution plant. To compare the overall cost of operating the Paddy's Flat and Haveluck plants, historical data were collected covering steel and other consumables such as belts and screens, as well as maintenance and operating labour. These data are shown in Table 5.
| Paddy's Flat | Haveluck | ||
|---|---|---|---|
| $/t | $/t | ||
| Power | 1.94 | 1.93 | |
| Steel | 1.07 | 0.96 | |
| Other Co | nsumables | 0.16 | 0.25 |
| Total Co | nsumables | 3.17 | 3.14 |
| Labour - Oper | - Operating | 0.40 | 0.86 |
| - Maintenance | 0.09 | 0.18 | |
| Total Lal | bour | 0.49 | 1.04 |
| Total | 3.66 | 4.18 |
Total consumable costs, including power, can be seen to be almost identical at both plants. As might be expected, however, the more complex Haveluck plant is much more maintenance intensive and requires more operator supervision. Labour costs at Haveluck are, therefore, over double that of Paddy's Flat. These higher labour costs are reflected in the overall operating costs which indicate a financial premium at Paddy's Flat of 0.52 $/tonne headfeed.
CONCLUSIONS
The detailed investigations of the performance and cost of operation at Paddy's Flat and Haveluck have indicated that the energy efficiency of a single stage SAG mill/ball mill plant can equal that of a multi-stage crushing and ball milling plant design. The more complex nature of the latter design, however, carries a cost penalty in terms of maintenance and operating labour. This is reflected in the overall operating cost of the Haveluck plant being 14% higher than at Paddy's Flat.
Energy costs were found to constitute approximately 50 per cent of the total operating costs and reflects the importance at the plant design stage of being able to accurately predict the size reduction performance and power draw of comminution equipment. Mathematical models developed at the JKMRC can and do provide a powerful tool to aid in this respect and have been shown to provide a good indication of the performance of mineral process equipment in the field.
ACKNOWLEDGEMENT
This work was funded by a collaborative AMIRA project in Mineral Processing at the JKMRC, of which Dominion Mining is a sponsor.
REFERENCES
- Andersen, J.S., 1988. Development of a Cone Crusher Model. MEngSc Thesis, University of Queensland.
- Jergensen, G.V. and Pena R.F., 1985. Wet Semiautogenous Mills. SME Mineral Processing Handbook. SME/AIME, New York, Vol 1, pp 3670-3689.
- Kjos, D.M., 1985. Wet Autogenous Milling. SME Mineral Processing Handbook. SME/AIME, New York, Vol 1, pp 3661-3670.
- Narayanan, S.S. and Whiten, W.J., 1983. Breakage characteristics of ores for ball mill modelling. Proc. Australas. Inst. Min. Metall., No. 286, June 21-30