



The content on this page was automatically generated from the PDF publication document and may contain errors or inaccuracies. Please refer to the original PDF for the most accurate information.
A NEW WAY OF REPRESENTING A AND b PARAMETERS FROM JK DROP-WEIGHT AND SMC TESTS: THE "SCSE"
* V. Matei1 , C.W Bailey1 , S. Morrell2
1 JKTech Pty ltd 40 Isles Road Indooroopilly Brisbane, Australia 4068 * Corresponding author:
2 SMC Testing Pty Ltd Brisbane, Australia 4068
ABSTRACT
JKTech Pty Ltd and SMC Testing Pty Ltd have devised a new method for enhancing the usefulness of the A and b parameters by converting them to more meaningful specific energy values using a so-called SCSE parameter. To ensure quality of test results, JKTech conducts regular comparative testing programmes of which the most recent one involved the participation of 27 laboratories worldwide. The results from this programme were analysed using the SCSE values and confirmed the high precision of Drop-weight and SMC tests with a standard deviation of 3.82% for Drop-weight and 4.88% for SMC tests.
KEYWORDS
DWT, Drop Weight, SMC, A*b, Specific energy, JKSimMet, Simulations, Precision, Accuracy, SCSE
INTRODUCTION
Since their introduction in 1992 and 2004, respectively, over 4300 Drop-weight tests and 35000 SMC Tests have been conducted worldwide. The Drop-weight test was developed to generate the parameters A and b, which are used in Autogenous and Semi-autogenous (AG/SAG) modelling through the use of the comminution circuit simulator, JKSimMet (Napier-Munn et al, 1996). JKSimMet has become the most popular comminution simulator in the world and is commonly used in greenfield/brownfield and optimisation projects. Drop-weight tests need relatively large amounts of sample. To combat this the SMC Test® was developed by SMC Testing Pty Ltd (Morrell, 2004) as a cost-effective means of accurately determining the A and b parameters from relatively small amounts of small-diameter drill core. At the same time the SMC Test® also produces a range of additional parameters for use in predicting the specific energy of AG/SAG mills, crushers and High pressure Grinding Rolls (Morrell, 2009).
The parameters A and b and have no physical meaning in their own right. They are ore hardness parameters used by the AG/SAG mill model in JKSimMet which permits prediction of the product size distribution and the power draw of the AG/SAG mill for a given feed size distribution and feed rate (Morrell and Morrison, 1996). The product of A and b, referred to as A*b, has been universally accepted as the parameter which represents an ore's resistance to impact breakage. However, there are a number of drawbacks to its use. Firstly it is a qualitative measure, secondly it is inversely related to impact resistance, and lastly its relationship to impact resistance in non-linear. This last factor is particularly important when comparing the A*b values of different samples and gives rise to the somewhat counter-intuitive phenomenon that the difference in hardness between two samples with A*b values of, say 25 and 29 (15% difference), may be significantly different yet in the case of two samples with A*b values of 250 and 350 (40% difference) they may not be significantly different.
The solution to this problem that has been devised by JKTech Pty Ltd and SMC Testing Pty Ltd is to convert the A and b results from Drop-weight and SMC tests to more meaningful specific energy values. These specific energy values are related to a so-called "Standard" SAG mill circuit, the values being termed "SCSE" ( S AG C ircuit S pecific E nergy). In the following sections the derivation of the SCSE values is described. In addition the results from the most recent, and very extensive, quality control program that JKTech has conducted are evaluated using the SCSE.
DERIVATION OF THE STANDARD CIRCUIT SPECIFIC ENERGY (SCSE)
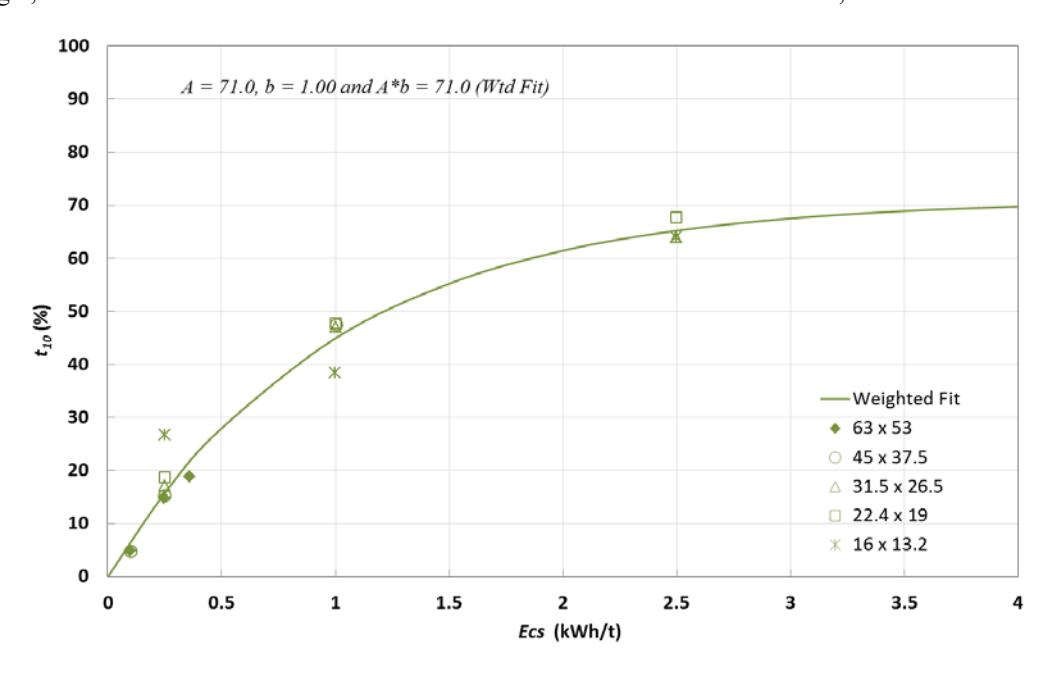
A and b parameters are determined by fitting Equation 1 to data which relate the specific input energy (ECS) used to break a given particle with the associated t10 value, where t10 is defined as the percentage of material passing 1/10th of the size of the given particle that is broken. The t10 and ECS values used to fit equation 1 are generated by the Drop-weight and SMC Tests. A typical t10 v ECS curve resulting from a Drop-weight test is shown in Figure 1.
$$ t_{10} = A*(1-e^{-b*Ecs}) $$ (1)
The parameters A and b vary with ore type and are inter-dependent. A*b is slope of the t10-ECS curve at the origin, and as has been mentioned earlier is related to ore hardness in a non-linear, inverse manner.
The parameters A and b have no physical meaning in their own right. They are ore hardness parameters used by the AG/SAG mill model in JKSimMet which permits prediction of the product size distribution and the power draw of the AG/SAG mill for a given feed size distribution and feed rate. In a design situation, the dimensions of the mill are adjusted until the load in the mill reaches 25% by volume when fed at the required feed rate. The model predicts the power draw under these conditions and from the power draw and throughput the specific energy is determined. The specific energy is mainly a function of the ore hardness (A and b values), the feed size and the dimensions of the mill (specifically the aspect ratio) as well as to a lesser extent the operating conditions such as ball load, mill speed, grate/pebble port size and pebble crusher activity. It follows from this that the only way to evaluate the true influence of A and b on ore hardness is to conduct simulations to predict the AG/SAG mill circuit specific energy ie convert the A and b values to an equivalent AG/SAG circuit specific energy. To do so a so called "Standard" SAG mill circuit was used. A flowsheet of this circuit is shown in Figure 2 and comprises a SAG mill in closed circuit with a pebble crusher.
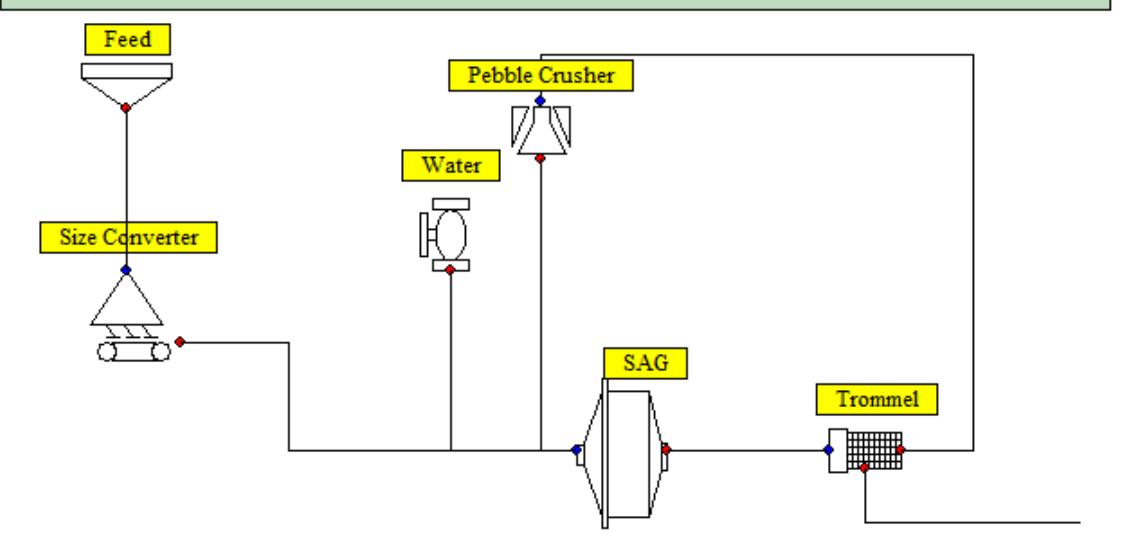
The specifications for the "Standard" circuit are:
-
SAG Mill
- o inside shell diameter to length ratio of 2:1 with 15 ° cone angles
- o ball charge of 15 %, 125 mm in diameter
- o total charge of 25 %
- o grate open area of 7%
- o apertures in the grate are 100 % pebble ports with a nominal aperture of 56 mm
-
Trommel
- o Cut Size of 12 mm
-
Pebble Crusher
- o Closed Side Setting of 10 mm
-
Feed Size Distribution
- o F80 from the ta relationship.
The feed size distribution is taken from the JKTech library of typical feed size distributions and is adjusted to meet the ore specific 80% passing size predicted using the Morrell and Morrison (1996) F80 – ta relationship for primary crushers with a closed side setting of 150 mm (see Equation 2).
$$ F_{80} = 71.3 - 28.4 * ln(t_a) $$ (2)
Simulations were conducted with A*b values ranging from 15 to 400, ta values ranging from 0.145 to 3.866 and solids SG values ranging from 2.5 to 3.7. For each simulation, the feed rate was adjusted until the total load volume in the SAG mill was 25%. The predicted mill power draw and crusher power draw were combined and divided by the feed rate to provide the specific energy consumption. The results are shown in Figure 3.
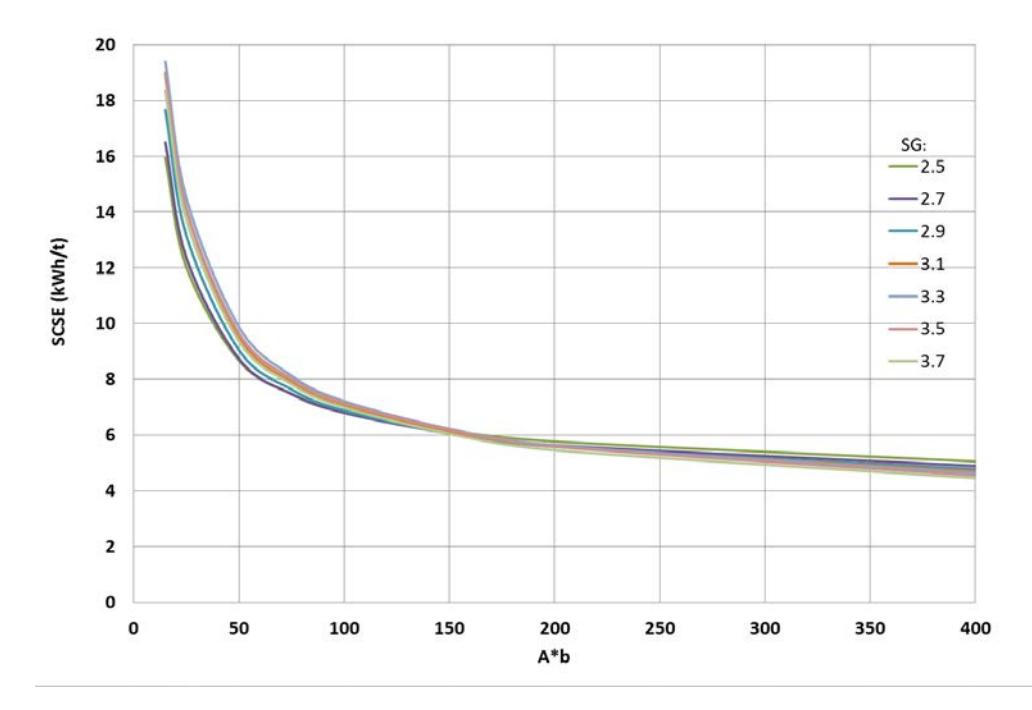
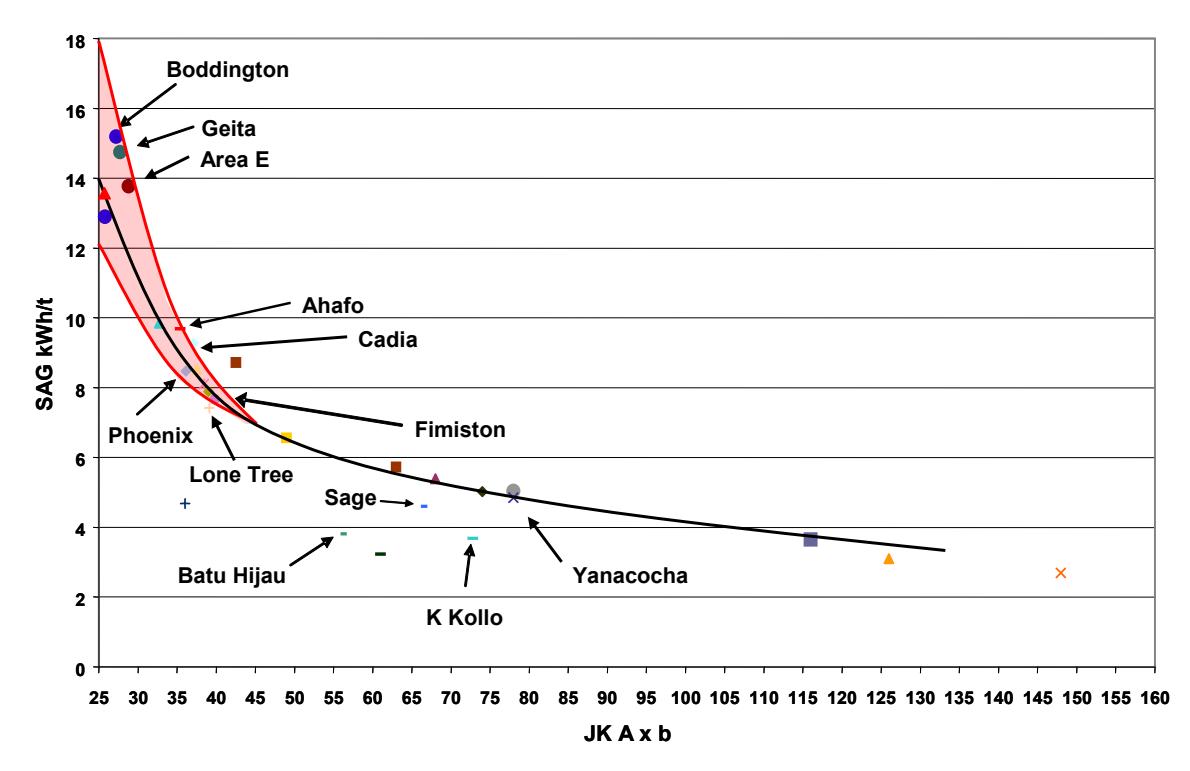
Figure 4 presents the specific energy – A*b trend for operating mills published in Veillette and Parker, 2005 and reproduced here. There is variation in the relationship for low A*b values for operating mills due to the variations present in real operations. It is of note that the family of curves representing the relationship between specific energy and A*b for the "Standard" circuit follows a similar trend to the specific energy vs A*b relationship for actual operating mills.
The specific energy value for the "Standard" circuit for the measured solids SG, SAG Circuit Specific Energy (SCSE), are now included in JKTech Pty Ltd reports of JK Drop Weight and SMC Test® results in addition to the A, b, ta and crusher matrices which are currently reported.
Of course, the SCSE quoted value will not necessarily match the specific energy required for an existing or a planned AG/SAG mill due to differences in the many operating and design variables such as feed size distribution, mill dimensions, ball load and size and grate, trommel and pebble crusher configuration. The SCSE is an effective tool to compare in a relative manner the expected behaviour of different ores in AG/SAG milling in exactly the same way as the Bond laboratory ball mill work index can be used to compare the relative grindability of different ores in ball milling (Bond, 1961 and Rowland and Kjos, 1980). However the originally reported A and b parameters which match the SCSE will be still be required in JKSimMet simulations of a proposed circuit to determine the AG/SAG mill specific energy required for that particular grinding task. Guidelines for the use of JKSimMet for such simulations were given in Bailey et al , 2009.
COMPARITIVE COMMINUTION TESTING
Background
Comparative testing is undertaken to maintain and improve quality in those tests which are managed by JKTech. An important purpose of this programme is to ensure high standards in repeatability of results. JKTech conducts such "Round robin" tests on a regular basis in conjunction with all licensed laboratories that have a Drop-weight testing machine. In the most recent program 27 laboratories participated.
Outline of Programme
For this (and previous similar programmes) samples of basalt were sourced from Mt Marrow Blue Metal Quarries Pty Ltd, west of Brisbane, Australia. This material was selected because of its homogeneity. The Mount Marrow sample was collected, crushed to -63mm and split into the required size fractions by JKTech. These size fractions are as specified below:
- -63+53 mm
- -45+37.5 mm
- -31.5+26.5 mm
- -22.4+19 mm
- -16+13.2 mm
A rotary splitter was then used to sub-divide and select the required number of particles in each size fraction for dispatch to each of the laboratories in the program, a list of which is given in the appendices. This ensured that as far as possible all sub-samples contained the same material.
Some of the laboratories (including JKTech) have 2 DW testing machines – in those cases both machines were tested as part of this programme. As stipulated in the instructions issued to each laboratory, all tests at a laboratory were to be conducted by the same operator to eliminate as much operator variability as possible.
Results
The Drop-weight test raw data from each participating laboratory were processed using the JKTech standard methodology. SMC Test® results were processed using the SMC Testing standard methodology using the so-called "data base" calibration and not using the associated Drop-weight results. The A and b values were then converted to SCSE using the new methodology discussed previously.
Drop Weight Test SCSE results
Table 1 provides a summary of the Drop-weight test SCSE results. The overall mean SCSE for all tests was 11.32 kWh/t with the mean from the JKTech laboratory (JKTech Mean in Table 1) being 11.19 kWh/t. The overall standard deviation was 0.43 kWh/t which equates to a coefficient of variation (standard deviation divided by the mean) of 3.8%. This represents the precision of the test and is comparable to the associated values reported in the literature for Bond's ball mill work index and is far superior to those reported for Bond's rod mill and crushing work index tests (Angove and Dunne, 1997)
|
Overall
Mean |
JKTech
Mean |
SD | SD (%) | Var | n | Min | Max |
|---|---|---|---|---|---|---|---|
| 11.32 | 11.19 | 0.43 | 3.82 | 0.19 | 62 | 10.37 | 12.65 |
SMC Test® results
The SMC Test® results presented in this and subsequent sections are all derived from A and b values determined using SMC Testing data base calibration. Table 2 provides a summary of the SMC Test® results. The coefficient of variation (standard deviation divided by the mean) was 4.9% and is only slightly higher than that of the Drop-weight tests. This represents the precision of the test and is comparable to the associated values reported in the literature for Bond's ball mill work index and is far superior to those reported for Bond's rod mill and crushing work index tests (Angove and Dunne, 1997).
|
Overall
Mean |
JKTech
Mean |
SD | SD (%) | Var | n | Min | Max |
|---|---|---|---|---|---|---|---|
| 11.16 | 11.10 | 0.54 | 4.88 | 0.30 | 58 | 10.34 | 12.82 |
Labs with 2 Testers
Labs 2, 5, 13 and JKTech all possess two Drop-weight testing machines. The mean SCSE values of each pair of results from both machines were compared to each other by means of t-tests. T-tests are used to compare the means of 2 populations in order to determine if the differences are statistically significant. The test returns a value of P which conventionally, a value lower than 0.05 indicates that the 2 means are significantly different. The results in Table 3 show that all the P-values were higher than 0.05 indicating that no significant differences were observed at better than 95% confidence interval between the pair of results from the two testers at each applicable lab.
| DWT SCSE | SMC SCSE | ||||
|---|---|---|---|---|---|
| Test type | P-value | Test type | P-value | ||
| JKTech | Equal variance | 0.159 | Equal variance | 0.844 | |
| Lab2 | Equal variance | 0.194 | Equal variance | 0.697 | |
| Lab5 | Equal variance | 0.220 | Unequal variance | 0.570 | |
| Lab13 | Equal variance | 0.079 | Equal variance | 0.973 | |
CAPABILITY ANALYSIS
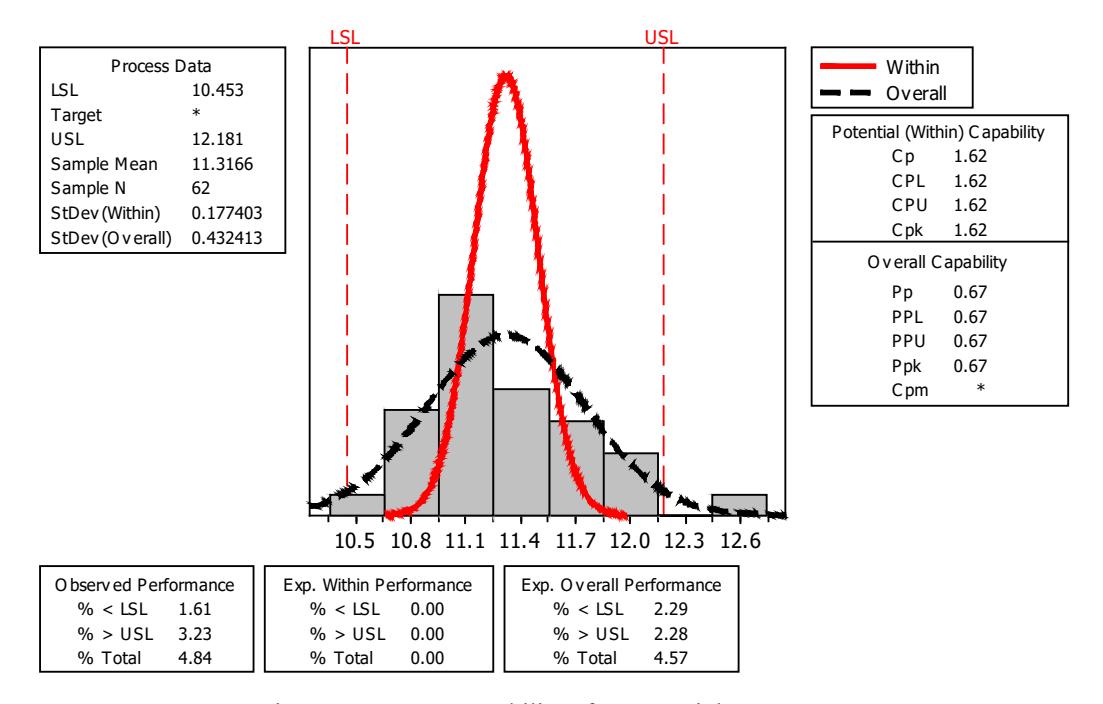
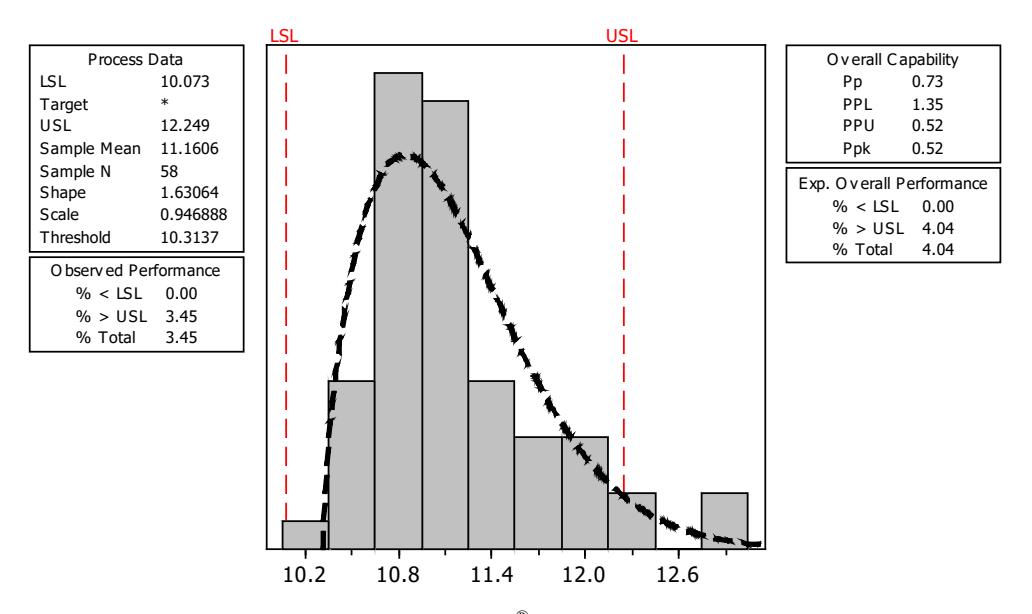
Process capability is the predicted chance for a result to fall within specified limits. A lower specification limit (LSL) and an upper specification limit (USL) can be calculated in this case from the JKTech mean ± 2 standard deviations – an industry standard for acceptable deviations. Minitab was then used to conduct a capability analysis based on the limits specified. The results presented the percentage chance for a result (individual SCSE value) to be out of specification, either below the LSL or above the USL. For normal data the capability analysis assumes a normal distribution; for non-normal data the applicable distribution which best fits the data must be specified.
Drop Weight Test Capability Analysis
Capability analysis was conducted on the Drop-weight test SCSE results and is shown in Figure 5. The lower specification and upper specification limits (LSL and USL) were determined from the overall mean ± 2 standard deviations. The "Observed Performance" and "Exp. Overall Performance" in the graph provide the actual and predicted (based on normal distribution) percentages outside the acceptable limits for all the SCSE results. The analysis predicted that only 4.57% of SCSE results would lie outside the two standard deviations range.
SMC Test® Capability analysis
The SMC Test® data was determined to be non-normal and followed the Weibull distribution, the capability analysis was performed based on the Weibull distribution model. The LSL and USL were calculated as overall mean ± 2 standard deviations as for the DWT data. Figure 6 shows the Exp. Overall Performance % total as 4.04%. This translates to only a 4.04% chance that any SMC SCSE value will be outside two standard deviations of the mean.
Calculations Based on Weibull Distribution Model
CONCLUSIONS
A new method has been developed by JKTech Pty Ltd and SMC Testing Pty Ltd to convert the A and b results obtained from Drop-weight and SMC tests into specific energy values, thereby enhancing their usefulness. This new specific energy referred to as SAG Circuit Specific Energy (SCSE) is to be incorporated into JKTech test result reports in future.
The comparative test-work programme conducted in 2013 aimed to provide a comparison of test results for all commercial Drop Weight testers world-wide with 27 laboratories participating. JKTech prepared the test samples to ensure that they were all the same material.
The results from this programme were statistically analysed using the SCSE values. The results showed that both the Drop-weight and SMC tests have a high degree of precision (repeatability) with the associated coefficients of variation being 3.82% and 4.88% respectively. These values are similar to those reported in the literature for Bond's ball mill work index and are far superior to reported values for Bond's rod and crushing mill work indices (Angove and Dunne, 1997). T-tests indicated that laboratories with 2 Drop-weight test machines did not produce results significantly different from one another.
Capability analysis predicted that 95.4% of Drop-weight Test and 96% of SMC Test® results will lie within 2 standard deviations of the mean SCSE, confirming the high level of accuracy associated with the tests.
ACKNOWLEDGEMENTS
The authors would like to thank Professor Tim Napier-Munn for assistance with the statistical methodology.
The participating laboratories in alphabetical order are provided below:
• JKTech Pty Ltd, Brisbane, AUSTRALIA
- ALS Metallurgy, Adelaide, AUSTRALIA
- ALS Metallurgy, Kamloops, CANADA
- ALS Metallurgy, Perth, AUSTRALIA
- Amdel, Adelaide, AUSTRALIA
- Aminpro, Santiago, CHILE
- ASMIN, Santiago, CHILE
- CH Plenge, Lima, PERU
- CITIC, Luoyang, CHINA
- De Beers Research, Johannesburg, SOUTH AFRICA
- FLSmidth, Salt Lake City, USA
- GEMET, Johannesburg, SOUTH AFRICA
- Hazen Research, Golden, USA
- JKMRC, Brisbane, AUSTRALIA
- Metso, Sorocaba, BRAZIL
- Mintek, Johannesburg, SOUTH AFRICA
- Newmont Denver, Colorado, USA
- Newmont Nusa Tenggara, INDONESIA
- NHI, Shenyang, CHINA
- SGS Minerals Services, Johannesburg, SOUTH AFRICA
- SGS Minerals Services, Perth, AUSTRALIA
- SGS Minerals Services, Santiago, CHILE
- SGS Minerals Services, Tucson, USA
- SGS Minerals Services, Vancouver, CANADA
- SGS Minerals Services, Vostok, RUSSIA
- Teck Metals, BC, CANADA
- Zijin, Longyan, CHINA
REFERENCES
Angove, J.E. and Dunne, R.C., 1997. A Review of Standard Physical Ore Property Determinations, World Gold Conference, Singapore, 1-3 September.
Bailey, C.W., Lane, G., Morrell, S. & Staples, P. (2009). What can go wrong in Comminution Circuit Design. Proceedings of the 10th Mill Operators' Conference (pp 143 – 149). Adelaide: Australia: AusIMM.
- Bond, F.C. (1961). Crushing and Grinding Calculations Parts I and II , British Chemical Engineering, Vol. 6, Nos 6 and 8.
- Morrell, S. and Morrison, R.D. (1996). AG and SAG Mill Circuit Selection and Design by Simulation, Proceedings of Autogenous and Semi-Autogenous Grinding, (pp 769 – 790) Vancouver, BC: University of British Columbia.
- Morrell, S., 2009, Predicting the overall specific energy requirement of crushing, high pressure grinding roll and tumbling mill circuits, Minerals Engineering, Volume 22, Issue 6, May, Pages 544-549
- Morrell, S., 2004 a . Predicting the Specific Energy of Autogenous and Semi-autogenous Mills from Small Diameter Drill Core Samples. Minerals Engineering, Volume 17, Issue 3, March, Pages 447-451
- Napier-Munn T.J., Morrell S., Morrison R.D. and Kojovic T. 1996, Mineral Comminution Circuits Their Operation and Optimisation. JKMRC, University of Queensland.
- Napier-Munn, T.J. (2012). An Introduction to Comparative Statistics and Experimental Design for Minerals Engineers , Course Notes 2nd Edition Version 6.6, Brisbane, Australia: The University of Queensland.
- Rowland, C.A. and Kjos, D.M. (1980). Chapter 12. Eds Mular A.L. and Bhappu, R.B., Rod and Ball Mills . Mineral Processing Plant Design, AIME.
- Stark, S., Perkins, T. & Napier-Munn, T.J. (2008). JK Drop Weight Parameters A Statistical Analysis of their Accuracy and Precision and the Effect on SAG Mill Comminution Circuit Simulation, Proceedings of Metplant 2008 . Perth, Australia
- Veillette, G., Parker, B. (2005). Boddington Expansion Project Comminution Circuit Features and Testwork , Randol Gold Forum Proceedings.