



The content on this page was automatically generated from the PDF publication document and may contain errors or inaccuracies. Please refer to the original PDF for the most accurate information.
AG/SAG Mill Circuit Grinding Energy Requirement - How to Predict it from Small Diameter Drill Core Samples Using the SMC Test
Stephen Morrell
SMCC Pty Ltd., Queensland, Australia
ABSTRACT
The SMC Test has been developed to provide a rock breakage description that can be used to predict autogenous (AG) and semi-autogenous (SAG) mill performance. The test has been specifically designed to be useable in situations where only limited quantities of rock samples are available eg small diameter core. The test generates an index (DWi) that can be used to estimate the throughput of AG and SAG circuits through a combination of power-based and model-based approaches. The model-based approach makes use of the direct relationship between the DWi and the JKTech drop-weight test rock breakage parameters A and b. The power-based route uses correlations that have been developed between the DWi and the specific energies of a very wide range of operating AG and SAG circuits. Its usefulness is also shown to extend to rock mass characterisation in mining applications, as it is also correlated with the point load index/UCS. It is therefore ideally suited for mine-to-mill studies where it can be simultaneously used to predict comminution circuit performance and to augment input to blast fragmentation models. This makes it a valuable tool for orebody profiling in greenfield, brownfield and established operations. Recent investigations have shown that the DWi is also strongly related to HPGR performance.
The ability of the test and associated equations to predict AG/SAG circuit specific energy is demonstrated using a wide range of industrial data. This approach is compared to more traditional ones such as that of Bond, which is also reviewed in the context of its ability to predict AG/SAG circuit specific energy and energy utilisation efficiency.
INTRODUCTION
As little as 10 years ago a "conventional" comminution circuit in many metallurgists minds would have conjured up pictures of crushing-ball mill or rod mill-ball mill circuits. Today it is not common to find such circuits in operation, let alone being built. Autogenous (AG) and semi-autogenous (SAG) mills now dominate circuit design in gold and base metals applications and can rightfully lay claim to being conventional, leaving technologies such as high pressure grinding rolls the title of "new". Regardless of how one categorises these technologies, today a much wider spectrum of proven equipment is available to the circuit designer than, say, 25-30 years ago. Although such choice may be seen as an improvement it provides a particular challenge in terms of assessing which circuit is the most energy efficient and how in the first place the ore type should be meaningfully described in terms of its breakage characteristics. For ball milling Bond's ball work indices and equations have become the standard for describing grindability and efficiency. However, to date there is no universal equivalent for AG/SAG milling. The JKMRC drop-weight test parameters, A and b, have become popular when characterising rock for AG/SAG milling but they are specifically for use in AG/SAG modelling and cannot be used for power-based calculations. In addition the JK parameters are obtained from breaking relatively large quantities of material and hence cannot be obtained from small samples such as those provided by drill core. The recently developed Drop-weight Index (DWi) may provide the solution. In this paper the DWi will be reviewed in terms of how it relates to AG/SAG mill specific energy as well as to traditional strength measurements and the JK A,b parameters. The test used to determine the DWi (SMC Test) is also described. In the course of this review traditional ways of determining AG/SAG specific energy will be analysed.
TRADITIONAL APPROACH TO CIRCUIT SELECTION
For AG/SAG mill circuit selection piloting is still regarded as being the best option for estimating what the performance of the full-scale circuit will be. Tests are normally conducted under a range of conditions, the choice of circuit then being made on the basis of a number of criteria, which normally include factors such as minimum specific energy and/or maximum power utilisation efficiency. The specific energy is easy to determine as it is unambiguously defined as the power draw divided by the throughput, with different operating conditions eg ball load and speed, and circuit configurations eg open circuit, closed circuit, with/without pebble crusher etc resulting in different specific energies. However, product grind size from each also varies, leaving the designer with the problem of determining which is the most energy efficient. Historically this has often been done by applying Bond's equation to determine the operating work index, which is considered by some to be indicative of the efficiency of the circuit. This has been recently challenged on the basis that the Bond equation is fundamentally flawed and hence any conclusions regarding energy efficiency based on its use are likely to be erroneous (Morrell, 2004). A further problem is that, whereas the piloting may provide sufficient information to select the best circuit, it may only apply to the ore that was tested during the programme. Many deposits have highly variable comminution characteristics leaving unanswered the very important question "Will the chosen circuit work as well on other ore types?". When pilot testing is not carried out at all this problem is exacerbated as the circuit design has to rely entirely on laboratory-scale ore characterisation data.
ANALYSIS OF AG/SAG CIRCUIT ENERGY EFFICIENCY USING BOND'S EQUATION
As mentioned in the previous section a common choice is to use the Bond equation to calculate the Bond operating work indices to compare the efficiencies of different circuits. This equation is written as:
where
W = Specific energy
OWi = Operating work index
P = 80% passing size for the product
F = 80% passing size for the feed
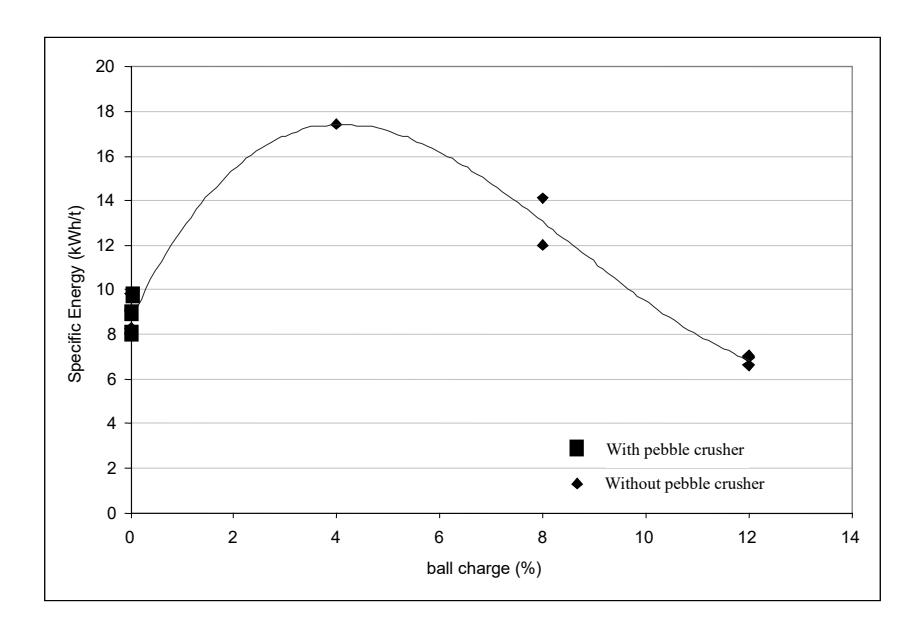
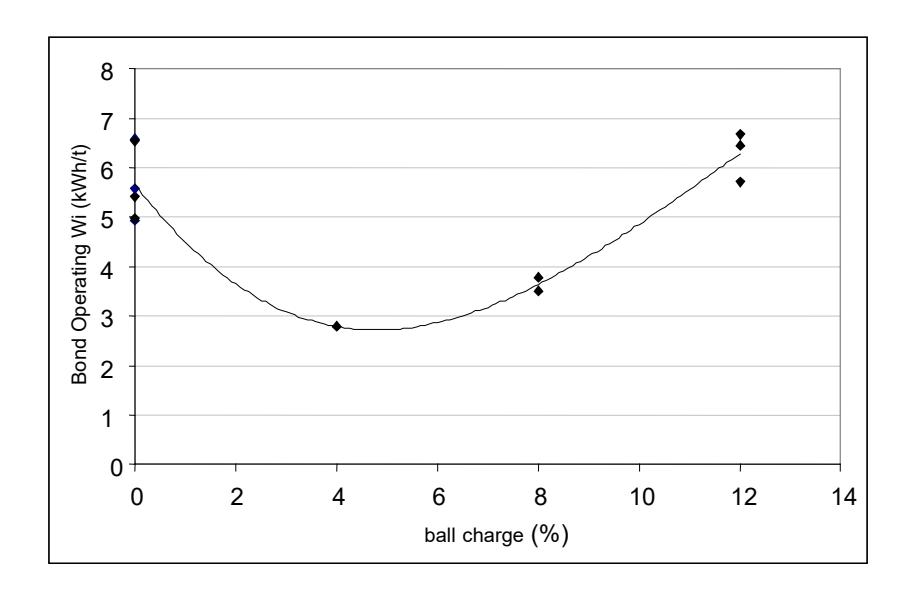
By way of example to illustrate its use data from a pilot programme are given in Figure 1 and show a systematic trend in the specific energy as ball charge is varied. It is pointed out that the AG mill runs were conducted with a pebble crusher in circuit whilst the SAG mill runs were not. The data indicate that the worst condition (highest specific energy) is when about 4% of steel balls are used. When the Bond operating work indices are calculated a very different picture is obtained as shown in Figure 2. From these data the 4% case is indicated to give the best power utilisation efficiency (lowest OWi).
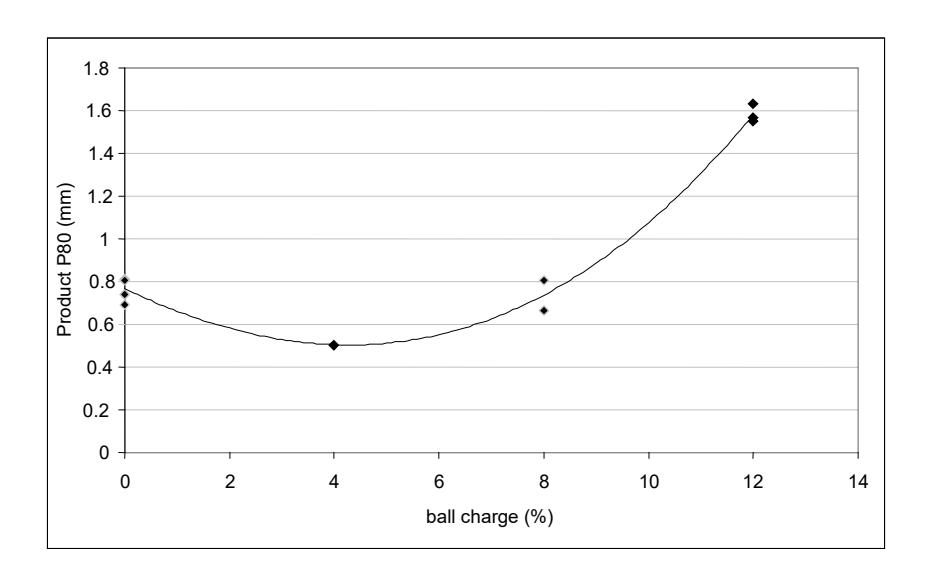
Closer analysis of the data shows that there is also a similar relationship between the ball charge and the P80 (Figure 3), indicating that the underlying relationship is in fact one that links operating work index to P80.
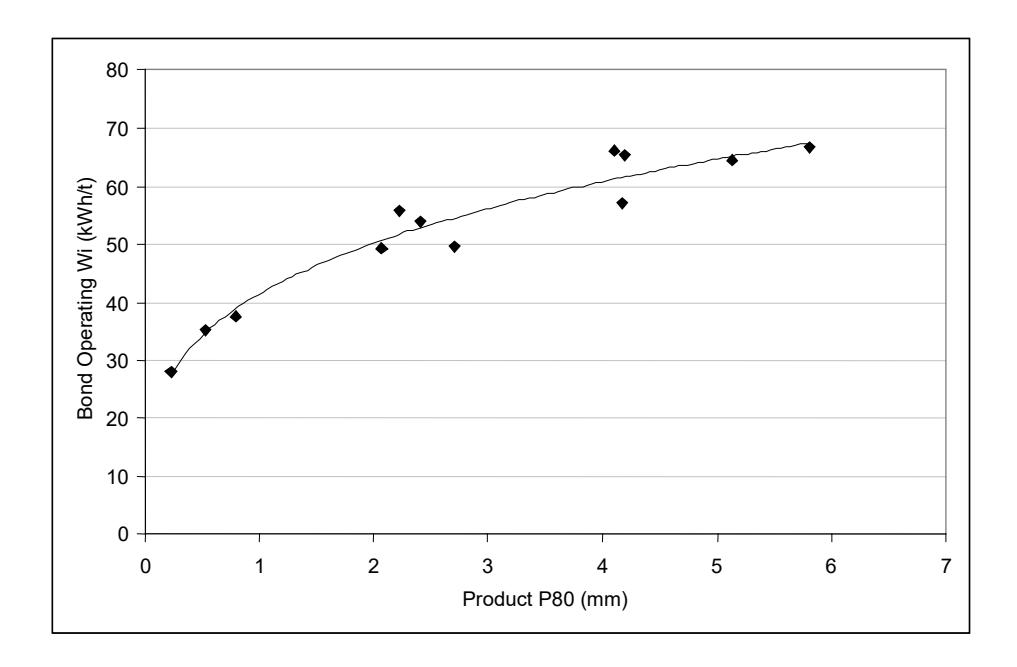
This is confirmed in Figure 4 where a strong correlation between the Bond operating work index and the product P80 is seen. This trend, which is found in many data sets, shows a decreasing operating work index as the grind becomes finer and is counter intuitive. The expected result would be one in which either the operating work index remained constant (indicating constant energy efficiency and constant material properties) or it increased as product size decreased (ie the rock became harder as the product size became smaller and/or the mill became less efficient at producing a finer grind). This result points to a potential error in the Bond equation and puts into question the conclusion regarding maximum power efficiency with 4% balls.
Researchers such as Hukki (1962) have challenged the validity of Bond's equation, at least outside the range of feed and product sizes treated in ball mills. Recently an alternative equation to Bond's has been proposed (Morrell, 2004). This has the form:
where
W = Specific energy (kWh/tonne)
K = Constant chosen to balance the units of the equation
\( M_i \) = Index related to the breakage property of an ore (kWh/t)
\( x_2 = 80\% \) passing size for the product
x1 = 80% passing size for the feed
where
a,b = constants
x = 80% passing size
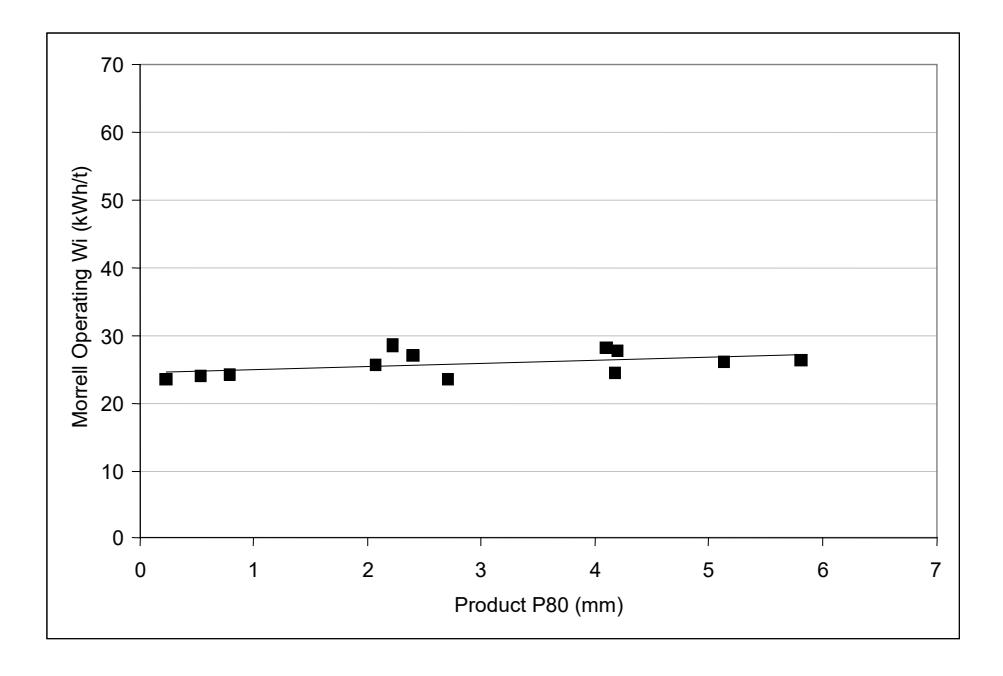
The parameters a and b in equation 3 have been estimated from analysing a wide range of size reduction data from industrial grinding mills. Equation 2 can therefore be used providing Mi is known. Alternatively for analysing circuit performance the equation can be rearranged such that an operating value for Mi can be calculated using plant data. This is the equivalent of the Bond operating work index. When this is done using the data from Figure 4 the results given in Figure 5 are obtained and show that the operating work index is in fact largely constant with respect to product size and hence there is no indicated difference in power utilisation efficiency between the different operating conditions.
EFFICIENCY OF AG/SAG AND BALL MILL CIRCUITS
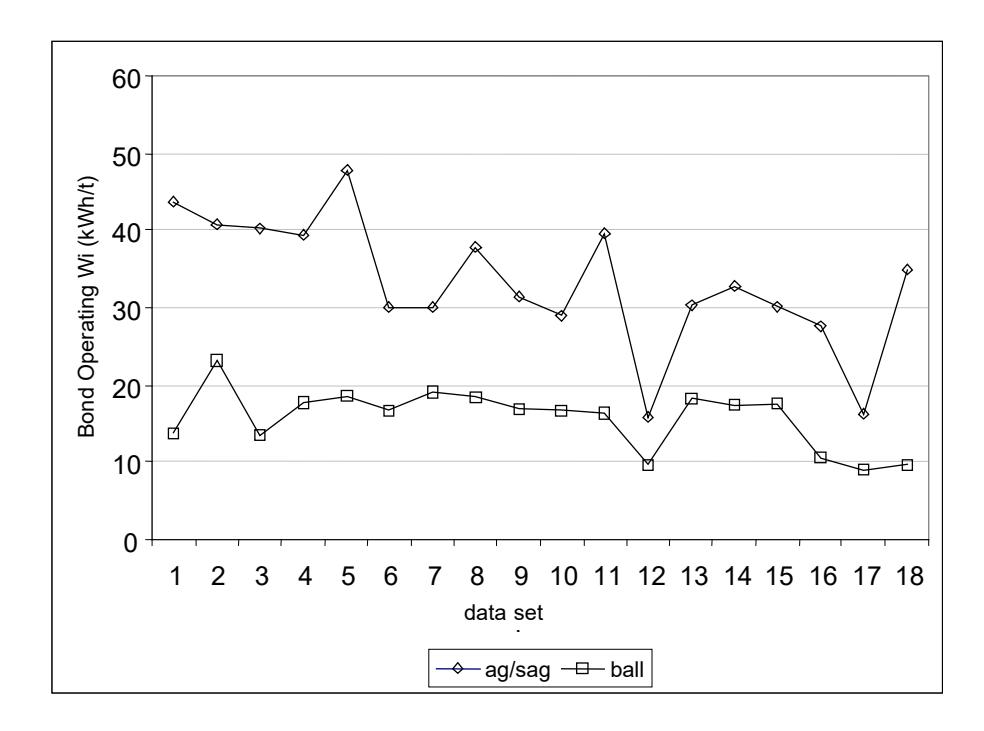
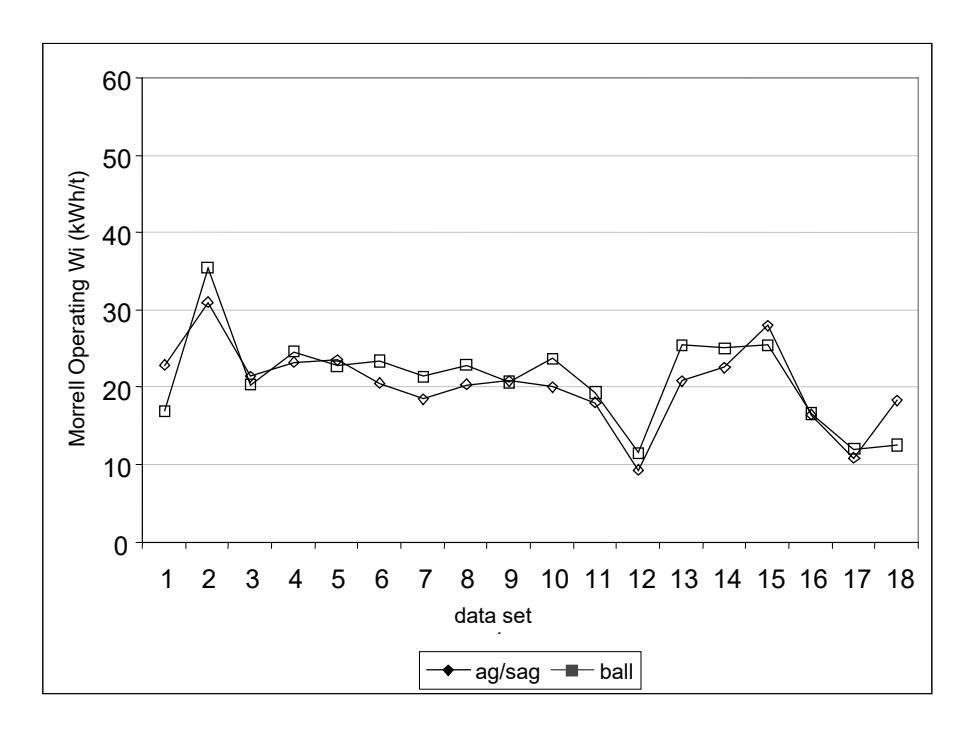
Given that the use of equation 2 indicates that there is little or no difference between the power utilisation efficiencies of the different modes of AG/SAG mill operation, the question arises as to whether the equation indicates differences in efficiency between AG/SAG and ball milling in general. Data from 18 different operations were analysed to answer this question. The data comprised throughput and power draws as well as feed, transfer and ball mill cyclone overflow sizings from each circuit. Initially Bond operating work indices were calculated for each circuit. These are plotted for each circuit and shown in Figure 6. The ball mill values largely followed the Bond laboratory work index results, which were also obtained for each ore type. The AG/SAG operating work indices show their usual elevated levels compared to those from the ball mill circuit. This has often resulted in conclusions concerning lower energy efficiencies of AG/SAG mill circuits compared to ball mills. The correlation between the AG/SAG and ball mill circuit data is also very poor. Use of equation 2 shows a very different picture, the results being illustrated in Figure 7. This shows that on average the "M" operating work indices of AG/SAG and ball mill circuits are very similar and hence energy utilisation efficiencies are similar. Also the AG/SAG and ball mill circuit operating work indices are highly correlated.
The conclusion that AG/SAG circuit have, on average, a similar power utilisation efficiency to ball mill circuits, may run counter to much "conventional wisdom". However, controlled experiments in which very different crushing and grinding circuits have been run using identical ores have shown little difference in the energy required to reach a target grind from a given feed size (Larsen et al, 2001, Morrell et al, 1991). The analyses provided in this paper support these results and lead to the assertion that in many cases, regardless of the processing route, the energy required to grind an ore from a specific feed size to a specific product size will be similar, at least to within +/- 5%. It can be concluded from this argument that, at least from an energy utilisation efficiency viewpoint, all circuits work equally well regardless of ore type when they are fully optimised. Of course, that is not to say that from a capital cost, operating cost and operability standpoint all circuits are the same – far from it. Ultimately circuit choice should be made on financial grounds. However, differences in overall power efficiency should not necessarily play a prominent role in decision making as, when analysed correctly, data show that little differences exist between circuit power efficiencies. These arguments relate to conventional crushing and tumbling mill circuits. The use of High Pressure Grinding Rolls, however, appears to provide a genuine reduction in power requirements (Parker et al, 2001).
NEW APPROACH TO PREDICTING AG/SAG SPECIFIC ENERGY
The previous sections have indicated that AG/SAG mill circuit power utilisation efficiencies are largely similar, regardless of the circuit configuration and operating conditions such as ball charge, speed etc. If this is the case then it should be possible to predict the AG/SAG specific energy of all types of circuit without making any assumptions and/or corrections concerning energy utilisation efficiency.
The choice of an appropriate measure of the ore breakage characteristics and an associated technique for predicting the specific energy is obviously very important for this approach to work. A potential appropriate measure of an ore's breakage characteristics is the so-called DWi, which is a parameter derived from the SMC Test (Morrell, 2004). The difficulty in determining whether such a relationship exists is that the specific energy of AG/SAG mills does not just depend on ore competence but also factors such as feed size, ball load, aspect ratio, whether the mill has a pebble crusher or not and whether the mill is in closed circuit or not. An equation was therefore developed for use with the DWi for predicting specific energy and has the following form:
$$ S = K.F_{80}^{a}.DW_{i}^{b}.(1+c(1-e^{-dJ}))^{-1}.\phi^{e}.f(A_{r}) $$ (4)
Where, S = specific energy (kWh/t)
F80 = 80% passing size of the feed
DWi = strength index
J = volume of balls (%)
φ = mill speed (% of critical)
f(Ar) = function of mill aspect ratio (length/diameter)
a,b,c,d,e = constants
K = function whose value is dependent upon whether a pebble crusher is in-
circuit
A companion equation was also developed for predicting transfer size as follows and works on the bsis that the more enegy that is input to the mill in relation the hardness of the ore the finer will be the transfer size.
$$ T_{80} = f - \frac{g.S}{DW_i^b} $$ Where S = specific energy (kWh/t)
Where S = specific energy (kWh/t)
b,f,g = constants
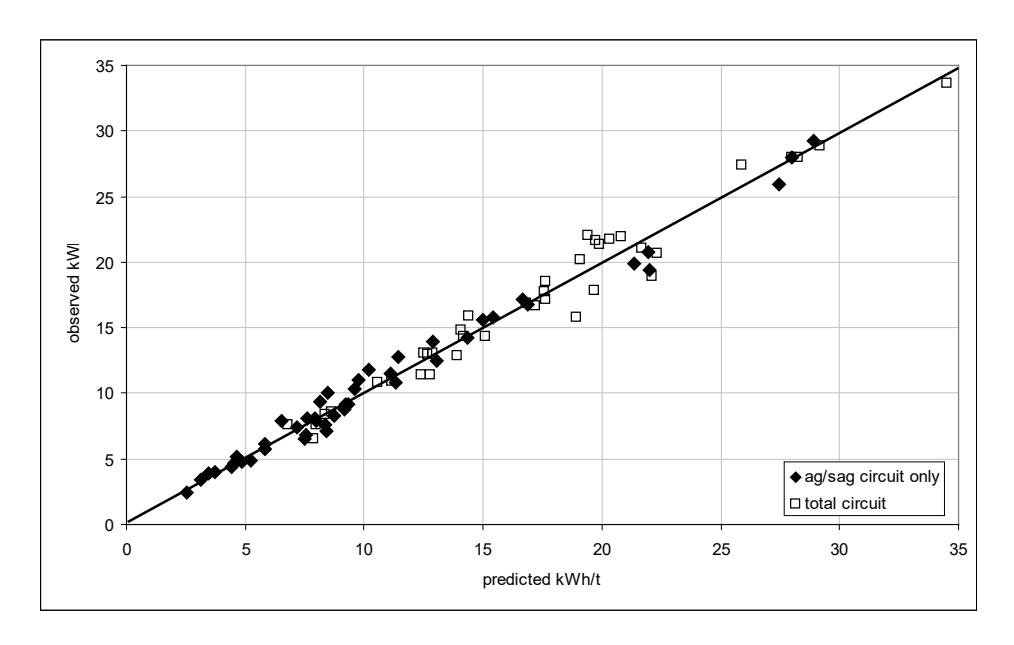
Combination of the two equations gives the AG/SAG specific energy as well as the transfer size, such that the "M" operating work index from equation 2 remains fairly static regardless of AG/SAG operating conditions. To develop the approach 46 data sets from 30 different operations were used. AG/SAG specific energy and ball mill specific energy were predicted using DWi and Bond ball laboratory work indices. Ore types represented in the data base were from Al, Au, Pt, Cu, Ni and Pb/Zn operations. The range of conditions covered is given in Table 1. The results are shown in Figure 8, indicating a reasonable correlation between observed and predicted specific energies, the standard deviation of the relative error (precision) being 8.5%.
| variable | max | min |
|---|---|---|
|
JK -
A |
81.3 | 48 |
|
JK -
b |
2.56 | 0.25 |
| sg | 4.63 | 2.5 |
| DWi | 14.2 | 1.8 |
| Bond ball Wi (kWh/t) | 26 | 9.4 |
| F80 (microns) | 176000 | 19400 |
| P80 (microns) | 600 | 54 |
| Diameter (m) | 12 | 3.94 |
| Length (m) | 8.3 | 1.65 |
| ball load (%) | 25 | 0 |
| Speed (%) | 86 | 68 |
| Aspect ratio (L/D) | 1.5 | 0.3 |
| SAG kWh/t | 29.2 | 2.4 |
SMC TEST DESCRIPTION
The SMC Test, from which the DWi is derived, was originally developed to make use of relatively small samples, both in terms of quantity and particle size and to be versatile so as to make as much use as possible of whatever sample(s) is/are available for testing. As a result it is able to accommodate a wide range of particle sizes either in core or crushed form. The test is applied to particles of a particular size, this size being chosen depending on the type and quantity of sample available. The particle sizes that can be used in the SMC Test are -45+37.5, -31.5+26.5, -22.4+19 and –16+13.2mm. Sample sources can be from core sizes as large as PQ (85mm) and as small as AQ (27mm). Mostly either the 31.5+26.5mm or – 22.4+19mm sizes are chosen as these are easily extractable from HQ and NQ cores respectively, and these tend to be the most popular choice of core sizes. When sample availability is very limited, quartered (slivered) core samples are cut using a diamond saw (Figures 9). This results in sample mass requirements as low as 2-2.5 kgs in total. However, where core is available in sufficient quantity (10-15 kgs) it can be crushed in stead and the appropriate size fraction extracted.
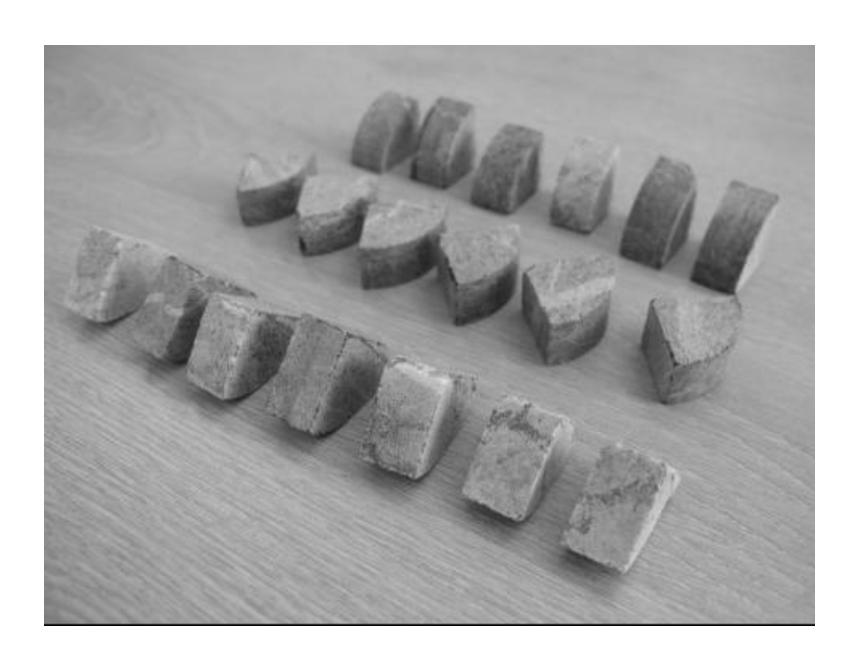
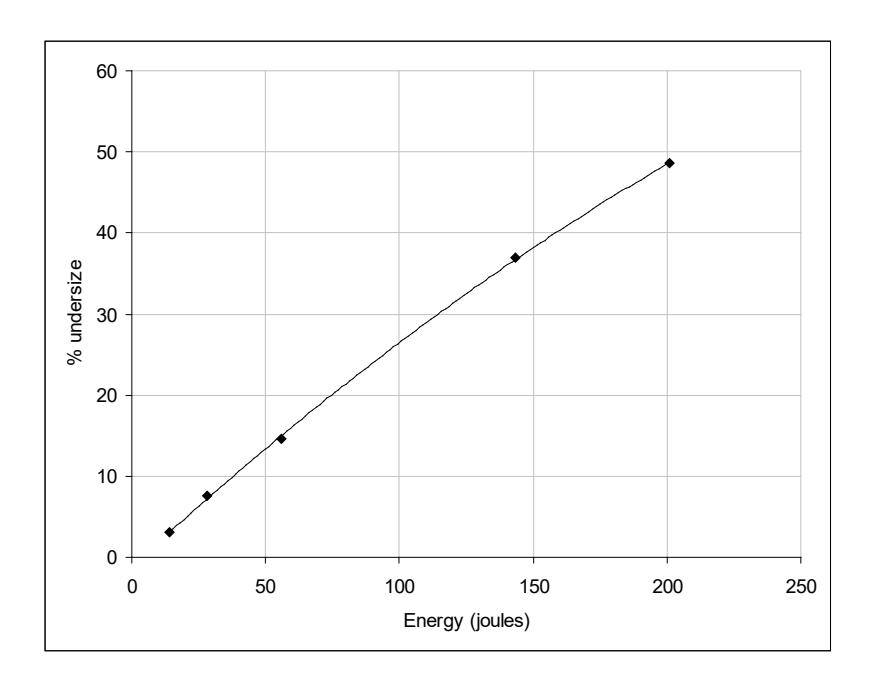
Once the core has been cut or crushed/sized into the chosen particle size range, 100 specimens are chosen and divided into five equal lots. Each lot is then broken in an impact device using a range of closely controlled energies. A suitable impact device is the JKMRC's drop-weight tester (Napier-Munn et al, 1996). After breakage the products are collected and sized on a sieve whose aperture is related to the original particle size. The % of undersize from sieving the broken products is plotted against the input energy. A typical plot from a test is given in Figure 10 and shows the expected trend of an increasing amount of undersize as the input energy is increased. The slope of this plot is related to the strength of the rock, a slope with a larger gradient being indicative of a weaker rock. The gradient of the slope is used to generate a so-called drop-weight index (DWi). The DWi has the units of kWh/m3 , which in turn has the same dimensions as strength and hence it is not surprising that the DWi is correlated with direct strength measurements such as the point load index (see later).
The high degree of control imposed on both the size of particles and the energies used to break them means that the SMC Test is very precise and is largely free of the repeatability problems which plague tumbling mill rock characterisation tests (Angove and Dunne (1997), Kaya (2001)). Such tests usually suffer from variations in feed size, which is often not closely controlled, as well as energy input per mill revolution, which is often assumed to be constant but in practice can be highly variable (Levin, 1989).
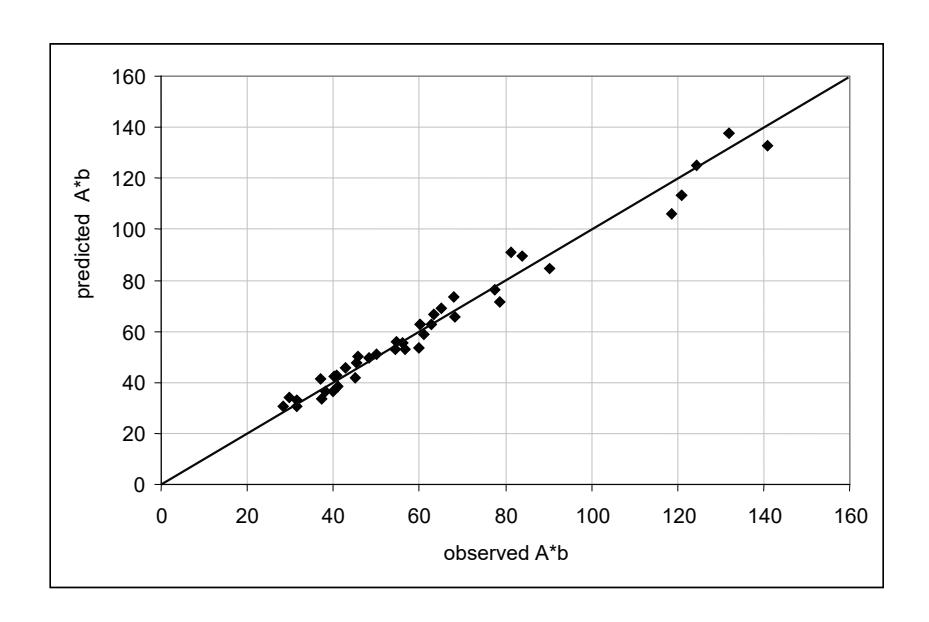
The standard JK drop-weight test normally needs about 75 kgs of raw material and hence its use is normally precluded for small drill core samples. However, the DWi is highly correlated with the A and b parameters and therefore can be used to estimate their values with a high degree of accuracy. Figure 11 illustrates this using data from 40 different ore types. The scatter apparent in the figure has an associated standard deviation of 6.5%. This is related to the differences in the variation of strength with particle size that different rocks exhibit. This scatter can be reduced by carrying out full drop-weight tests on selected samples from the orebody in question to better define the size-by-size relationship and hence refine the DWi – A,b correlation. Such drop-weight tests are usually referred to as SMC Test "calibrations", though they can be dispensed with if the 6.5% precision of the data base correlation is deemed to be acceptable.
USE OF DWi IN MODELLING
AG and SAG Mill Circuits
The use of modelling and simulation has become routine in the design and optimisation of AG and SAG mill circuits. One of the most widely used models for this purpose is the so-called "variable rates" model (Morrell and Morrison, 1996). A more up-to-date version has also been developed with enhanced predictive capabilities (Morrell, 2004). This uses a two-parameter description of rock breakage that is developed from data obtained from a drop-weight test (Napier-Munn et al, 1996). The two parameters (A and b) are ore specific and are generated as part of the SMC Test via their correlation with the DWi. They relate the t10 (a size distribution index) to the applied specific energy (Ecs). The equation used for describing the relationship between the t10 and Ecs is given below.
$$ t_{10} = A (1 - e^{-b.Ecs}) $$ (6)
The specific comminution energy (Ecs) has the units kWh/t and is the energy applied during impact breakage. As the impact energy is varied, so does the t10. Higher impact energies produce higher values of t10, which is reflected in products with finer size distributions. The A and b parameters, in conjunction with equation 6, are used in AG/SAG mill modelling for predicting how rock breaks inside the mill. From this description the model can predict what the throughput, power draw and product size distribution will be. Apart from being able to predict throughput and power draw of AG/SAG mills, modelling and simulation also enables a detailed flowsheet to be built up of the comminution circuit response to changes in ore type. It also enables optimisation strategies to be developed to overcome any deleterious changes in circuit performance that are predicted. This is particularly useful during the design stage as the chosen circuit can be tested under a range of conditions to see whether the circuit will meet its production targets. Strategies can then be developed to overcome any potential problems. These can include both changes to how mills are operated eg ball load, speed etc but also changes to feed size distribution through modification to blasting practices and primary crusher operation – so-called Mine-to-Mill approach.
Mine-to-Mill Applications
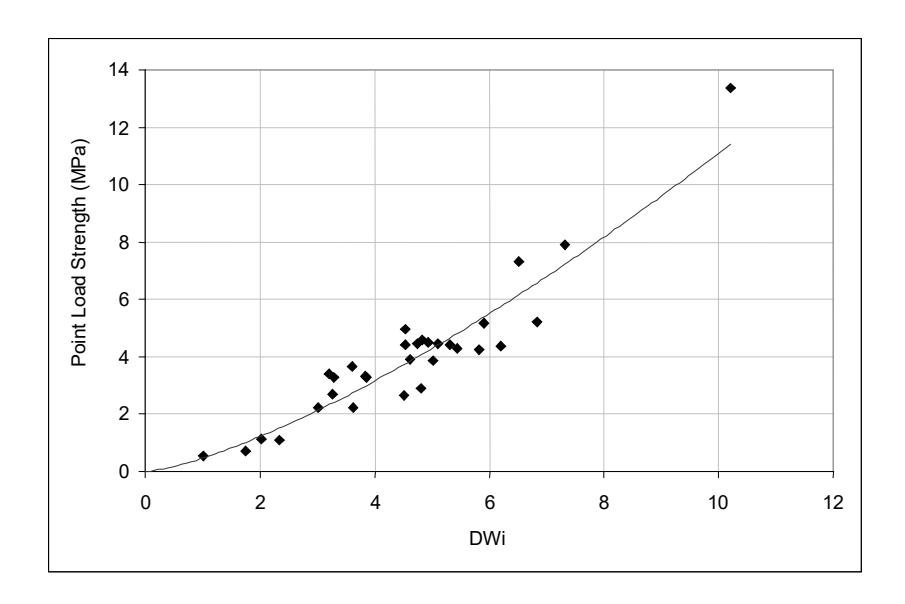
The feed size to AG and SAG mill circuits has been demonstrated to have a significant impact on throughput. Modifying blast design and primary crusher operation can significantly influence AG/SAG mill feed size, hence giving a potentially cost effective way to increase comminution circuit throughput. Trial and error experimentation in this field, however, can be very costly and thus it is usual to rely on blast fragmentation modelling and grinding circuit simulations to determine what the optimum blast design should be. This will vary with ore type and hence it is important not only to have appropriate blast models but also rock breakage descriptions. Blasting models require information on rock mass competence such as provided by the point load strength (Scott et al, 2002). The DWi is correlated with the point load strength (Figure 12) and hence can also be used in blast fragmentation modelling where direct measurements of point load strength are not available or very limited. Conversely, where a significant data base of point-load tests are available these can be used to augment the comminution description of the orebody by using the correlation from Figure 12 in reverse.
High Pressure Grinding Rolls (HPGR)
Although HPGR technology has become commonplace in the cement and diamond mining industries and of late has been making significant inroads in the processing of iron ore, it has yet to make a major impact in the gold, platinum and base metals sectors. However, interest in the technology is now such that general expectations are that rapidly increasing numbers of HPGR machines are likely to find their way into these sectors. Due to the operation of HPGRs, the more established techniques for breakage characterisation, design and scale-up that have been developed on the basis of tumbling mills, are not applicable. Simulation has helped in this regard, JKSimMet containing a model that has been shown to have good scale-up capabilities (Morrell et al,1997, Daniel and Morrell, 2004). This model needs HPGR data to calibrate it and although it has been shown that laboratory-scale HPGR results are suitable, separate tests need to be conducted on every different ore type, as the size reduction and throughput parameters of the model are machine and ore dependent. Ore characterisation therefore remains a problem, though it is being currently researched in the AMIRA P9 project.
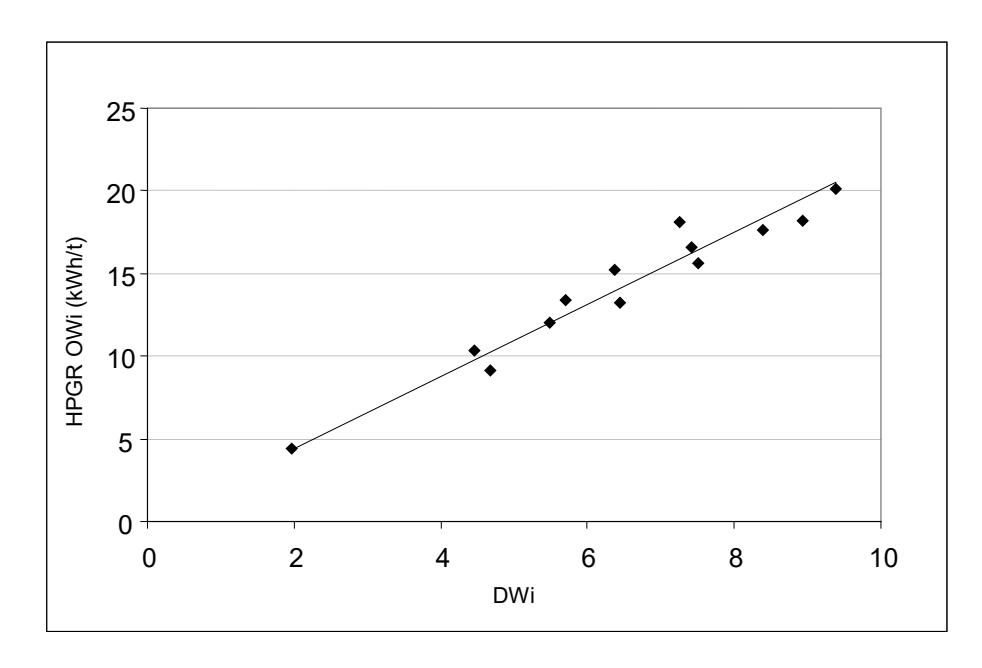
The DWi may provide at least part of the answer as it has been found that it is correlated with the operating work index of HPGR's as Figure 13 indicates. The data in this figure have been obtained from 13 different ore types. It is valid for machines operating with a working pressure in the range 2.5-3 N/mm2 .
The correlation in Figure 13 is not intended for design purposes but can be used in conjunction with pilot and/or laboratory-scale HPGR test results to predict the specific energy requirement of rock samples that cannot be tested in an HPGR. Its value for orebody profiling is obvious. Also the fact that the DWi is both applicable to AG/SAG and HPGR circuits makes the SMC Test particularly attractive in greenfield design projects as its use for characterising drill core does not compromise the ability of the designer when subsequently evaluating the response of AG/SAG and PGR circuits to changes in ore type.
CONCLUSIONS
The SMC rock breakage characterisation test has been developed to make use of very small quantities of sample, such as quartered drill core. The test generates a strength index (DWi) which, via modelling and/or power-based techniques, can be used to predict the specific energy of AG and SAG mills as well as HPGR circuits. Its applicability for modelling stems from its correlation with the JK rock breakage parameters (A and b). For power-based calculations an equation has been developed which relates it and operating variables such as feed size, ball load and speed to AG/SAG mill specific energy with a precision of 8.5% (1 sd).
The usefulness of the DWi also extends to rock mass characterisation in mining applications, as it is correlated with the point load index/UCS. It is therefore ideally suited for Mine-to-Mill studies as it can be simultaneously used as an input to both comminution circuit and blast fragmentation models, where independent point load/UCS measurements are not available.
REFERENCES
Angove, J.E. and Dunne, R.C., 1997. A Review of Standard Physical Ore Property Determinations, World Gold Conference, Singapore, 1-3 September.
Daniel, M. J. and S. Morrell. 2004. HPGR model verification and scale-up. Minerals Engineering 17(11- 12): 1149-1161.
Hart, S., Valery, W., Clements., Reed, M., Song, M., and Dunne, R., 2001. Optimisation of the Cadia Hill SAG Mill Circuit. Proc. Int. Conf. Autogenous and Semi-autogenous Grinding Technology, vol 1, pp.11- 30.
Hukki, R.T., 1962. Proposal for a solomnic settlement between the theories of von Rittinger, Kick and Bond, Trans AIME , vol 223, pp403-408.
Kaya, E. 2001. Evaluation of Bond Grindability Testing. Proc. Int. Conf. Autogenous and Semiautogenous Grinding Technology, vol 1, pp.339-347.
Larsen, C., Cooper, M. and Trusiak, A.,2001.Design and Operation of Brunswick's AG/SAG Circuit, Proc International Autogenous and Semi Autogenous Grinding Technology,Vancouver, vol IV pp 350- 367.
Levin, J., 1989. Observation on the Bond Standard Grindability Test, and a Proposal for a Standard Grindability Test for Fine Materials. SAIMM, vol 89, n0.1, pp13-21.
Morrell, S., Johnson, G. and Revy, T., 1991. A comparison through observation and simulation of the power utilisation and performance of two dissimilar comminution plants. Fourth Mill Operators' Conference, Aus.IMM Burnie, pp157-160. March
Morrell, S. 1996. Power draw of wet tumbling mills and its relationship to charge dynamics - Part 1: a continuum approach to mathematical modelling of mill power draw. Trans Inst Min Metall, Section C Vol 105, C43-53.
Morrell, S., 2004. An Alternative Energy-Size Relationship To That Proposed By Bond For The Design and Optimisation Of Grinding Circuits . International Journal of Mineral Processing , 74, 133-141.
Morrell, S., 2004. Predicting the Specific Energy of Autogenous and Semi-autogenous Mills from Small Diameter Drill Core Samples. Minerals Engineering , Vol 17/3 pp 447-451.
Morrell, S., Shi, F., Tondo, L.A., 1997, Modelling and Scale-up of High Pressure Grinding Rolls, In the proceedings of the XX International Mineral Processing Congress(IMPC), Aachen, Germany, September 1997.
Morrell, S. and Morrison, R.D. 1996. AG and SAG mill circuit selection and design by simulation, Proc SAG '96, Vancouver, Vol 2 pp769-790.
Napier-Munn, T.J., Morrell, S., Morrison, R.D. and Kojovic, T., 1996, Mineral Comminution Circuits Their Operation and Optimisation. JKMRC Monograph Series.
Parker, B., Rowe, P., Lane, G. and Morrell, S. 2001. The Decision to Opt for High Pressure Grinding Rolls for the Boddington Expansion, Proc International Autogenous and Semi Autogenous Grinding Technology, Vancouver, vol III pp 93-106.
Scott, A., Morrell, S. and Clark, D., 2002. Tracking and Quantifying Value from "Mine to Mill"