



The content on this page was automatically generated from the PDF publication document and may contain errors or inaccuracies. Please refer to the original PDF for the most accurate information.
An Alternative Energy-Size Relationship To That Proposed By Bond For The Design and Optimisation Of Grinding Circuits
STEPHEN MORRELL
SMCC Pty Ltd
Fax: +61 7 3376 2637
E-mail:
ABSTRACT
Despite reservations of a number of researchers concerning the applicability of Bond's equation for relating specific energy to the size reduction of rocks, his approach has become an industry standard.
Data from a large number of pilot and full-scale autogenous, semi-autogenous and ball mill circuits are used to show that Bond's equation does not hold over the particle size range –100mm+0.1mm. However, if suitable correction factors are applied its results can be made to approximate observed values. It is shown that a more appropriate relationship relies on a particle size exponent that is a function of size.
This new relationship, which does not rely on the need for correction factors, is used to predict the specific energy requirements of a number of autogenous, semi autogenous and ball mill grinding circuits. The results are compared to those obtained using Bond's equation and are shown to provide a more precise prediction of specific power requirements.
INTRODUCTION
It has been 50 years since Bond (1952) published his theory of comminution and well over 100 years since von Rittinger (1867) and Kick (1885) published theirs. As pointed out by Hukki (1961) all of the equations that these researchers developed are special forms of the same differential equation as proposed by Walker et. al. (1937).
This equation can be written as:
where
E = net energy required per unit weight (specific energy)
x = index describing the size distribution, eg p80
n = exponent indicating the order of the process
C = constant related to material properties and the units chosen to balance the equation
If the exponent in equation 1 is set to values 2, 1.5 and 1 then integrated, the equations proposed by von Rittinger, Bond and Kick respectively are obtained:
where
\( E_{1-2} \) = Net specific energy to reduce size distribution 1 to distribution 2
\( x_1, x_2 = \) Size distribution indices where \( x_1 > x_2 \)
Hukki's evaluation of these equations led him to conclude that each might well be applicable but only in a relatively narrow size distribution range. He further postulated that the equation of Walker et al had the wrong form and that the exponent, n, was not constant but varied with the magnitude of the size distribution index, x. He therefore suggested that a more appropriate general differential equation was:
Hukki did not specify what the function f(x) was, though he described experiments that might provide data to determine what it should be. Despite the conclusions of Hukki concerning the limitations of Bond's equation, since its publication it has become the industry standard for estimating the comminution energy required to reduce rock from one size to another and has been applied to all comminution steps ranging from blasting to fine grinding. Various factors have been added, depending on the application, with the intention of improving its accuracy. However, the basic equation, in which energy is related to the inverse square root of particle size has remained unchanged. The question therefore still remains as to whether this is valid over the full range of particle sizes reduced in comminution circuits and whether an alternative approach is more suitable. This is particularly relevant to autogenous (AG), semi-autogenous (SAG) and ball mills, which currently are by far the most popular choice for grinding circuits in the gold and base metal sectors.
VALIDITY OF BOND'S EQUATION
Bond's so-called "Third Theory" equation is normally written as:
where
W = Specific energy
Wi = Work index
P = 80% passing size for the product
F = 80% passing size for the feed
The work index \( (W_i) \) was defined by Bond as the "....comminution parameter which expresses the resistance of the material to crushing and grinding". In practice \( W_i \) has to be determined from plant data or by conducting grinding tests in which W, P and F
are measured. If plant data are available equation 6 is rearranged, the work index being referred to as the operating work index (OWi):
Where plant data are not available the work index has to be determined from laboratory milling tests. Bond developed rod and ball mill laboratory tests for this purpose. The work indices that they produce are in effect operating work indices and are calculated using feed and product sizes using standard test conditions. It was assumed by Bond that the net energy consumption per revolution of the test mills he used remained constant. Levin (1989) estimates that on average this value is 198.4 kWh/rev x 10-7, but states it is far from constant. This value was implicitly incorporated by Bond (1962) in his equation for determining the laboratory ball mill work index, by calibrating his laboratory procedure with full scale mill data. The equation he developed to estimate the ball mill work index using his laboratory test mill is:
$$ W_{i} = \frac{49}{P_{1}^{0.23} (Gbp)^{0.82} 10 \left(\frac{1}{\sqrt{P}} - \frac{1}{\sqrt{F}}\right)} $$ (8)
where
\( W_i \) = Bond laboratory ball work index (kWh/tonne)
\( P_1 \) = closing screen size in microns
Gbp = net grams of screen undersize per mill revolution
P = 80% passing size of the product in microns
F = 80% passing size of the feed in microns
Bond also developed laboratory rod mill and crushing tests, each with its own (different) equation for determining the work index. He recommended that the laboratory tests were carried out so that they generated a similar product size to the proposed full scale circuit. Thus any errors associated with an incorrect exponent were minimised, as the Bond laboratory test procedure and his equation for predicting
full-scale performance have the same (incorrect) exponent. This can be shown mathematically by combining equations 6 and 8 and assuming that the laboratory test feed and product are the same as the full-scale plant. The full scale specific energy (W) is given by the expression:
When the conditions proposed for the full-scale plant begin to depart significantly from those of the laboratory test, the Bond equation becomes progressively inaccurate. However, Bond introduced a number of correction factors for such situations and these have been expanded and modified over the years (Rowland and Kjos (1980)) in an attempt to cater for changing circuit designs, in particular the introduction of AG and SAG mills (Barratt and Allan (1986)). As a result there are a number of "rules", mostly unpublished, which are applied by comminution circuit designers to make Bond's equations more applicable to these circuits. This is a most unsatisfactory situation as it does not address the fundamental problem with the equation, merely attempts to treat the symptoms of its inadequacy.
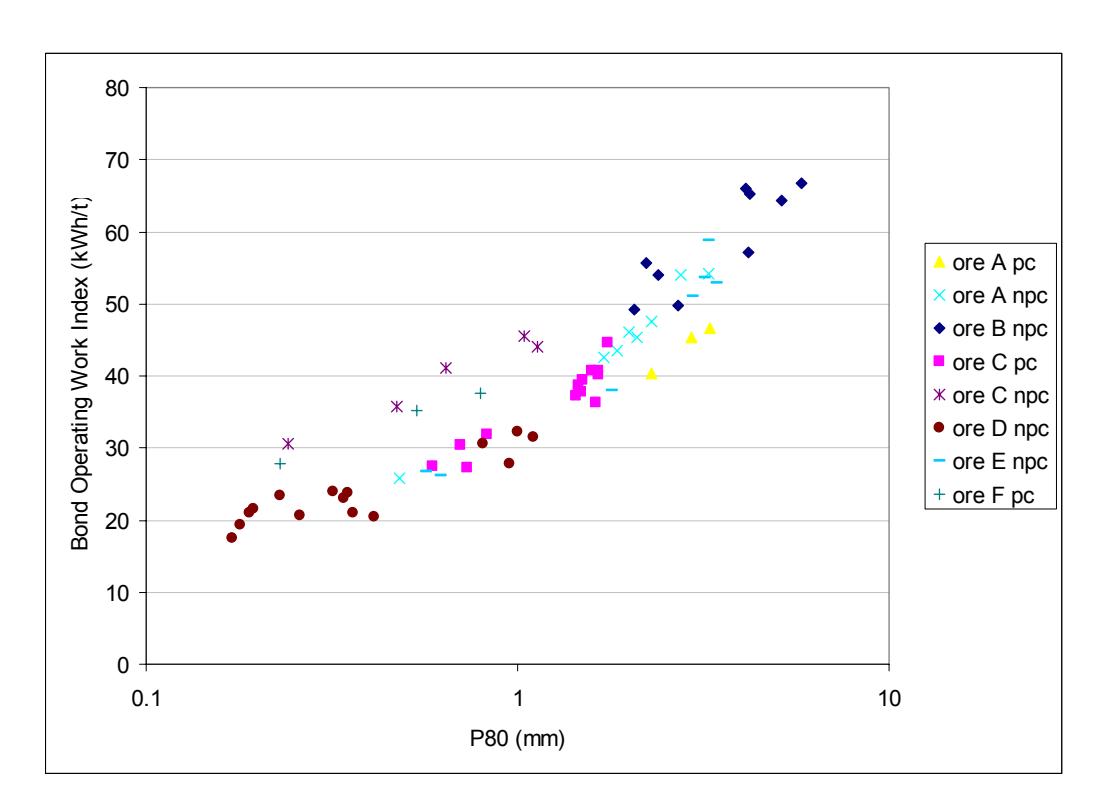
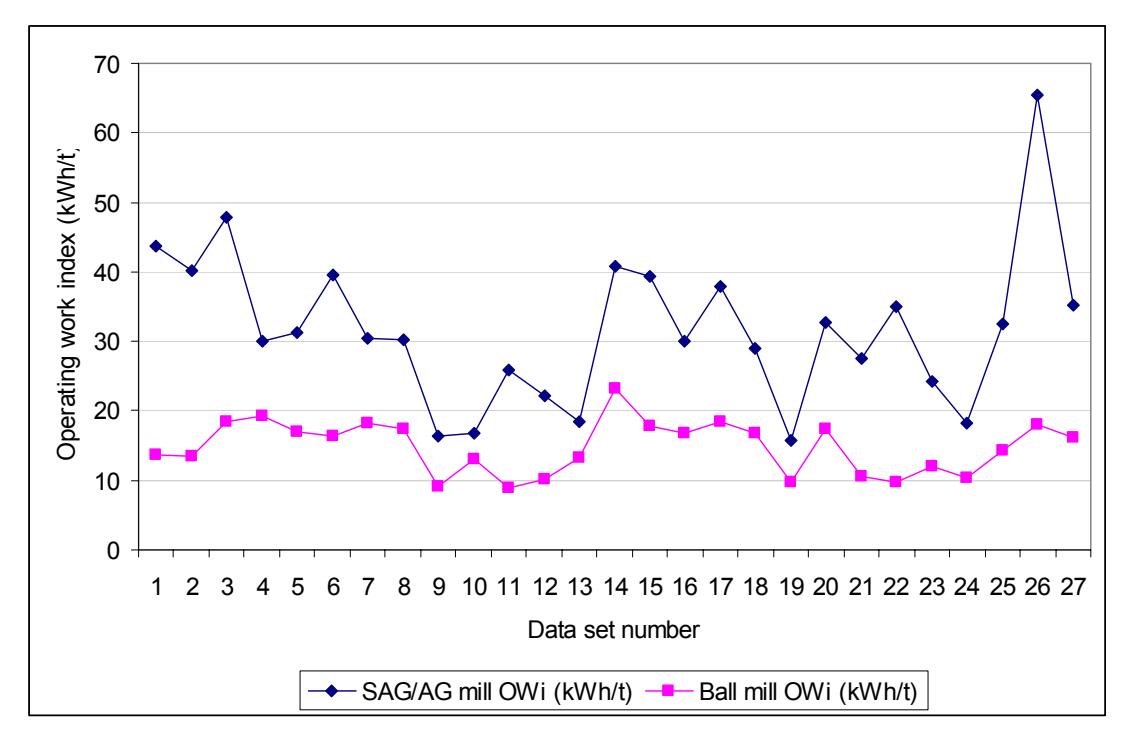
If Bond's equation holds, then for a given comminution step, regardless of the feed and product size, the Bond operating work index (OWi) should remain constant. This should be true providing the efficiency of the comminution step remains constant as well as the resistance to breakage of the rock. Data from different pilot AG/SAG mill programmes were analysed using equation 7 to see whether the Bond OWi did remain constant regardless of the feed f80 and product p80 sizes. The data comprise 8 different programmes using 6 different ore types. The individual results in each programme represent tests run with different ball charges, closing screen sizes and feed sizes. The results are summarised in Figure 1. In all of the 8 programmes the Bond OWi was not found to be constant but decreased as the product size became finer, indicating a systematic bias in Bond's equation. Further evidence of this trend was found in the differences between the Bond OWi for AG/SAG mills and the ball mills that they feed. This is illustrated in Figure 2 where the Bond operating work indices from 27 full scale AG/SAG – ball mill data sets are presented. In each case the data sets comprised a feed size, product size and specific energy for both the AG/SAG mill and ball mill circuits, the product size of the AG/SAG mill circuit being the feed to the ball mill circuit. All of the work indices from the AG/SAG circuits were found to be significantly higher than their associated ball mill data, on average being 115% higher.
It is possible that these results could reflect differences in the efficiency of AG/SAG mills compared to ball mills ie ball mills are more efficient than AG/SAG mills. However, a study by Morrell et al (1991) of a SAG-ball mill circuit running in parallel with a multi-stage ball mill circuit crushing and grinding the same feed to the same product size showed that the specific energy for each circuit was identical ie they had the same energy efficiency. Further evidence of this was reported by Larsen et al (2001) from pilot studies of various circuit configurations. These included single stage AG/SAG milling, AG/SAG milling followed by ball/pebble milling and rod/ball milling. They concluded that, regardless of how the circuit was configured, the overall power consumption remained the same within the limits of data accuracy ie the energy efficiency of AG/SAG mills and ball mills was similar. This is not to say that all circuits, regardless of how they are operated, will have the same energy efficiency. It is not very difficult to operate a circuit in a way that will significantly affect its energy efficiency eg poor classification, incorrect ball size, inappropriate slurry density can increase significantly the specific energy required to grind to a specified product size. However, it is asserted that in most cases, providing circuits are operated under optimum conditions, the overall specific energy to grind a particular ore from a specified feed f80 to a specified product p80 will be similar, at least to within +/- 5%, regardless of the circuit configuration.
Another interpretation of the data in Figures 1 and 2 might be that the changes in operating work index reflect changes in the resistance to breakage as the product size varies. However, research has shown that the resistance to breakage tends to increase as particle size reduces (Tavares and King (1998)), whereas the data in Figures 1 and 2 would suggest the opposite. It is concluded that the most likely reason for these trends is that the Bond equation is incorrect.
A NEW ENERGY-SIZE RELATIONSHIP
The trend of increasing Bond operating work index as product size increases, points to a relationship such as that proposed by Hukki as being more appropriate. However, Hukki's equation, as with Walker's, assumes constant material properties with respect to particle size. As previously stated this has been shown to be incorrect, rock strength typically increasing as size decreases. This phenomenon is attributed to the size and density of pre-existing cracks and imperfections, which reduce as particle size reduces (Griffith (1920), Weibull (1939), Rumpf (1973)). Further evidence of this phenomenon is sometimes inferred from Bond laboratory tests at different closing screen sizes. These results sometimes show a trend of increasing laboratory work index as the closing screen size decreases (Blaskett, 1969). However, it is dangerous to draw these conclusions from the Bond laboratory test as the equation for determining the work index (eq. 8) tends to naturally generate such trends due to the inclusion of the closing screen size in the denominator.
It is proposed that a more complete description of a general form of comminution equation is given by:
$$ dE = -C.g(x)\frac{dx}{x^{f(x)}} $$ (10)
where
g(x) = function describing the variation in breakage properties with particle
size
C = constant related to the breakage properties of the material
From a practical viewpoint one of the problems with equation 10 is that the variation in breakage properties with particle size is not the same for all rocks (Morrell et al (2001)). Hence there is unlikely to be a function g(x) that will satisfy all rock types, though there is evidence that some rocks behave in a broadly similar manner. A general solution to the equation is therefore unlikely to be found. In addition, the experimental determination of the size-by-size properties of a rock over the typical range of feed f80 sizes handled in a comminution circuit (-100mm+0.1mm) would be very difficult, a problem further complicated by the lack of a proven procedure for carrying out such experiments. Practically, therefore, there is little recourse at the current time but to use a value for the breakage property of an ore that does not vary with particle size.
Given this situation, it is proposed that an alternative form of equation that relates specific energy to size reduction is as given below. The rock breakage properties, as represented by a comminution index \( M_i \) , are assumed to be constant with respect to particle size, leaving any variation to be taken up in the form of the function f(x).
where
W = Specific energy (kWh/tonne)
K = Constant chosen to balance the units of the equation
\( M_i \) = Index related to the breakage property of an ore (kWh/t)
\( x_2 = 80\% \) passing size for the product
\( x_1 = 80\% \) passing size for the feed
The value for \( M_i \) can be determined experimentally using a Bond laboratory grinding test with suitable modifications to equation 8 or determined from plant data.
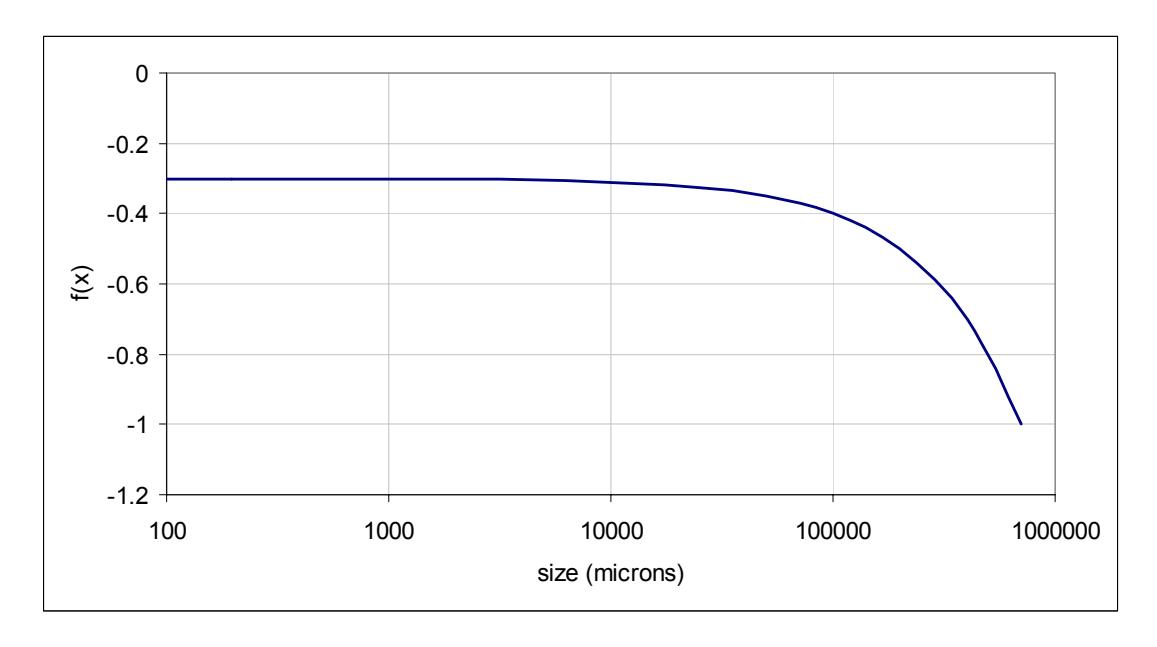
The problem still remains as to what form the function f(x) should take. This was determined by reworking the 27 AG/SAG and ball mill data sets. Given that, on average, the energy efficiency of AG/SAG and ball mill circuits should be similar and that \( M_i \) should be independent of product size, for a given plant the value of \( M_i \) for the AG/SAG mill circuit should be the same as that for the ball mill. Various forms of the function f(x) were therefore used so as to satisfy this condition.
The equation which gave the best results is plotted in Figure 3 and had the form:
where
a,b = constants
x = 80% passing size
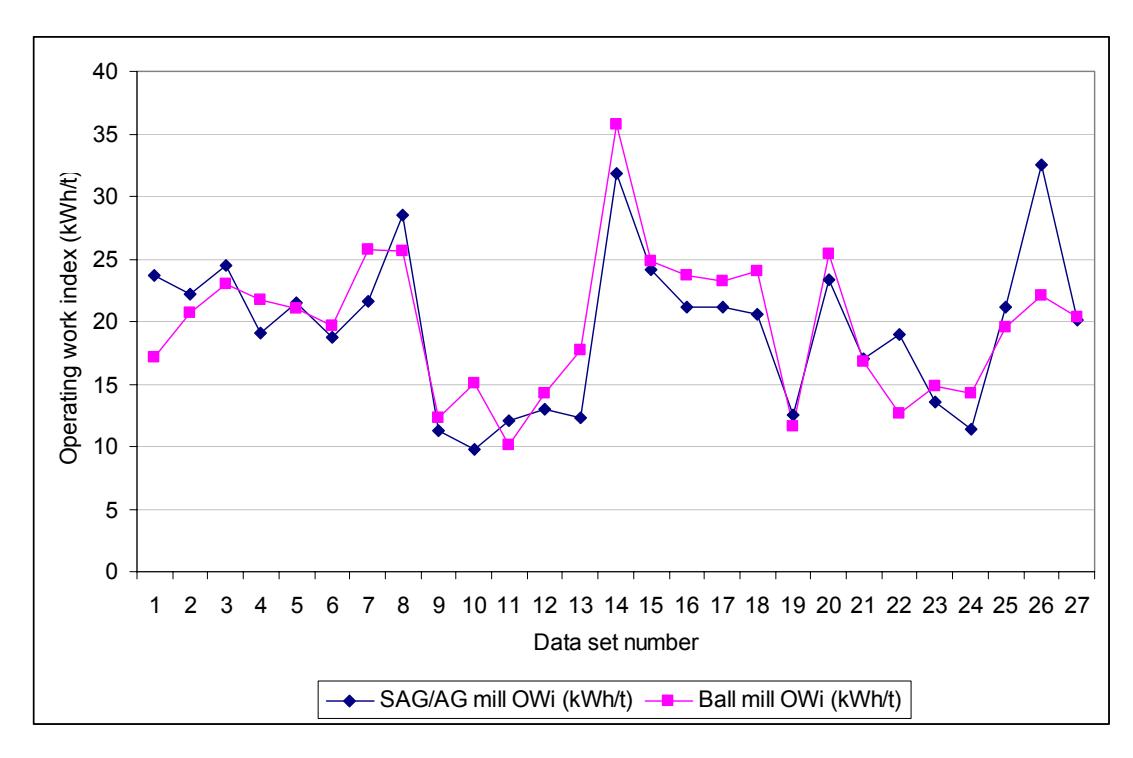
Using this equation the mean value of Mi (as determined using plant data only) for the AG/SAG mill circuits was identical to that of the ball mill circuits. Individual results from the 27 data sets are plotted in Figure 4 and should be compared to the Bond operating work indices in Figure 2. It is clear that the new relationship significantly reduces the differences in operating work index between AG/SAG and ball mill circuits.
APPLICATION
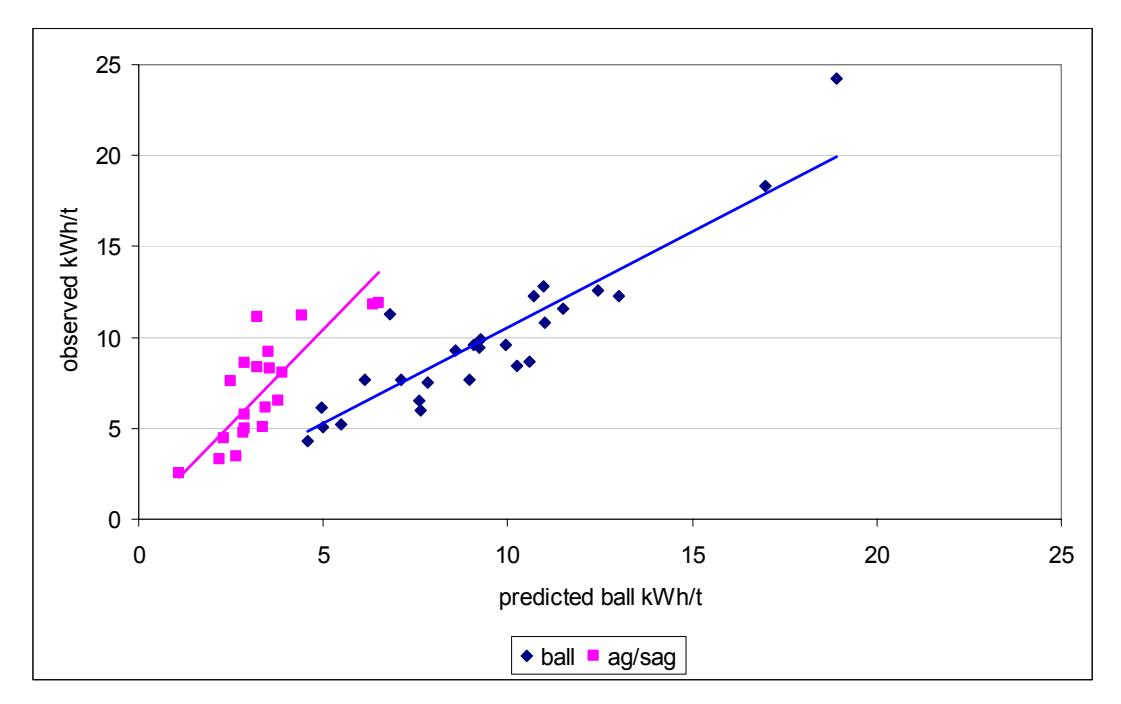
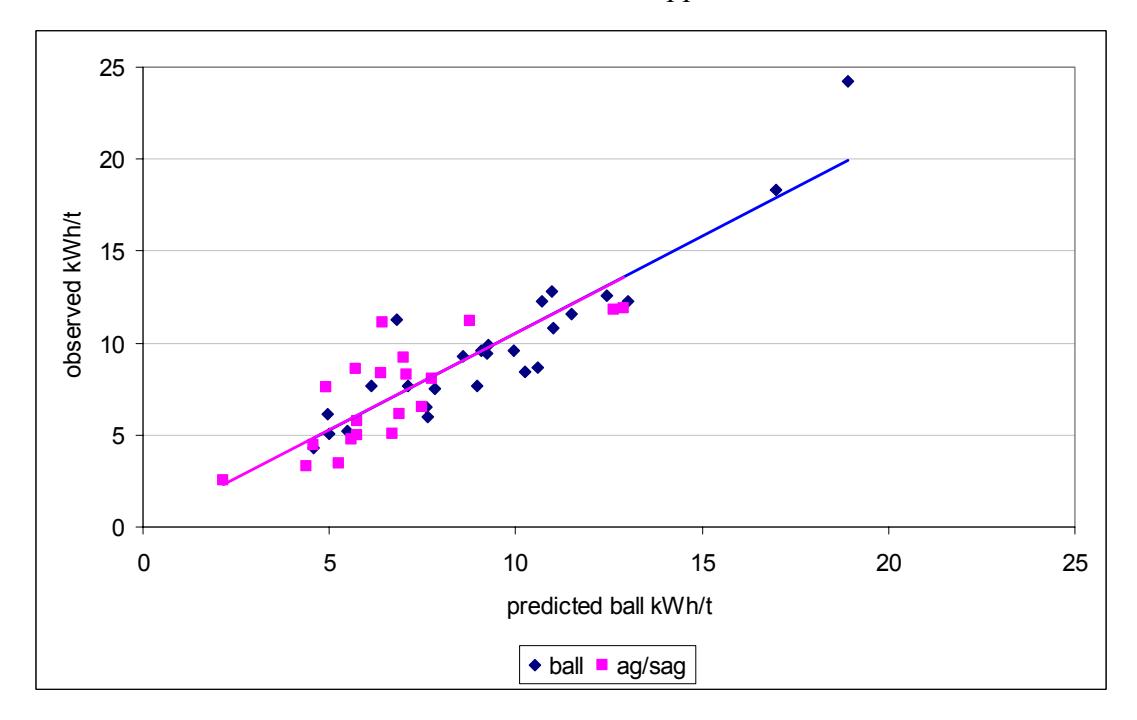
To test the use of equation 11 in greenfield situations the 27 AG/SAG – ball mill circuits were used to evaluate its accuracy and compare it to one based on using Bond's equation. The Bond laboratory ball mill work indices were available for all of the 27 data sets and were initially used in Bond's equation (3) to predict what the specific energy should be in the full scale AG/SAG and ball mill circuits. The feed and product sizes measured from each circuit were used. No correction factors were applied. The predicted specific energies were then compared with the values obtained in practice. The results are shown in Figure 5. As expected, without the use of any corrections the predictions for the AG/SAG mill circuits are very poor. However, by applying a single correction factor of 2 to the AG/SAG mill circuit data, the results were made to align with the ball mill results, as shown in Figure 6.
The Bond laboratory ball mill work indices are not appropriate for use in equation 11 as they are calculated using equation 8, which has an incorrect size exponent of –0.5. Equations 8 and 11 were therefore combined and used in conjunction with the raw data from the Bond laboratory tests to estimate values for the comminution index
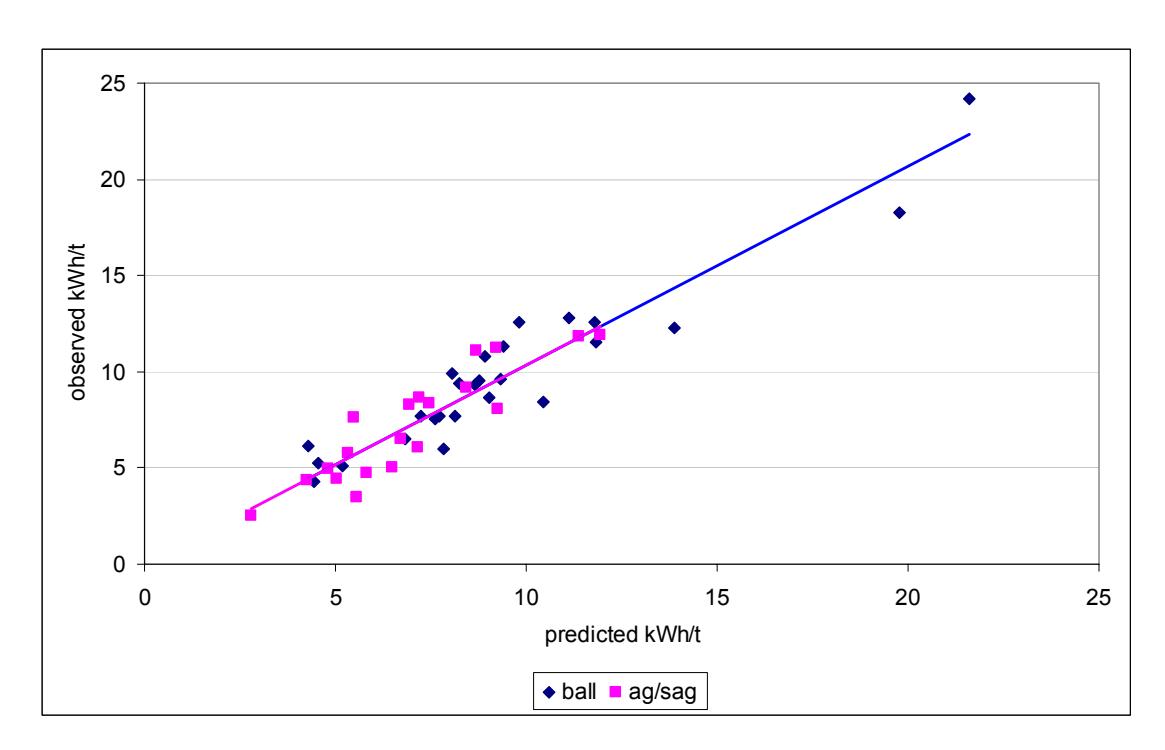
(Mi). These were then used in equation 9 to predict the full-scale circuit specific energies. No correction factors were applied. The results are given in Figure 7. They show that the AG/SAG and ball mill data fall on the same line and that the scatter compared to the Bond approach is reduced by 20% on average.
SIZE REDUCTION – ENERGY PREDICTIONS
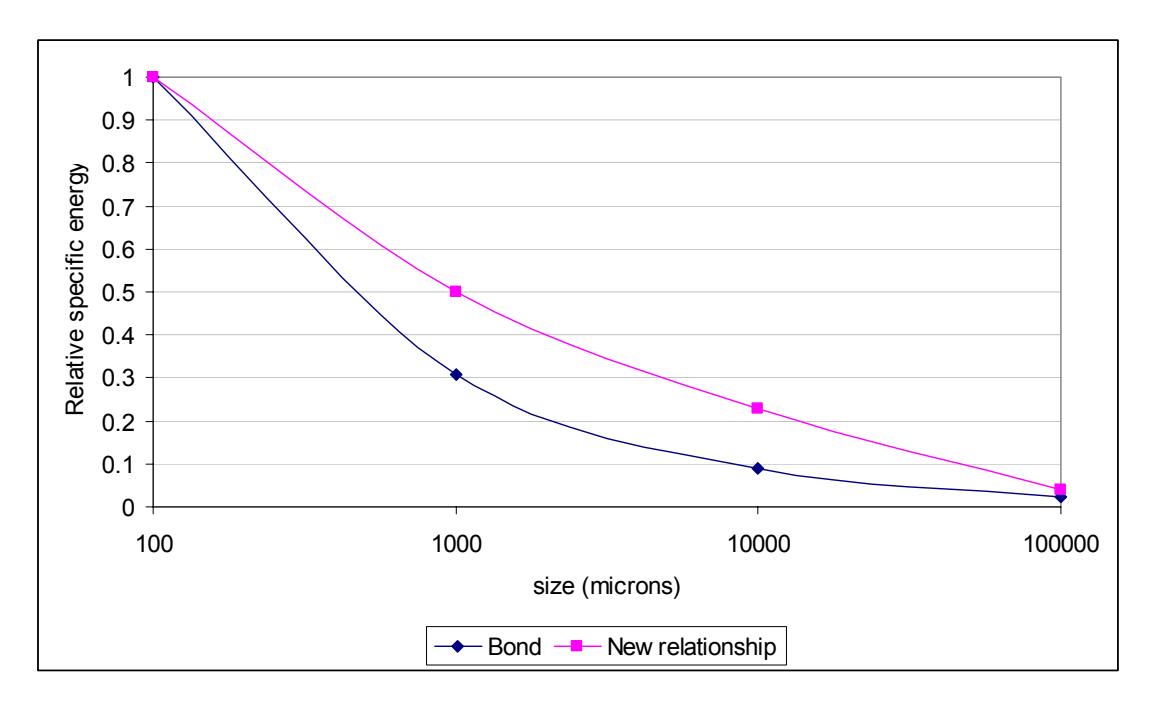
The proposed new energy-size relationship uses a variable size exponent in contrast to Bond's fixed value. It will therefore predict different energy requirements to reduce a rock from one size to another. To illustrate the differences, both equations were used to estimate the relative amounts of energy required to progressively reduce a 1m rock to 100 microns. No correction factors were applied in either case. Figure 8 shows the results. It is interesting to compare the relative amounts of energy predicted to reduce from 100mm to 1mm and from 1mm to 100 microns. These steps are of the same order required in many open circuit SAG mills followed by closed circuit ball mills. The Bond equation predicts approximately 30% of energy would be required for the SAG mill step and 70% for the ball mill. The new equation predicts a 50:50 power split. The latter result is quite common to see in practice and is often used as a basis for design. The Bond prediction for the power split is far from this result. However, circuit designers use a range of correction factors when applying Bond's equation to inflate the power requirement for the SAG mill step and hence often arrive at an answer that indicates a 50:50 power split.
CONCLUSIONS
Without the application of various correction factors, Bond's equation is unlikely to accurately predict the energy requirements in the size range covered by most modern grinding circuits ie –100mm+0.1mm. This is particularly true of AG and SAG mill circuits where its predictions are on average in error by 115%.
This error is the result of the use of a fixed size exponent of –0.5, the use of which is not supported by experimental data. Available data suggest that a variable size exponent, such as proposed by Hukki, is more appropriate.
A new energy-size relationship has been formulated with a variable size exponent. On the basis of available data, this relationship appears not to suffer from the same deficiency as Bond's equation.
REFERENCES
Barratt, D. J. and Allan, M.J., 1986, Testing for Autogenous and Semi-autogenous Grinding: a Designer's Point of View. Minerals and Metallurgical Processing. May, pp 65-74
Blaskett K.S., 1969, Estimation of the Power Consumption in Grinding Mills. Proceeding of the Ninth Commonwealth Min. Metall., 3, pp 631-649.
Bond, F. C.,1952. The third theory of comminution, Trans AIME, vol 193, pp 484- 494
Bond, F.C., 1961 (revised 1962). Crushing and Grinding Calculations. Allis-Chalmers publication O7R9235B
Griffith, A. A., 1920. The Phenomena of Rupture and Flow in Solids. Philosophical Transactions of the Royal Society of London (Series A: Mathematical and Physical), Vol A221, pp 163-197.
Hukki, R.T., 1962. Proposal for a solomnic settlement between the theories of von Rittinger, Kick and Bond, Trans AIME , vol 223, pp403-408.
Kick, F.,1885. Das Gesetz der proportionalen Widerstande und seine anwendung felix, Leipzig.
Larsen, C., Cooper, M. and Trusiak, A., 2001. design and Operation of Brunswick's AG/SAG Circuit, Proc International Autogenous and Semi Autogenous Grinding Technology, Vancouver, vol IV pp 350-367.
Levin, J., 1989. Observation on the Bond Standard Grindability Test, and a Proposal for a Standard Grindability Test for Fine Materials. SAIMM, vol 89, n0.1, pp13-21.
Morrell, S., Johnson, G. and Revy, T., 1991. A comparison through observation and simulation of the power utilisation and performance of two dissimilar comminution plants. Fourth Mill Operators' Conference, Aus.IMM Burnie, pp157-160. March.
Morrell, S., Valery, W., Banini, G. and Latchireddi, S., 2001. Developments in AG/SAG Mill Modelling Proc International Autogenous and Semi Autogenous Grinding Technology, Vancouver, vol IV pp 71-84.
von Rittinger, P. R., 1867. Lehrbuch der Aufbereitungskunde, Ernst and Korn, Berlin,
Rowland, C.A.Jnr and Kjos, D.M., 1978 (revised 1980). Rod and Ball Mills. Mineral Processing Plant Design. Mular and Bhappu (editors), SME, Chapter 12, pp 239-278.
Rumph, H., 1973. Physical Aspects of Comminution and New Formulation of a Law of Comminution, Powder Technology, 7, pp 145-159.
Tavares, L. M. and King, R. P., 1998. Single-particle Fracture under Impact Loading. International Journal of Mineral Processing, Vol. 54, pp 1-28.
Walker, W. H., Lewis W K, McAdams W H, and Gilliland E K., 1937. Principles of Chemical Engineering, New York.
Weibull, W., 1939. A statistical theory of strength of materials. Proceedings of the royal Swedish Academy of Engineering Science (Ingeniorsvetenskapsakademiens Handlingar), No 151