The content on this page was automatically generated from the PDF publication document and may contain errors or inaccuracies. Please refer to the original PDF for the most accurate information.
DESIGN OF THE BIGGEST MILL IN THE WORLD
R.Dunne, S.Morrell & G.Lane
ABSTRACT
The design of the 12m diameter SAG mill installed at the Cadia Hill Mine in New South Wales followed after two years of extensive laboratory and pilot plant testwork. The testwork showed the Cadia ores to be hard and competent necessitating the use of both a variable speed SAG mill drive and pebble crushing. The grinding power requirements for the SAG mill was based on engineering in-house grinding software, pilot plant data and simulations using JK SimMet software. Surveys of the SAG mill during the first four weeks of operation showed the feed size distribution, transfer size and pebble rate to be lower or less than those catered for in the design. To compensate for the lower pebble rate the SAG ball load was increased resulting in the total comminution circuit power being some 0.5kWh/t higher than predicted. The JK SimMet SAG model has been modified to take account of these variations.
INTRODUCTION
In 1998 the world's largest SAG mill and two of the world's largest ball mills were commissioned at Newcrest Mining's Cadia Hill property in New South Wales. The design of the comminution circuit and selection of mill sizes followed after two years of study and evaluation of a wide range of alternatives, predominantly using simulation techniques. An overview of the project from exploration to start-up has been presented elsewhere (Dunne et al 1999).
The grinding circuit for the Cadia Project was designed by the Bechtel Minproc Joint Venture (BMJV) Engineers on the basis of testwork conducted by, and in association with, Newcrest Mining Limited and various consultants including JKTech and Minproc Engineers Limited.
This paper focuses on both the JKTech comminution simulations and the design basis used by BMJV to determine the pinion power of the grinding circuit mills and compares the final design with that resulting from JKSimMet simulation of the circuit, provided by JKTech.
PHYSICAL PROPERTIES OF CADIA ORES
Ore Type
Laboratory test work data indicated hard and competent ores (monzonite, monzodiorites and volcanics), although not necessarily of such competency as to create concern.
The plant was designed for monzonite ore, with allowance in the mine schedule for reduced throughput when treating the harder volcanics. The latter form 7-8% of the orebody and have the potential to reduce throughput by up to 30% if treated by themselves whilst maintaining the same grinding circuit product size.
Unconfined Compressive Strength Data
Unconfined compressive strength (UCS) data from metallurgical testing were typical of a medium strength ore. However, more extensive testing was carried out for geotechnical purposes using single point load tests. Extrapolation of these data indicated an average rock strength of 150-160 MPa, with some values in excess of 200 MPa and 300 MPa. This indicated a significant variation in ore competency and determined that the SAG mill and recycle crusher design would need to be flexible to cope with these fluctuations. This necessitates the use of both a variable speed SAG mill drive and the ability to vary the pebble crusher feed rate.
Abrasion Index
Bond Abrasion Index (Ai) testing indicated significant areas of abrasive material in the orebody, with Ai values of greater than 0.7. This appeared to correlate with zones of alteration. It was accepted that such zones would be significant, and that the design would need to allow for this.
Bond Ball Mill Work Indices
Monzonite Bond Ball mill work indices (Wi) averaged 17.1kWh/t, with a maximum variation of ±9%. The inferred average orebody Wi, based on laboratory grind times over a significant number of drill core samples, was 18.1kWh/t (standard deviation 1.03kWh/t). The pilot plant samples had Wi's of 17.4kWh/t and 17.3kWh/t, respectively. The Wi on various samples have ranged from 15.0 to 25.4kWh/t (including volcanic ores).
PILOT PLANT COMMINUTION TESTWORK
Two pilot plant trials on Cadia Hill monzonite ore were undertaken at the Amdel Laboratory in Adelaide. The first trial targeted a comparison of autogenous grinding (AG) and pebble crushing with semi-autogenous grinding (SAG). The second trial was to compare AG with SAG, both with pebble crushing using revised feed size distributions, ball size distribution and mill trommel size. These revised conditions increased the specific throughput, but resulted in similar overall circuit power consumptions. A summary of the pertinent data is provided in Table 1.
A ball mill was operated on cyclone classified AG mill trommel undersize to gather data pertaining to ball mill operating Wi, power consumptions and breakage rates on the typically bimodal AG/pebble crusher circuit product. The measured specific power for the ball mill was 6.13kWh/t for a P 80 of 168µm.
The pilot plant trials were conducted with a jaw crusher as a pebble crusher. Unfortunately, the jaw crusher was difficult to set to a fine crush of 80% passing trommel screen size. Therefore, the circulating load about the crusher was enhanced by an uncrushed 10mm to 15mm fraction.
The pilot plant trials were restricted to the monzonite ore. The ore sample tested was compared with both monzonite and volcanic ore hardness, competency, and abrasiveness as determined from benchscale tests (eg Bond tests, media competency, drop weight tests, etc). The pilot plant sample was determined to be representative of the monzonite ore in most respects, with the exception of the Bond Abrasion Index. The Ai of the pilot plant sample at 0.32 was significantly lower than that for the majority of the monzonite.
JKMRC PROCEDURE FOR SIMULATION OF THE CADIA COMMUNITION CIRCUIT
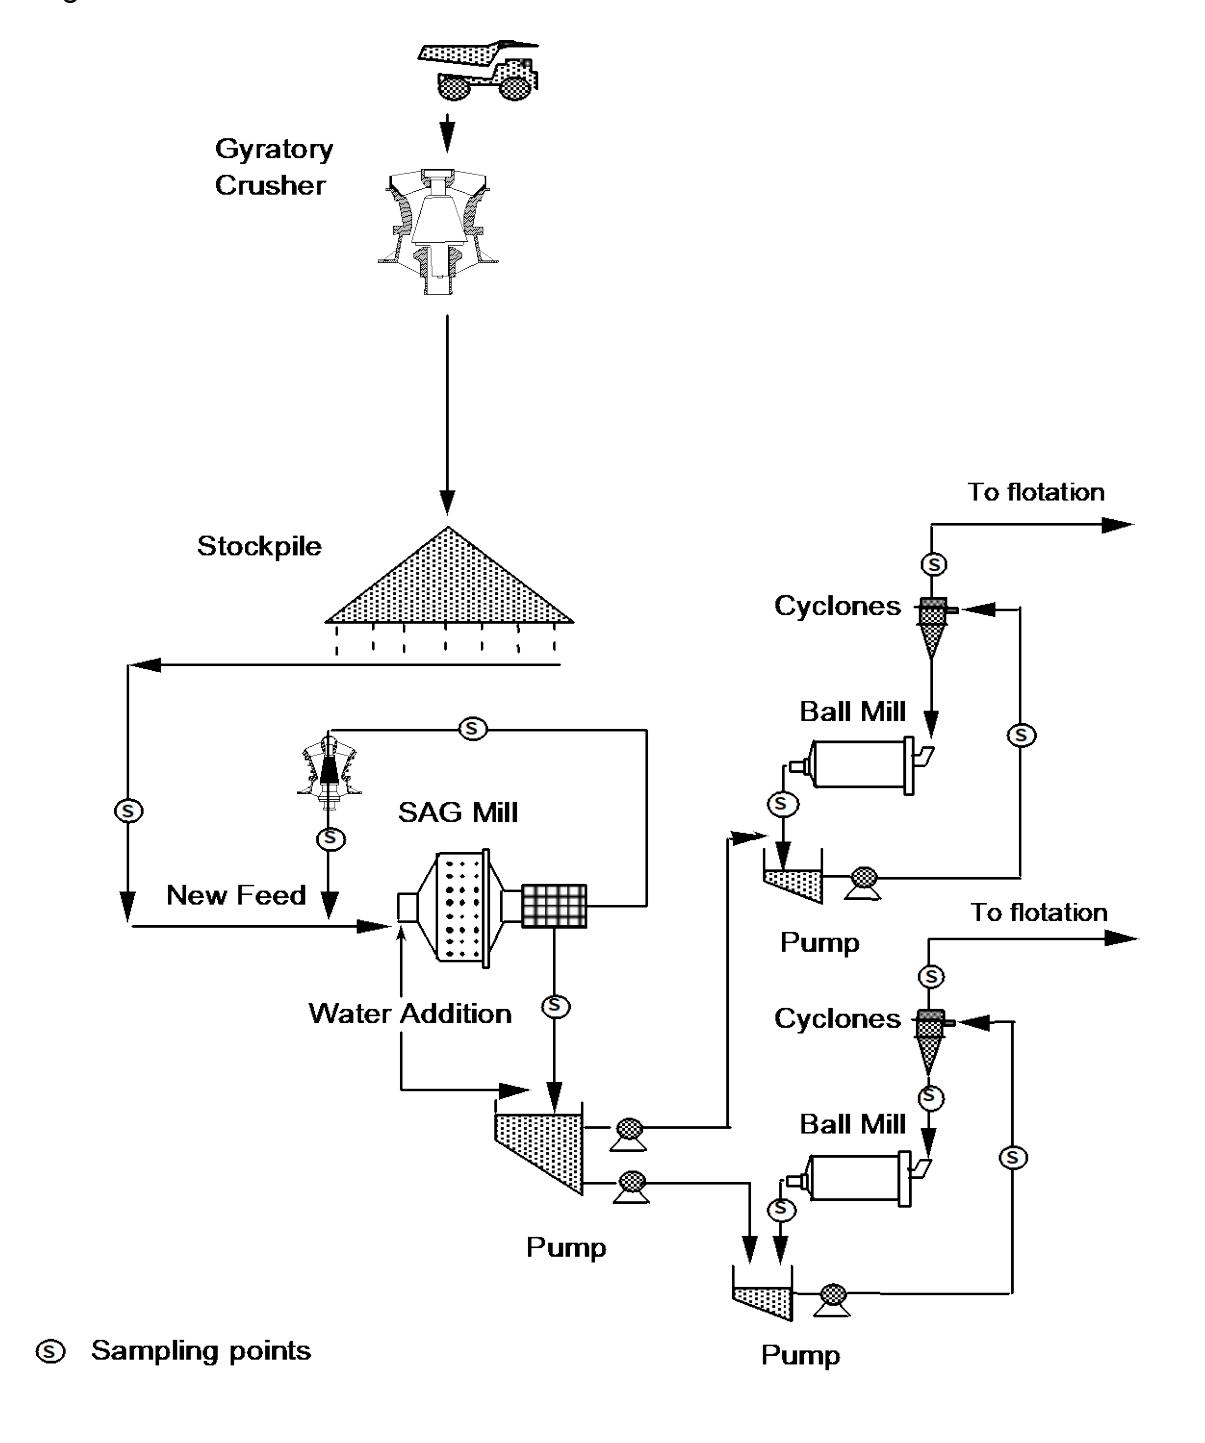
The flowsheet design for the Cadia comminution circuit is shown in Figure 1 and comprises an SABC circuit with a single SAG mill feeding 2 ball mills in parallel. The SAG mill has 2 pebble crushers installed in closed circuit.
Table 2a and 2b outline the dimensions and operating conditions that were used for the final comminution circuit simulations. Details of the models incorporated in the simulator are well described by Napier Munn el al 1996.
The recycle crusher closed size setting (CSS) is 10mm and the aperture of the screen panels in the SAG mill trommel are 12mm.
Ore Breakage Paramaters
Table 3 shows the breakage parameters used, which are those derived from the ore treated during the pilot campaign on the monzonite ore and laboratory drop weight testwork.
The A, b and ta parameters were obtained from drop-weight and tumbling tests, whilst the Bond Wi was obtained from a Bond laboratory test. Drop weight data for a Volcanic ore is included for comparative purposes.
SAG Mill
The simulation model on which the Cadia Hill SAG mill was based on surveyed data from two pilot SAG (12% balls) run with recycle crushing. These were part of the second of two pilot campaigns and were runs with two different load volumes of approximately 21% and 31%. The data from these tests were used to fit the breakage rate parameters and slurry flow parameters. These were then scaled to be consistent with the designed mill configuration at 12% ball, charge, 78% of critical speed and a new feed F80 of 142mm.
A feed size F80 was then chosen on the basis of the JKMRC ta- versus F80 correlation which indicated that a 200mm CSS in the primary crusher should give a SAG feed F80 of 153mm ± 15mm. The JKMRC data based was searched for a copper ore with such an F80 which was used for the simulation study. Finally the model was used to adjust the rates to reflect the design requirement of an 8% ball charge. Full scale mill power draw was predicted using Morrell's model (1996). The pilot rates and scaled-up 12% ball charge rates are shown in Table 4.
Ball Mill
From ball mill tests in the first pilot campaign breakage rates were fitted to the data and averaged. These rates were subsequently scaled using the procedure described previously. The rates were de-rated by 5.3% to take account of potential grinding ball size effects. This estimate was based on a JKMRC theoretical model (Morrell, 1993). Details of the pilot breakage rates and scaled-up ores are given in Table 5. Full scale mill power draw was predicted using Morrell's model (1996).
Cyclone
The parameters were derived from the first pilot program using 150mm cyclones together with data from 380mm cyclone tests conducted at the JKMRC. The model inherently scales for cyclone dimensions so no manipulation of the model parameters is required to predict the performance of the 660mm units specified in the design.
Pebble Crusher
An Andersen/Whiten crusher model was used (Morrell et al, 1992) based on the performance of 7 foot shorthead running with a closed side setting of 10mm. Power draw is inherently predicted by the model and is based on the degree of size reduction and the ore hardness as measured by drop-weight testing.
Simulated Data
The results of simulating the final design are summarised in Table 6 for the case with the mill running with a relatively high SAG mill load scenario.
BMJV DESIGN CRITERIA
The mills were sized for treating monzonite ore only at an annual treatment rate of 17 million tonnes (2065tph). Addition of volcanic ore will reduce capacity by up to 30% at design grind product size.
For the circuit design a Bond ball mill work index of 18.1kWh/t was used with design contingency to increase to a maximum of 19.1kWh/t.
Design comminution data is summarised in Table 4.
Mill Power Determination
The determination of Cadia grinding circuit power requirements was conducted using Minproc's in-house grinding software, pilot plant data and review of simulations prepared by JKTech using JKSimMet software.
The Minproc in-house software uses a combination reduced efficiency calculation, based on pilot plant SAG mill discharge size distributions, pilot plant SAG mill specific power, pilot plant ball mill specific power, pilot plant product size distributions and Bond-type calculations (as reported by Rowland 1982, and modified by Minproc).
These methods agreed closely and gave an overall circuit specific power of 14.95kWh/t (30,850kW @ 2,065t/h) for a ball mill Wi of 17.1kWh/t.
Scaling this overall power for a maximum ball mill Wi of 19.1kWh/t (average 18.1kWh/t plus one standard deviation of 1kWht) indicated a maximum power requirement of 16.7kWh/t (34,460kW).
SAG Mill Power
SAG mill base power was estimated from pilot plant data, for a SABC circuit with 8% balls, at 7.8kWh/t (16,100kW).
Maximum SAG mill power was determined by deducting the installed ball mill pinion power of 7.95kWh/t (16,400kW) from the maximum overall circuit power of 16.7kWh/t to give 8.75kWh/t (18,060kW).
Analysis of typical SAG mill installations in the copper industry indicates that typically less than 90% of installed motor power was used on average. Therefore, the installed motor power was determined to be 20,000kW (18,060/90%).
Checks were carried out to ensure that the SAG mill could utilise this power within a reasonable envelope of operating conditions.
Ball Mill Power
From analysis of the pilot plant data, it was determined that the lowest SAG mill power draw would be 7.0kWh/t when using a 12% ball load and low rock load. For an overall circuit power of 14.95kWh/t, this indicates that the ball mill should be designed for 7.95kWh/t (16,400kW).
The motor power requirement was set using North American practice of 95% of installed motor power on 17,500kW.
Design Contingencies
For a nominal design Wi of 18.1kWh/t, the specific pinion power requirement is 15.8 kWh/t (32,680kW).
The installed motor power is 18.2kWh/t (37,500kW), providing a margin of 2.4kWh/t or 15% for drive train losses and contingency.
Additional contingency was provided by the ability to coarsen the product size. The circuit design will provide an effective P80 of 106µm for sulphide minerals due to the high specific gravity of the sulfides and the plant gravity classification process. All benchscale recovery data is based on a laboratory grind size of P80 150µm.
Bond's ball mill design procedures indicate that there are significant ball mill efficiencies with larger mill diameters. These have not been accounted for in this analysis and may provide additional contingency.
ACTUAL PLANT DATA VERSUS SIMULATED DATA
During the start up period of the Cadia Hill concentrator a progressive and detailed research program was undertaken over four weeks in order to assist in developing a link between pilot and full scale plant comminution models (Valery, 1999). The grinding circuit was operated and surveyed under steady state conditions in autogenous and semi autogenous mode. Table 7 summarises key results from these surveys.
Actual plant operating performance is shown in Table 8 and this is compared to design conditions and a pilot plant survey that best represents the operating conditions of the mill at present (Hart el al, 2000).
The comparison shows a high degree of reliance placed on achieving high pebble production rates and crushing efficiency in the pilot plant and design criteria for the Cadia SAG mill. In practice the predicted rates have not been achieved. The transfer size T80 and T50's are finer than predicted (56% finer). The SAG specific power consumption is higher than design because of the higher ball load however this is partially compensated for by a lower
pebble crusher power consumption due to a lower recycle load. The total comminution circuit power is around 0.5kWh/t higher than predicted. Average throughput rates are slightly lower than design (5% lower) while throughput rates at Cadia have varied between 1600tph to 2400tph. The lower than design throughput rate must be viewed in the light that volcanic ores form part of the feed (average of 7%) for the first three years of operation. The main factor that has benefited the plant operation compared to the initial design and pilot plant operation is the SAG mill feed size distribution, which is 40% finer than design and slightly finer than was used during the pilot plant campaign. The parameters that have been adjusted in order to meet design throughput are:
- Ball load has been increased to 13% from 8% design;
- Grate size opened to 90mm from 70mm;
- Mill speed increased from 74 to 81% over life of liners;
- Mill liner reconfigured to allow earlier speed up of mill.
Also, shown in Table 9 are the results from survey data of the circuit running as far as possible under similar conditions to those simulated. It can be seen that the observed performance is similar to that predicted, particularly the specific power data. It is also apparent that the high load condition promotes lower throughput than the low load condition and is less power efficient. This became apparent at the simulation stage when it was found that target throughput could not be met when running with a high load without resorting to a 12% ball charge. With a low load level the model predicted that an 8% ball charge would be sufficient. Unfortunately, during commissioning an 8% ball charge was never tried and due to an oversight ball addition was increased from 4% to 12%. Subsequently this ball load was maintained. However the low load condition has been confirmed as being the one most likely to result in higher throughput as shown in Table 9. The low load level data shown was collected immediately following a high load level run during which maximum throughput was 2100tph. When the load level was dropped and the mill allowed to come to equilibrium, 2500tph was consistently achievable.
In the case of the pebble crusher circuit the simulation results were found to be less accurate than would have been hoped for. This is seen in the lower than predicted pebble crusher recycle loads and power draws which were much higher than observed in practice.
CONCLUSIONS
Two conclusions can be drawn from this paper. Firstly, that simulation based on models which describe as far as possible the physical processes which take place in comminution and classification machines can be used to great effect when designing a new plant. Secondly, the lack of any empirical corrections in these models for the effect of scale indicate that the very large diameter SAG and ball mills at Cadia Hill behave in a similar manner to smaller units and hence there is no suggestion that efficiency changes with changing diameter up to the size of these units.
ACKNOWLEDGEMENTS
The authors acknowledge the unfailing support and help of Courtney Chamberlain, Rod Chittenden, Geoff Cullen, Alan Boughey and Ian Ritchie during the conceptual and design stage of the Cadia comminution circuit. A special thanks to Steve Hart, Walter Valery, Doug Brown and the team of JK research students who spent a many a long day, and night, carrying out comminution circuit surveys. The excellent quality of the survey database is a tribute to their enthusiasm and dedication.
REFERENCES
Dunne R, Chittenden R, Lane G and Morrell S, 1999 . The Cadia Gold Copper Project - Exploration to start-up. SME Annual Meeting, Denver, Colorado March 1-3.
Lynch A J and Morrell S, 1992. The understanding of comminution and classification and its practical application in plant design and operation. Comminution - Theory and Practice, K. Kawatra (ed), SME, Ch 30 pp 405- 426.
Morrell S, Napier-Munn T J, Anderson J, 1992 . The prediction of power draw is comminution machines. Comminution - Theory and Practice, K. Kawatra (ed) SWE, Ch 17, pp 235-247.
Rowland CA, 1982. Selection of Rod Mills, Ball Mills, Pebble Mills and Regrind Mills, Design and Installation of Comminution Circuits . Mular and Jergensen (ed). SME.
Hart S, Dioses J, Reed M, Gelfi P, Clements B, Valery W and Dunne R. 2000. Cadia Mines – Reflections after One Year's Operation , SME Annual Meeting, Salt Lake City, Utah, 28 February – 1 March.
Valery W. 1999. Development of an Advanced Model of the Cadia Mines Comminution Circuit . JKMRC Report.
Morrell, 1993. Power Draw of Wet Tumbling Mills and it's Relationship to charge Dynamics, Part 1 and 2 . Trans Inst Min Metall, Section C, Volume 105, C43-62.
Morrell, 1993. Predictions of Power Draw in Wet Tumbling Mills . PhD Thesis, University of Queensland.
Napier-Munn TJ, Morrel S, Morrison RD and Kojovic T. 1996. Mineral Comminution Circuits - Their Operation and Optimisation. JKMRC Monograph Series in Mining and Mineral Processing.
| Circuit | Throughput | Feed Size | Specific Power | Product Size |
|---|---|---|---|---|
| Configuration | (tph) | F80 (mm) | (kWh/t) | (%-150µm) |
| SAG 8% balls | 0.94 | 120 | 10.98 | 43.9 |
| SAG 12% balls & | 1.55 | 102 | 7.20 | 32.6 |
| pebble crusher | ||||
|
AG
+ pebble |
0.82 | 102 | 7.87 | 39.8 |
| crusher |
Special Note: The above analysis assumed a no-load power on the SAG mill of 1.6kW.
| Items | SAG Mill | Ball Mill | |
|---|---|---|---|
|
Diameter -
inside liners |
(m) | 12.04 | 6.5 |
|
Length -
belly inside liners |
(m) | 6.096 | 10.97 |
|
Length -
centre line |
(m) | 8.522 | 10.97 |
| Trunnion diameter | (m) | 2.235 | 2.438 |
| Speed (fr. Critical) | 0.78 | 0.74 | |
| Grate aperture | (mm) | 25 | - |
| Pebble port aperture | (mm) | 70 | - |
| Open area fraction | 0.1 | - | |
| Ball charge volume | (%) | 8 | 33 |
| Items | ||
|---|---|---|
| Diameter | (mm) | 660 |
| Inlet | (mm) | 254 |
| Vortex | (mm) | 250 |
| Spigot | (mm) | 120 |
| Cylinder length | (mm) | 570 |
| Cone angle | (deg) | 15 |
| Pressure | (Kpa) |
65 -
80 |
| Overflow % solids |
35 -
40 |
| Parameters | Monzonite Ore | Volcanics Ore |
|---|---|---|
| A | 65 | 65 |
| b | 0.581 | 0.410 |
| ta | 0.494 | 0.210 |
| Bond Ball Wi | 17.5kWh/t | 25.3kWh/t |
| Mill Breakage Rates | ||||
|---|---|---|---|---|
| Particle Size | Low Volume Load1 | High Volume Load2 | ||
| (mm) | Pilot3 | Scale-Up | Pilot3 | Scale-Up |
| 0.25 | 2.12 | 1.68 | 1.25 | 1.67 |
|
16.0
4.71 3.30 2.85 1.77 |
4.0 | 4.11 | 3.42 | 3.31 | 2.88 |
|---|---|---|---|---|---|
|
44.8
3.97 2.98 2.87 2.67 |
|||||
|
128.0
5.75 4.58 5.02 4.23 |
1 Load volume of 21%
| Particle Size | Ln (Breakage Rates) | ||||||
|---|---|---|---|---|---|---|---|
| (mm) | Pilot Run 1 | Pilot Run 2 | Pilot Run 3 | Average | Scale-Up | ||
| 0.156 | 0.222 | 0.3807 | -0.7533 | -0.53 | 1.08 | ||
| 0.625 | 1.65 | 1.95 | 2.16 | 1.92 | 3.06 | ||
| 2.50 | 4.19 | 4.50 | 4.36 | 4.35 | 5.05 | ||
| 10.0 | 4.21 | 4.40 | 4.40 | 4.34 | 4.97 | ||
| Pilot Plant | JKTech3 | Bechtel | ||
|---|---|---|---|---|
| Minproc | ||||
| Treatment Rate | t/h | 2,065 | 2,065 | |
| UCS | MPa | 115 | 17.5 | 17.1 |
| Ball Wi | kWh/t | 17.3 | ||
| Rod Wi | kWh/t | 21.1 | ||
| SAG Mill |
2 Load volume of 31%
3 Ball charge of 12%
| Specific Power | kWh/t | 7.12 | 8.56 | 7.8 | |
|---|---|---|---|---|---|
| Feed (F80) | mm | 200 | 142 | 200 | |
| Product (P80) | µm | 6.480 | 5770 | ||
| Ball load | |||||
| - normal | % | 8 | 8 | ||
| - max | % | 12 | 12 | 12 | |
| Motor Power | MW | 20 | |||
| Operating Power | MW | 14.70 | 17.67 | 16 | |
|
Speed
% crit |
74 | 78 | 74 | ||
| Crusher | |||||
| Number | 1 | 2 | 2 | ||
| Type | JAW | Generic | HP 1000 | ||
| Cone | |||||
| Pilot Plant | JKTech3 |
Bechtel
Minproc |
||
|---|---|---|---|---|
| Number | 2 | 2 | ||
| Motor Power | MW | 7.5 | 8.75 | |
| Total Motor Power | MW | 17.5 | 17.5 | |
| Specific Power | kWh/t | 7.79 | 7.50 | 7.11 |
| Operating Power | MW | 16.1 | 15.5 | 14.75 |
| P80 | µm | 150 | 151 | 150 |
|---|---|---|---|---|
| Grinding Spec. power | kWh/t | 14.9 | 15.0 | 15.0 |
| Total Power | ||||
| - Operating | MW | 34.05 | 30.9 | |
| - Motor (excluding crushers) | MW | 33.1 | 37.5 |
All JKTech Power data adjusted by 0.93 to reflect pinion power rather than motor input power.
| Survey/Parameter | 1 | 2 | 3 | 4 | 5 | 6 | 7 | 8 |
|---|---|---|---|---|---|---|---|---|
| Date | 21/6/98 | 22/6/98 | 29/6/98 | 30/6/98 | 21/7/98 | 23/7/98 | 30/10/98 | 23/3/98 |
| Configuration | AG | AG | SAG | SAG | SAG | SAG | SAG | SAG |
| New Feed (tph) | 554 | 1260 | 1367 | 1403 | 1848 | 2092 | 2270 | 2186 |
| F80 (mm) | 110 | 106 | 93 | 109 | 92 | 98 | 121 | 132 |
| F20 (mm) | 14.8 | 18.9 | 11.3 | 12.1 | 6.8 | 8.3 | 14.7 | 22.3 |
| Power Draw (kW) | 11189 | 10321 | 10824 | 14945 | 17586 | 17963 | 18513 | 19324 |
| Ball Load (%) | 0 | 0 | 4 | 4 | 12 | 12 | 13 | 14 |
| Total Load (%) | 28.8 | 28.5 | 25 | 40.7 | 31.6 | 26.1 | 27.5 | 32.8 |
| Mill Speed (%CS) | 79 | 79 | 78 | 78 | 74 | 78 | 79 | 78 |
| Transfer T80 (mm) | 3.29 | 2.24 | 1.74 | 1.01 | .826 | 1.34 | 2.72 | 2.03 |
| Transfer T50 (mm) | 0.53 | 0.127 | 0.183 | 0.118 | 0.164 | 0.229 | 0.280 | 0.288 |
| Pebbles | 349 | 349 | 379 | 434 | 313 | 339 | 228 | 506 |
| Ball Mill | ||||||||
| Power Draw (kW) | 8141 | 8056 | 8602 | 8608 | 8894 | 8790 | 8761 | 8789 |
| Cyc O/F P80 (mic) | 71 | 123 | 92 | 99 | 119 | 139 | 150 | 141 |
| Overall Circuit | ||||||||
| Sp. Power (kWh/t) | 34.9 | 15.0 | 21.0 | 23.3 | 19.5 | 17.3 | 16.1 | 17.2 |
| Operating Wi | 30.1 | 17.2 | 20.7 | 23.9 | 22.0 | 21.2 | 20.5 | 21.1 |
Notes: Power reading from plant DCS
1 ball mill operating for surveys 1 and 2
Scats rate lower than predicted for survey 7 due to weightometer error
| Parameter |
Design
Pilot Plant Actual |
Variance % | |||
|---|---|---|---|---|---|
| (S. 5 1995) | (Jul-Nov 99) | (Act v Design) | |||
| Crushing Work Index (kWh/t) | 30.7 | 30.7 | 28.5 | (7.2) | |
| Bond Rod Work Index (kWh/t) | 19.9 | 21.1 | 20.5 | 3.0 | |
| Bond Ball Work Index (kWh/t) | 18.0 | 17.3 | 17.0 | (5.5) | |
| Feed Rate (tph) | 2065 | - | 1960 | (5.1) | |
| SAG Specific Power (kWh/t) | 7.8 | 7.2 | 9.9 | 26.9 | |
| Feed F80 (mm) | 150 | 102 | 90 | (40.0) | |
| Product T80 (mm) | 3.8 - 7.6 | 5.1 | 2.5 | (56.1) | |
| Ball Load (%) | 8 | 12 | 13 | 87.5 | |
| Total Load (%) | 25 | 31 | 30 | 20 | |
| Speed (% Critical) | 74 | 76 | 75 | 1.4 | |
| Grate Opening (mm) | 25 | 10 | 70 & 90 | 220 | |
| Pebble Port Opening (mm) | 60 | 70 | - | - | |
| Pebble Rate (% New Feed) | 35 | 68 | 27 | (23.0) | |
| Simulated | Actual | Simulated | Actual | ||
|---|---|---|---|---|---|
| New feedrate | (t/hr) | 2065 | 2600 | 2065 | 2186 |
| New feed P80 | (mm) | 142 | n/a | 142 | 132 |
| Cyclone Overflow P80 | (mm) | 149 | 1671 | 151 | 141 |
| SAG ball load | (%) | 8 | 13 | 12 | 14 |
| SAG total load | (%) | 21 | 22-232 | 31 | 33 |
| SAG power | (kW) | 15934 | 18884 | 18996 | 19718 |
| % recycle to pebble crusher | (%) | 33 | 21 | 58 | 23 |
| Pebble crusher power | (kW) | 527 | 572 | 950 | 646 |
| Ball mill ball load | (%) | 33 | 34 | 33 | 34 |
| Ball mill power | (kW) | 16672 | 17600 | 16672 | 17578 |
| Total Power | (kW) | 33133 | 37056 | 36618 | 37942 |
| SAG circuit sp. Power | (kWh/t) | 7.72 | 7.55 | 9.20 | 9.02 |
| Ball mill Sp. Power | (kWh/t) | 8.07 | 7.04 | 8.07 | 8.04 |
| Overall sp. Power | (kWh/t) | 16.05 | 14.82 | 17.73 | 17.36 |
| Operating WI | (kWh/t) | 20.24 | 19.83 | 22.52 | 21.31 |
| A | 65 | 64.9 | 65 | 64.9 | |
| b | 0.581 | 0.58 | 0.581 | 0.58 | |
| ta | 0.5 | 0.23 | 0.6 | 0.23 | |
| Bond ball WI | (kWh/t) | 17.5 | 17.8 | 17.5 | 17.8 |
Note: 1 indicated from on-line size measurement
2 indicated from load cell measurement