



The content on this page was automatically generated from the PDF publication document and may contain errors or inaccuracies. Please refer to the original PDF for the most accurate information.
DEVELOPMENTS IN AG/SAG MILL MODELLING
S.Morrell, W.Valery, G.Banini and S.Latchireddi
JKMRC, Isles Road, Indooroopilly, Qld 4068, Australia e-mail :
ABSTRACT
Arguably the JKMRC's "Variable Rates" ag/sag model is the only one that is widely used in the mineral's processing industry for design, pilot mill scale-up and optimisation. Despite its success it is being continually tested against real plant data and improved through a number of research programmes. The latest of these programs has targeted the ore breakage and slurry transport descriptions of the model as well as the influence of load level on throughput and grind size.
In a parallel programme the dynamic response of ag/sag mills has also been tackled which has lead to the development of a dynamic model. This phenomenological model has attempted to describe the operation of these mills in a physically lifelike manner. Over the last 2 years this model has been tested on-line at a number of operations to determine how well it mimics real plant performance.
This paper describes describes these programmes and the latest results from them.
INTRODUCTION
The so-called "Variable Rates" model has proven to be a reliable model for both design and optimization studies. However, it was recognized that room for improvement existed in each of its 3 key sub-process descriptions viz:
- · Slurry transport
- · Breakage rate relationships
- · Rock breakage characterization
Research programmes were therefore mounted to tackle the identified deficiencies in each of these areas. At the same time the need for a dynamic model of ag and sag mills was also recognized and in a parallel study such a model was developed. In the following sections progress in each of these programmes is described.
SLURRY TRANSPORT
The only literature available on flow through AG/SAG mills is by Moys (1986) and Morrell & Stephenson (1996) who developed models for grate-only discharge assemblies. Both were based on limited data and included only a few variables. The influence of charge volume and pulp lifter specifications, which play a critical role in slurry transport, were not explicitly incorporated in either model. An experimental and modelling program was therefore undertaken to describe the influence of pulp lifters in slurry transport.
Laboratory/Pilot Data
Laboratory and pilot programmes were initially conducted and determined that the equation form suggested by Morrell and Stephenson was appropriate to describe the resultant data. It was found that slurry hold-up ( H p ) was dependent on the open area (OA), grate design (GD), mill speed (CS), flowrate (Q), charge volume (CV) and pulp lifter specifications such as size (PLS), and design (PLD). This can be expressed mathematically as:
$$ H_{p} = k(GD)^{a}(OA)^{b}(CV)^{c}(CS)^{d}Q^{e} $$ (1)
where,
H p = the net fractional slurry hold-up inside the mill
OA = fractional open area CV = fractional charge volume CS = fraction of critical speed
Q = flowrate (m 3 hr-1 ).
GD = grate design in terms of mean relative radial position of
the grate holes
k = coefficient of resistance a,b,c,d,e = model parameters
The value of 'GD' is a weighted radius position which is expressed as a fraction of the mill radius and is calculated using the formula proposed by Morrell & Stevenson (1996).
where,
\( a_i \) = open area of all holes at a radial position \( r_i \)
\( r_{...} \) = radius of mill inside the liners
The parameter values b,c,d and k were found to be functions of pulp lifter design and size and were fitted to experimental data using the equation form:
\( x = x_q - k_x e^{(-PLS)} \)
where,
xg = parameter value for grate-only condition
\( k_x \) = constant for a given pulp lifter design (eg spiral or radial)
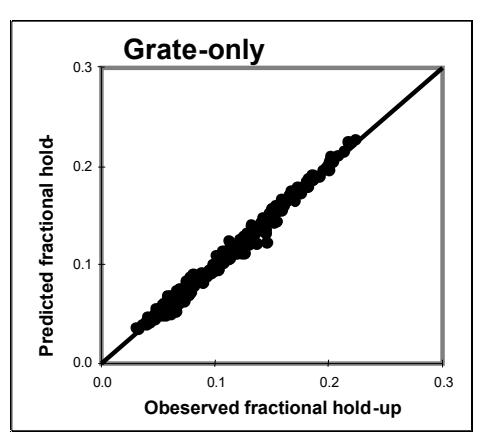
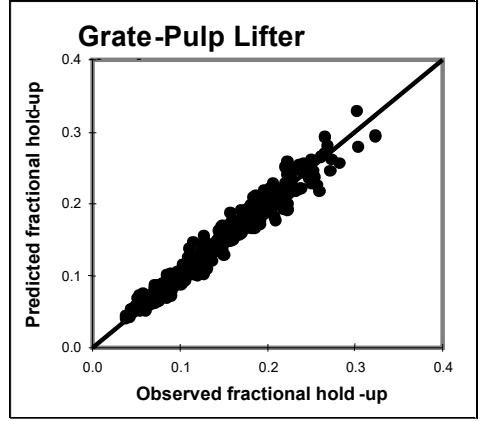
Using data from the 760 laboratory and pilot scale date sets which were generated in the programme, equation 1 was fitted. The results shown in Figures 1and 2 were obtained.
Full Scale Data
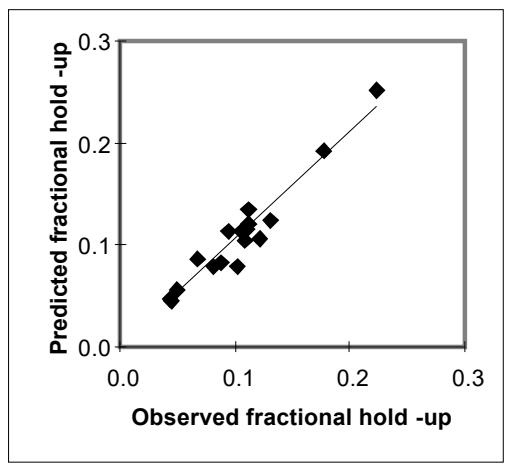
To validate the model equations flowrate and hold-up data from a number of industrial circuits were collected. A total of 21 data sets were obtained. Initially the data from the industrial mills were compared with model predictions using the value of k that was derived from the lab/pilot data. It was found that the model trended well but was offset. This was attributed to the fact that the lab/pilot data was for water whilst the industrial data was related to slurry with much higher viscosities. The parameter k was therefore fitted to the industrial data. Accordingly its mean value was found to increase from 0.04 to 0.053. Using this latter value the observed and predicted results shown in Figure 3 were obtained. It can be seen that results indicate good correlation though there is a degree of scatter. This is due to the (incorrect) assumption, implicit in using a constant k, that all slurries have identical viscous properties. Also the experiment data on mill hold-up were very difficult to obtain and necessitated using a number of assumptions. These undoubtedly resulted in some measurement errors.
BREAKAGE RATES
The current JKMRC model uses the population balance approach for its framework, which results in a throughput response driven by the following first-order rate relationship:
T/hr $$ \alpha $$ r.s.(1-a) (2) r = breakage rate s = rock load mass a = appearance function
The variable rates model has a number of empirical equations which relate the breakage rate to operating conditions such as ball load, ball size and mill speed. However it is independent of the rock load mass and hence the load volume. For a given feed, mill diameter, mill speed, ball diameter and ball load the appearance function (a) is constant as is the breakage rate (r). Therefore, under these conditions the model predicts that throughput is linearly related to the load mass (s).
However, from pilot data and from an increasing number of full scale mills it has become evident that for normal primary crushed feeds throughput does not increase linearly with load mass nor is its maximum necessarily coincident with the load level at which power reaches a maximum ie 45-50%. Typically the load level that maximises throughput falls in the range 20-40% depending on the competence of the ore, whether the circuit is run in open or closed circuit and what the ball charge level is.
Hypotheses on the Cause of the Relationship
The reasons for the observed load-throughput relationship are not clear and at this stage it can only be surmised as to the physics describing the phenomenon. It has been postulated that the variation in height from which the grinding media drop onto the rock charge drives the effect (this is directly related to the energy used to break rocks). This has some merit as charge motion studies indicate that the drop height typically reaches a maximum with a load volume of 25%. However the relationship is very flat ie the change in drop height and hence energy is quite small. With reference to equation 2 the breakage energy is related to the appearance function (a). As a result the term (1-a) reduces as the energy reduces. For the drop height variation to result in the throughput decreasing above about 25% volume, the reduction in the magnitude of (1-a) must be quite large as the load mass term (s) will also be increasing as the volume increases.
Calculations indicate that the drop height variation on its own cannot account for the load-throughput relationship.
As a hypothesis based on input energy could not explain the relationship it was also decided to look at how the energy might be being absorbed and hence utilized by the load for breakage. Out of this came the following hypotheses to describe the causes for loadthroughput relationship:
- · Impact energy is related to the drop height.
- · Impact breakage occurs in a bed at the toe of the charge.
- · The thicker the bed the more the original impact energy is dissipated throughout the bed and is hence attenuated – less breakage will occur.
- · The ability of the bed to transmit the impact energy to a target rock without attenuation depends upon the bed composition. If the bed contains steel balls the bed will be a better transmitter and will attenuate the impact energy less – more breakage will occur.
- · Impact breakage is responsible for breaking down the coarser rocks and hence drives the reduction/accumulation of the load.
- · Attrition breakage occurs within the shearing layers of balls and rocks in the bulk of the charge.
- · More attrition will occur as the volume of the charge increases
- · Attrition breakage influences the breakage of finer particles only.
To test out these hypotheses it was necessary to obtain a relationship between the thickness of the bed at the toe of the charge and the volume occupied by the total charge. To do so the Morrell power model (1996) was used as it has a relationship for the charge thickness as well as the drop height. Figure 1 shows the simplified charge shape used in this
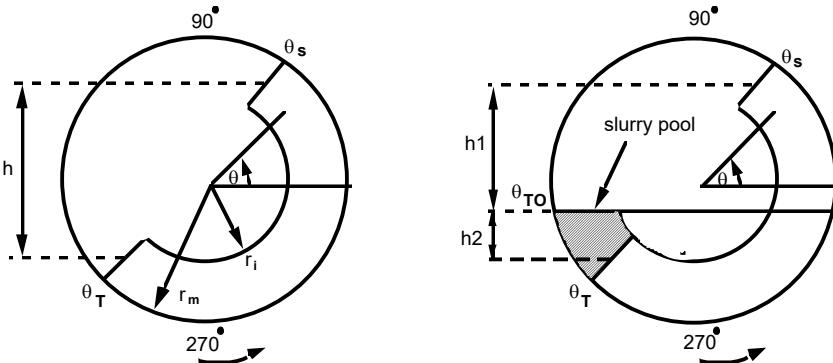
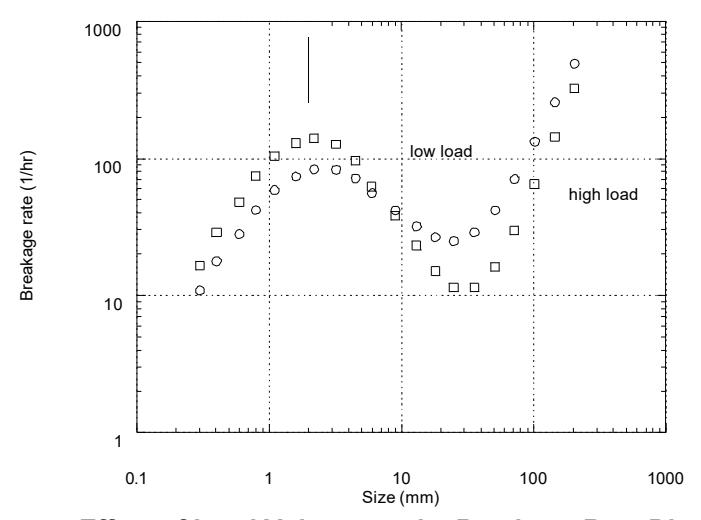
The drop height was calculated from the equations describing the position of the toe and shoulder. This was then normalized with respect to the mill diameter. The bed thickness was calculated from the difference between the mill radius and the so-called charge inner surface radius (ri) and was normalised with respect to the mill radius. To describe the composition of the charge in terms of its ability to absorb energy and use it for breakage an energy utilization factor was calculated based on the ball:rock ratio. The above relationships were then combined to give a load adjustment factor that was applied to the breakage rate distribution.
The effect of this adjustment factor is seen in Figure 5. High loads give rise to a drop in the breakage rates at coarser sizes and a simultaneous increase in the rates at finer sizes
Model Response
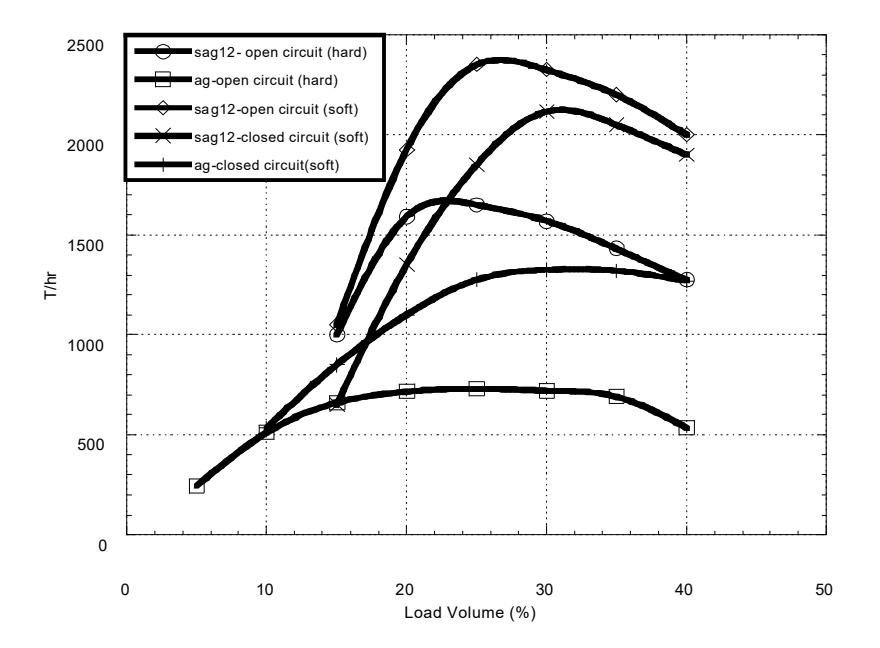
To determine whether the model gave reasonable results a hypothetical ag/sag mill circuit was constructed and run under simulated conditions of varying load volume, ball charge, closing screen size and ore hardness. The resultant load:throughput relationship is shown in Figure 6. It can be seen that the model predicts different responses for each scenario. It suggests that peak throughput occurs at a higher load if the mill is closecircuited with a fine classifier. It also indicates that a harder ore should be run with a lower load if peak throughput is required. Both these trends have been observed in practice.
ROCK BREAKAGE CHARACTERISATION
The thrust in the rock breakage characterisation work has been in describing the relationship between the size of a rock and its breakage characteristics as well as its response when it is exposed to energies that are not big enough to fracture. Such low energies, although not sufficient to break the rock, result in chipping or abrading away the rock surface.
Dependence of Impact Breakage Characteristics on Rock Size
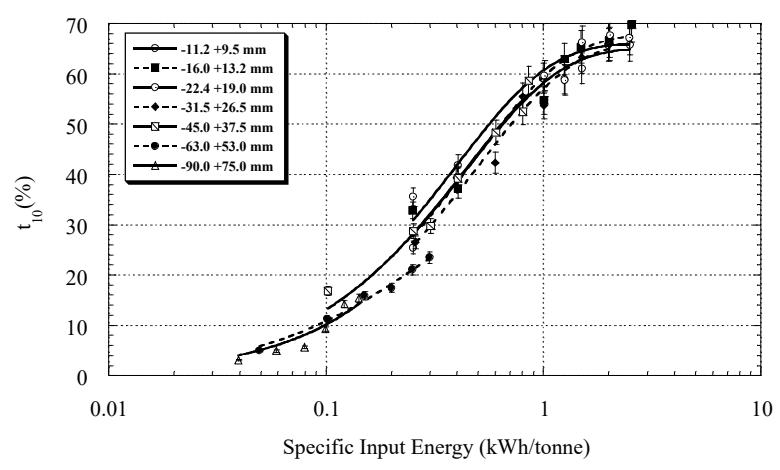
Earlier studies of rock breakage at the JKMRC using a limited range of energies and rock sizes concluded that, for a constant input of specific energy, rock breakage characteristics were largely independent of rock size. Such a response would give rise to the results shown in Figure 7, which shows the relationship between the t10 parameter (Narayanan and Whiten, 1988) and specific energy. More extensive studies using a much wider energy and rock size range have indicated that it is more usual to see a breakage characterization pattern related to rock size. In these cases results similar to those shown in Figure 8 are encountered.
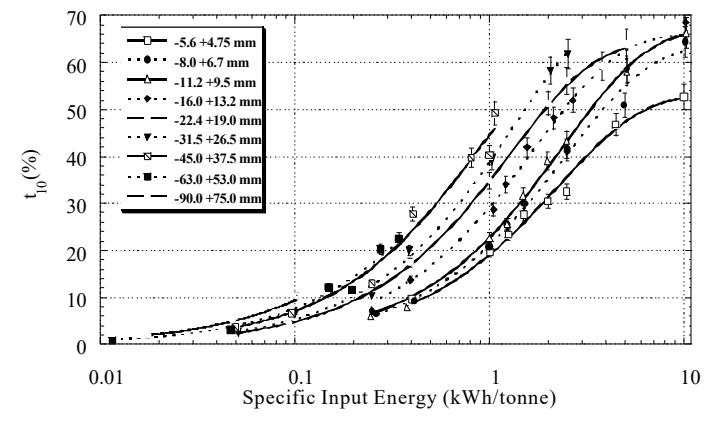
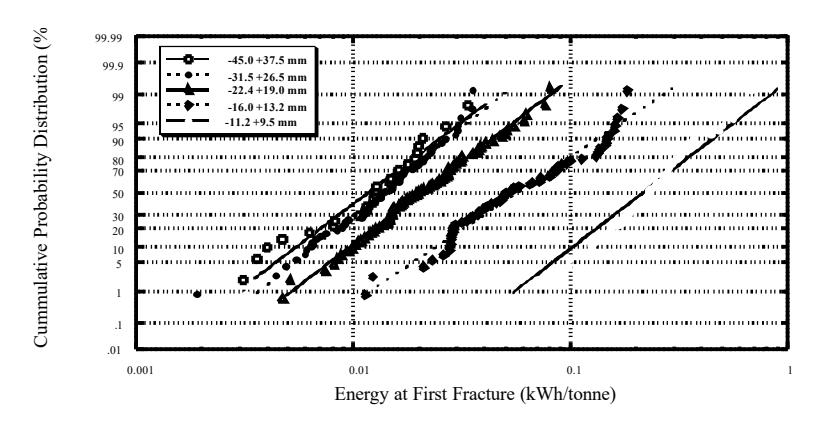
The data in Figure 8 are indicative of a material whose strength increases with decreasing rock size. To confirm this a Hopkinson Bar was used to accurately measure the specific energy required to drive the first fracture through each rock in a range of rock sizes. The results are shown in Figure 9. They clearly show that rock strength increases with decreasing size. This size dependence was modelled using the following equation:
$$ t_{10} = 100 * \left( 1 - \left( \frac{1}{1 + \left( \frac{\ln(Ecs + 1)}{\alpha_{\infty}^{-1} S^{-0.5}} \right)^{\beta_{m}}} \right) \right) $$ (3)
where:
t10 = % passing one tenth the size of the original particle
S = particle diameter
\( \beta_m \) = shape of the t10-Ecs curve
\( \alpha \) = strength parameter
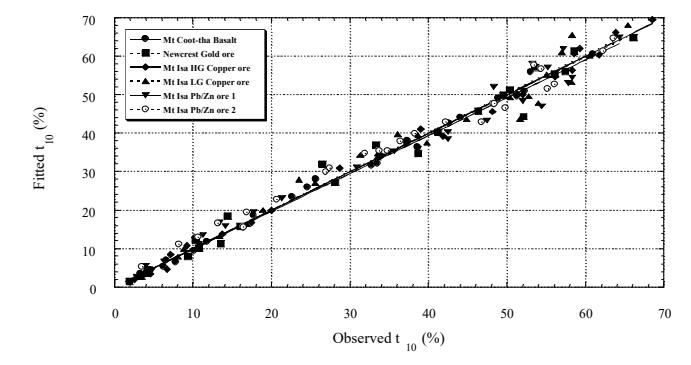
From testing a wide range of rock types equation 3 was evaluated and found to give a good representation of breakage characteristics as shown in Figure 10.
Abrasion and Chipping
The different nature of abrasion and chipping to impact breakage lead the research programme to take a slightly different approach in describing its breakage characteristics. Rather that look at the entire distribution after the application of the breakage energy it was decided to consider only the mass broken off the rock surface and its size distribution. This mass was normalized wrt to the original rock mass to give a "mass fraction".
In view of the fact that abrasion and chipping is a surface phenomenon it wa considereds not relevant to relate the mass fraction to <u>mass</u> specific comminution energy. Using this would imply a volumetric breakage mechanism as in crushing. Hence in choosing a model, the effect of the surface area of the rock was considered. The value of this approach is illustrated in Figure 11.
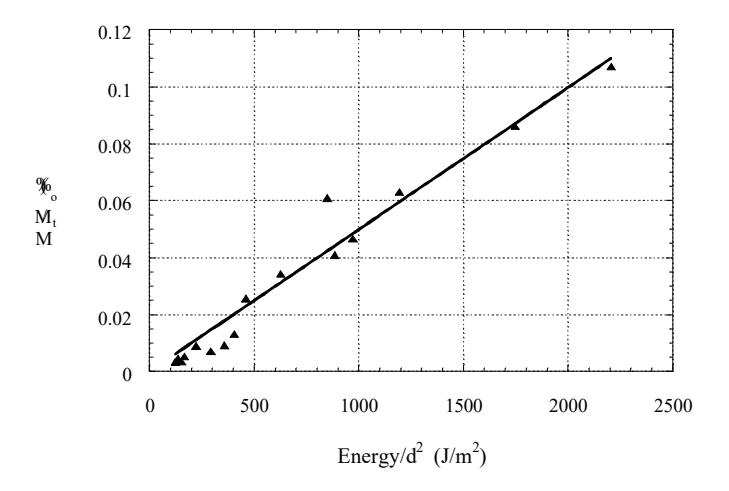
Figure 11 shows the mass fraction produced versus surface area specific comminution energy. This linear plot contains data from a range of rock sizes and hence is easily described mathematically.
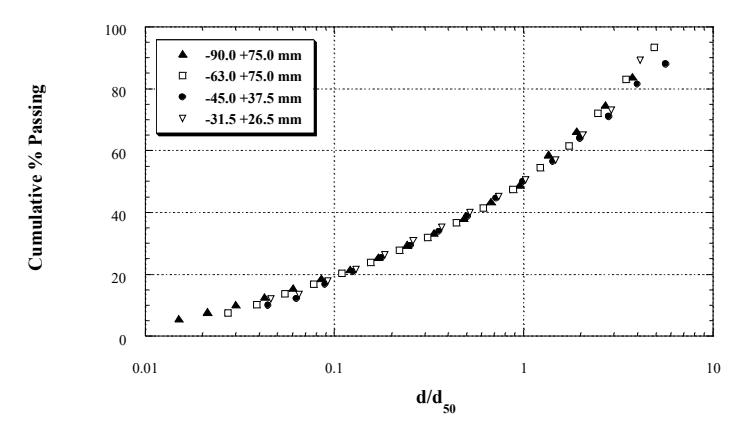
On examination of the size distributions of the broken products it was found that they were largely self-similar and for a given rock type could be described by a single master curve as seen in Figure 12. In this case the distributions were normalised with respect to the 50% passing size \( (d_{50}) \) .
DYNAMIC MODELLING
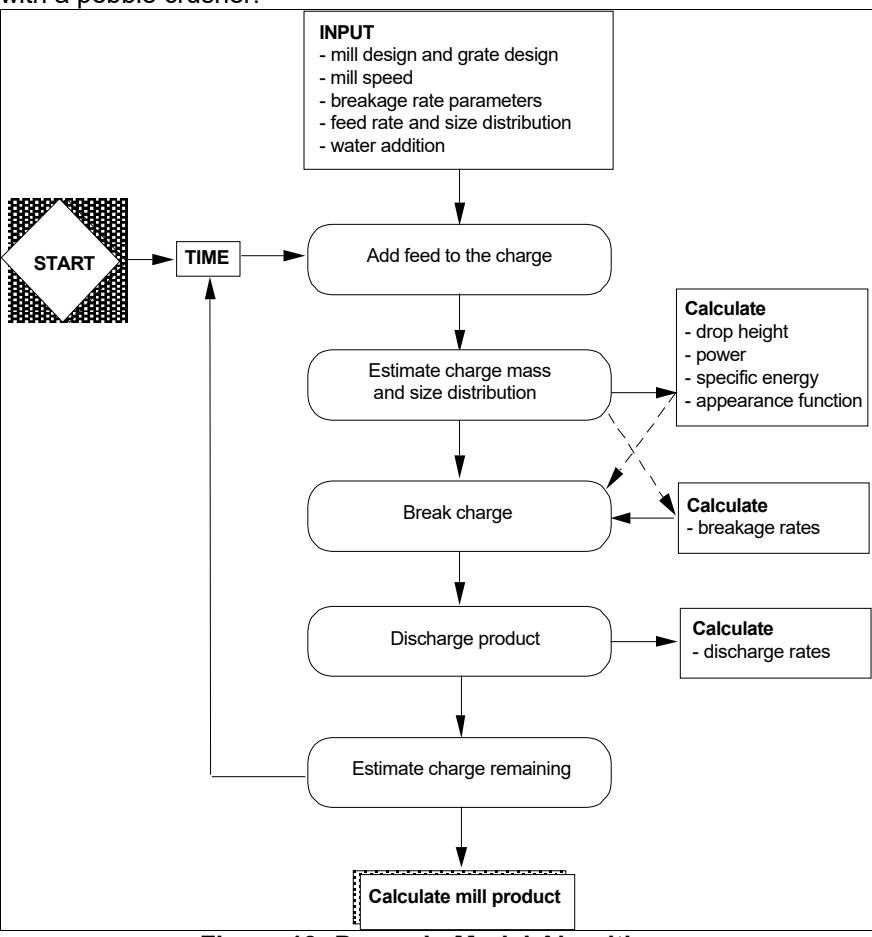
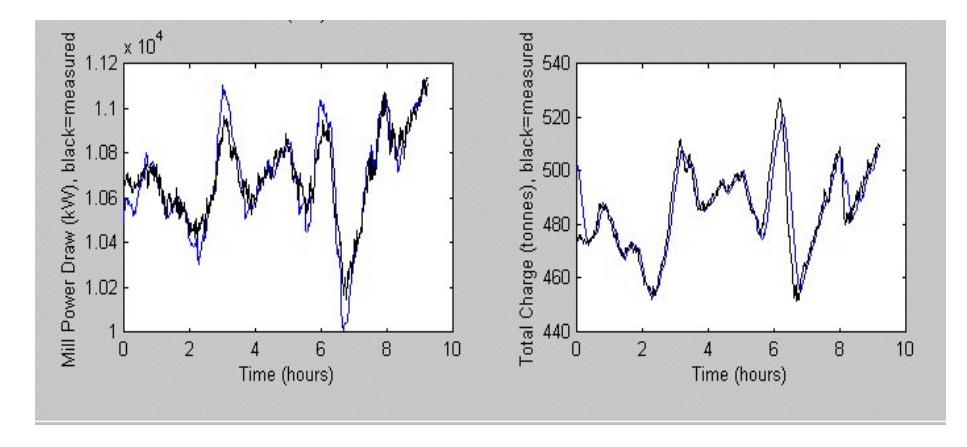
In a parallel programme to the research described in earlier sections a dynamic model was developed. A population balance model structure lies at its heart. The computer-based algorithm outlined in schematic form in Figure 13 illustrates how it operates. For every revolution of the mill a small time interval ( \( \Delta t \) ) is used to make incremental changes in the load as dictated by the quantity of new feed entering the mill and ground product leaving. Breakage and discharge are described using equations similar to those in the steady-state model. However, an additional refinement is that the breakage rates are determined from the mill load size distribution providing a more interactive response. To calibrate the model only a steady-state survey is required to fit its breakage rate parameters. The model is then subsequently able to reproduce the dynamic response of the mill due to its mechanistic/phenomenological structure. The model has been trialed at a number of sites using on-line data. Required on-line inputs are feedrate, water addition, mill speed and feed size distribution. The latter is particularly important and can be provided by a good image analysis system. Although the model shows all of the responses normally observed in practice, even small inaccuracies in its operation, combined with imprecision in the on-line inputs and lack of information on feed hardness variation, results in the model progressively diverging from observed trends over time. To correct this an adaptation routine using a Kalman filter is required. By utilising such a routine the model is continually "tuned" using on line data. As a result the model is able to closely mimic the true performance of the mill. Figure 14 illustrates how closely the model is able to do this. The data shown (power draw and load mass) are from a large diameter sag mill in closed circuit with a pebble crusher.
CONCLUSIONS
Over the last 5 years ag/sag mill research at the JKMRC has concentrated on improving the description of the main sub-processes that combine to describe the overall performance of these mills. Programmes have therefore been carried out to better describe:
- · the role of the pulp lifters and the influence of their size and design on slurry hold up
- · the relationship between rock strength and rock size
- · the characteristics of size reduction through low energy abrasion and chipping
- · the interaction between load level and throughput
In addition a dynamic model has been developed with a life-like structure that is proving to be able to accurately mimic on-line response of ag/sag mills.
ACKNOWLEDGEMENTS
The authors would like to thank the sponsors of the AMIRA P9 Mineral Processing project for their financial support of some of the work reported in this paper and permission to publish it.
REFERENCES
MORRELL, S. & STEPHENSON, I. 1996. Slurry discharge capacity of autogenous and semi-autogenous mills and the effect of grate design. Int J Mineral Processing, Vol 46, pp53-72.
Moys, M.H., 1986. The effect of grate design on the behaviour of grate discharge mills, Int J Mineral Processing , 18 : 85-105 NARAYANAN, S.S & WHITEN, W.J.1988. Determination of comminution characteristics from single particle breakage tests and its application to ball mill scale-up. Trans. Inst. Min. Metall , 97