



The content on this page was automatically generated from the PDF publication document and may contain errors or inaccuracies. Please refer to the original PDF for the most accurate information.
GLOBAL TRENDS IN ORE HARDNESS
*Stephen Morrell
SMC Testing Pty Ltd 220 Tinarra Crescent Kenmore Hills Australia 4069 (*Corresponding author:
ABSTRACT
The SMC Test® has become one of the most popular laboratory tests for determining the ore hardness from an AG/SAG, HPGR and Crusher perspective. To date over 35,000 tests have been conducted. These tests cover over 1,300 different ore bodies. Significantly these deposits are distributed globally across every continent, including over 82 different countries and over 30 different commodities. This paper describes this huge data base and looks at trends associated with geographical location and mineral species.
KEYWORDS
Geometallurgy, hardness testing
INTRODUCTION
As the main subject of this paper concerns global trends in comminution circuit feed ore hardness using SMC Test® parameters, it is first appropriate to establish that these parameters are relevant in the first instance as accurate indicators of hardness.
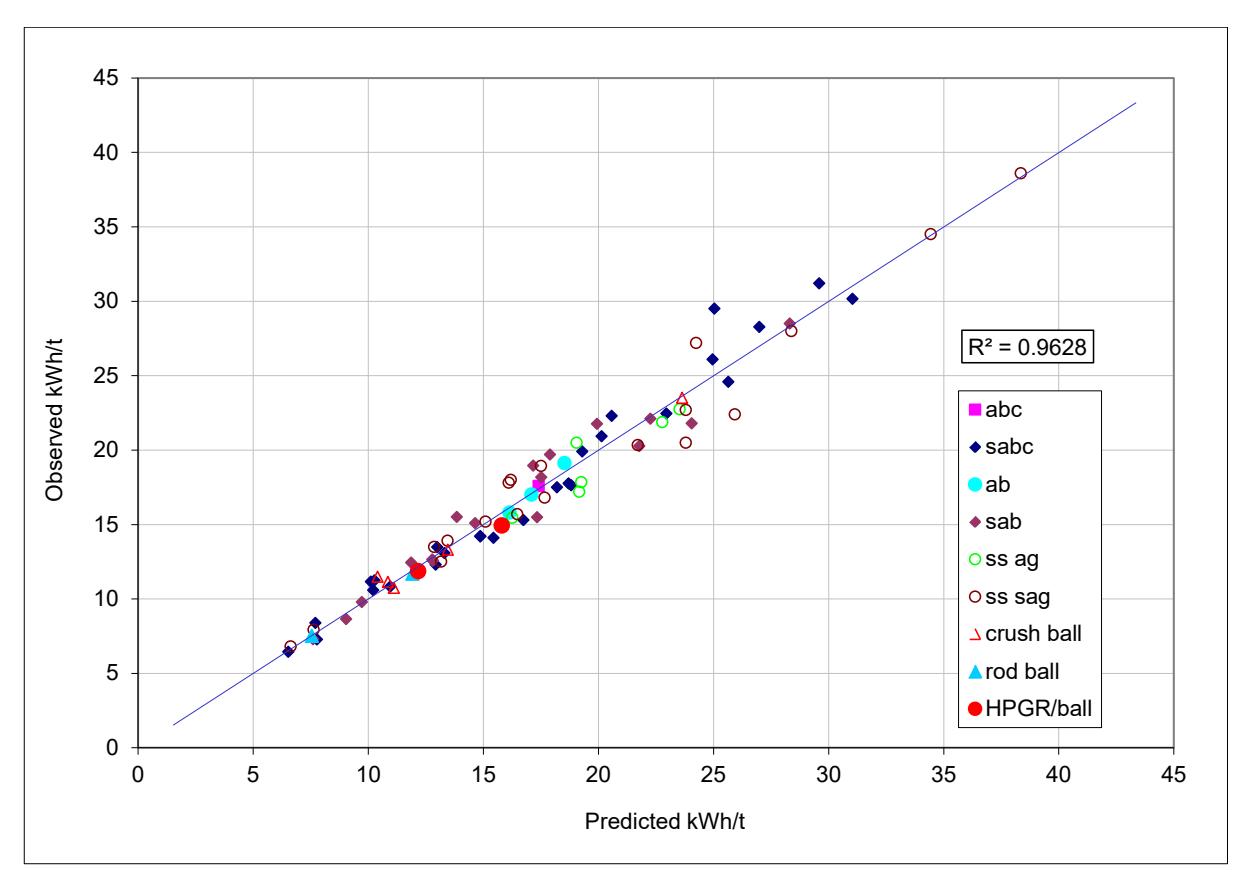
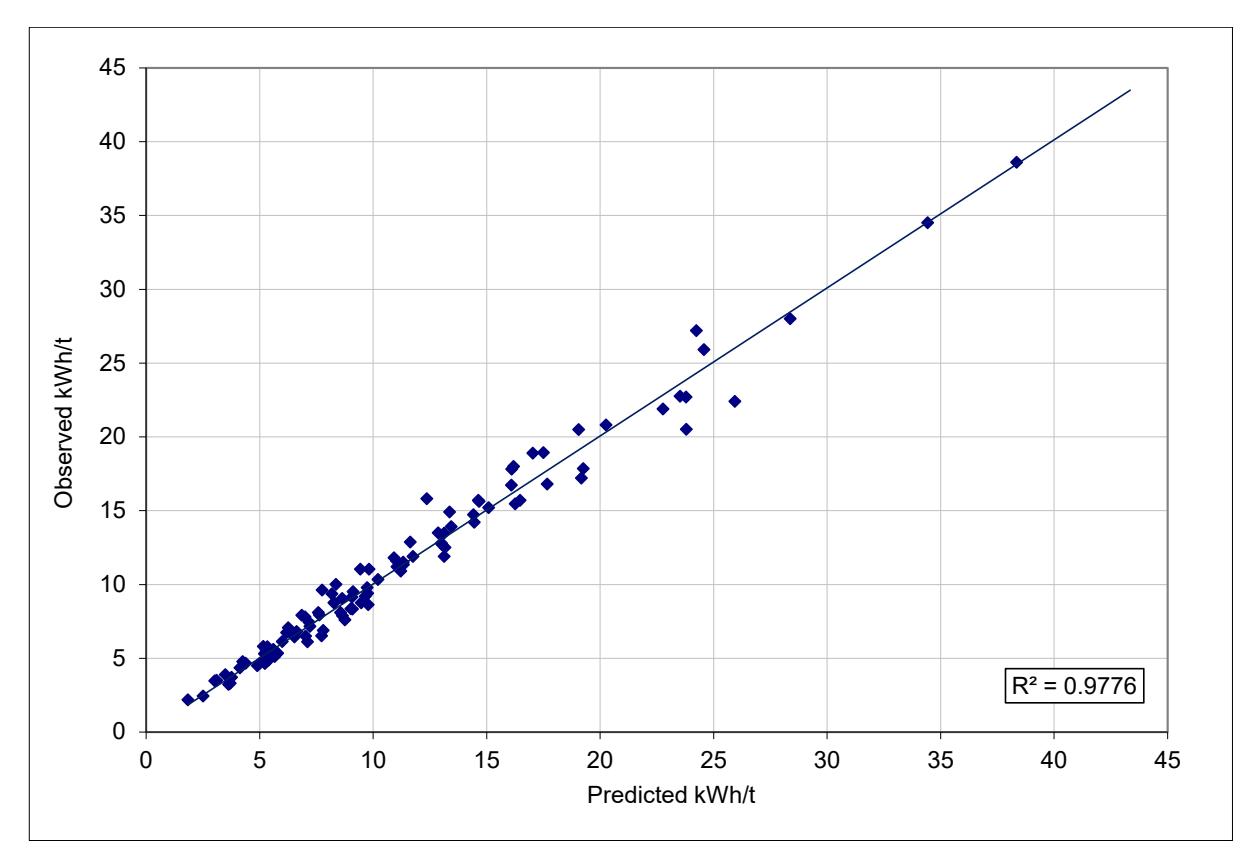
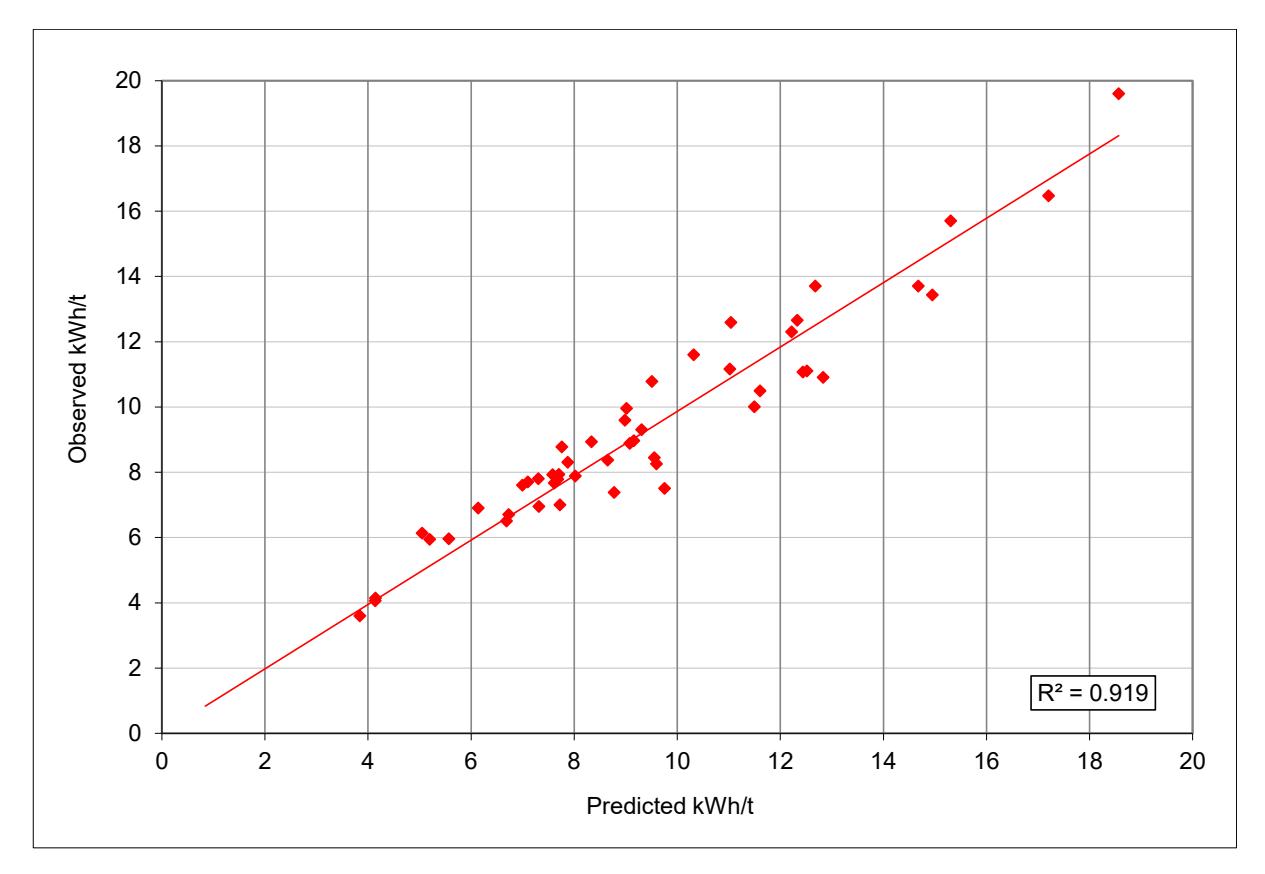
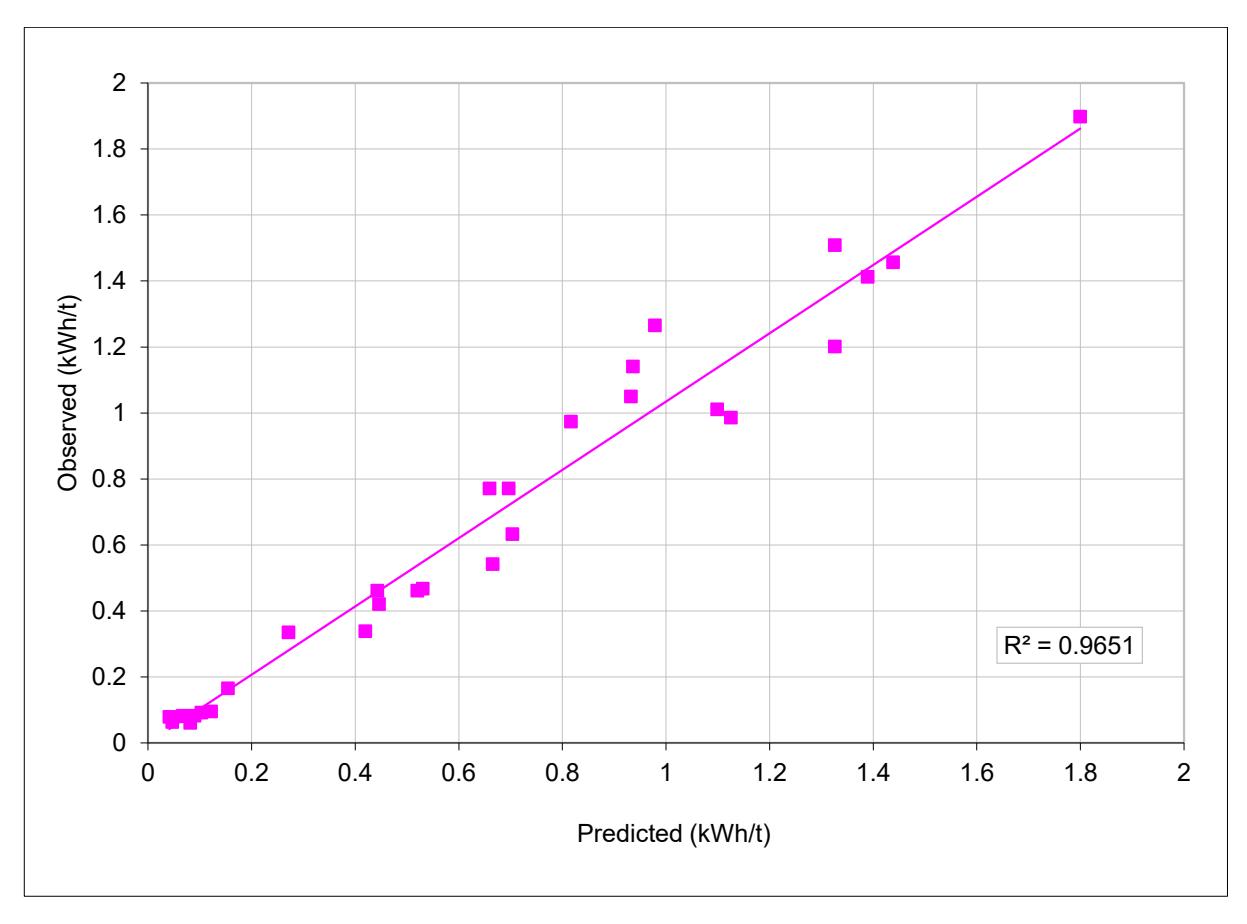
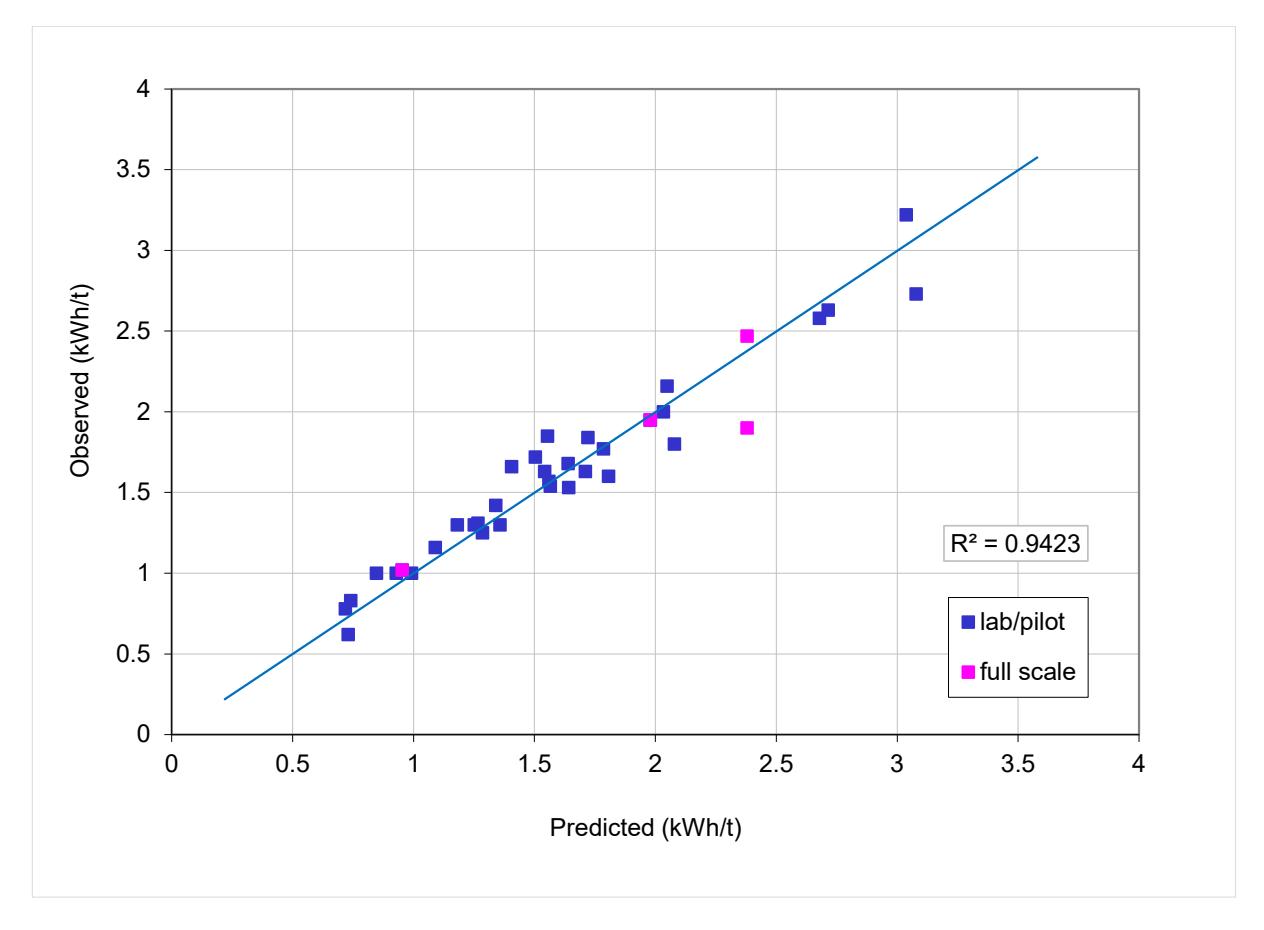
The SMC Test® was developed by Steve Morrell and was commercialised via the company, SMC Testing Pty Ltd, in 2004. The "SMC" acronym stands for S teve M orrell C omminution (not SAG Mill Comminution as appears in some literature). Since its inception in 2004 it has become the most popular and versatile laboratory ore hardness test in the world, with over 35,000 tests having been completed to date, covering over 1300 different ore bodies. It is routinely used in design, optimisation and ore body profiling projects. The test is unique in that from relatively small amounts of drill core it provides work indices that are used in power-based equations for predicting the specific energy of AG/SAG mill circuits (DWi parameter), conventional crushing circuits (Mic parameter), HPGR circuits (Mih parameter) and in combination with the Bond ball mill work index test, the total comminution circuit (Mia, Mib parameters) and ball mill circuit (Mib parameter) as well as providing parameters for simulation modelling of AG/SAG and crushing circuits (A,b and ta) (Morrell 2004, 2008, 2009, 2010). Its popularity has been driven by the fact that the test and its associated equations have been validated through benchmarking using 186 data sets from 117 different circuits which cover the full range of ore types, circuit types and equipment sizes, as seen in Tables 1 and 2. The high degree of predictive accuracy that is provided is illustrated in Figures 1-5 which show the observed and predicted specific energies of the total comminution circuit, AG/SAG mill, ball mill, crushing and HPGR circuits respectively from these benchmarking exercises. This success has led many leading engineering companies, equipment suppliers and mining companies to use the SMC Test® as a standard for design, optimisation and geometallurgical modelling of comminution circuits (Alruiza et al., 2009; Buckingham et al., 2011; Festa et al, 2015; Lane et al 2013; Wang et al., 2015; Wirfiyata & McCaffery, 2011).
| Circuits | Data sets |
| Primary crushing | 7 |
| Secondary/tertiary crushing | 17 |
| Pebble crushing | 7 |
| Open/closed circuit HPGR | 37 |
| Rod/ball mill | 2 |
| Crush/ball mill | 5 |
| Crush/HPGR/ball mill | 2 |
| Single stage AG | 8 |
| Single stage SAG 1o crush | 15 |
| Single stage SAG 2o crush | 2 |
| AB | 5 |
| ABC-A | 7 |
| ABC-B | 2 |
| SAB 1o crush | 30 |
| SAB 2o crush | 3 |
| SABC-A 1o crush | 30 |
| SABC-A 2o crush | 3 |
| SABC-B | 4 |
| Total benchmarking data sets | 186 |
| Parameter | Units | max | min |
| Ore characteristics | |||
| DWi | kWh/m3 | 14.2 | 1.7 |
| Bond ball Wi | kWh/tonne | 26 | 6 |
| JK A*b | 182 | 20 | |
| sg | 4.63 | 2.45 | |
| AG/SAG mill circuits | |||
| F80 | mm | 212 | 19.4 |
| T80 | microns | 7770 | 140 |
| P80 (single stage mills only) | microns | 415 | 60 |
| Diameter inside shell | ft | 40 | 6 |
| Length (EGL) | ft | 31 | 2 |
| Ball load | % | 25 | 0 |
| Speed | % crit | 90 | 58 |
| Length/Diameter ratio | 2.0 | 0.3 | |
| Ball mill circuits | |||
| P80 | microns | 257 | 45 |
| Diameter inside shell | ft | 26 | 10 |
| Length (EGL) | ft | 40.5 | 13 |
| Ball load | % | 45 | 20 |
| Speed | % crit | 82 | 67 |
| Length/Diameter ratio | 2.0 | 1.0 |
DATA BASE ANALYSIS
Countries and Commodities
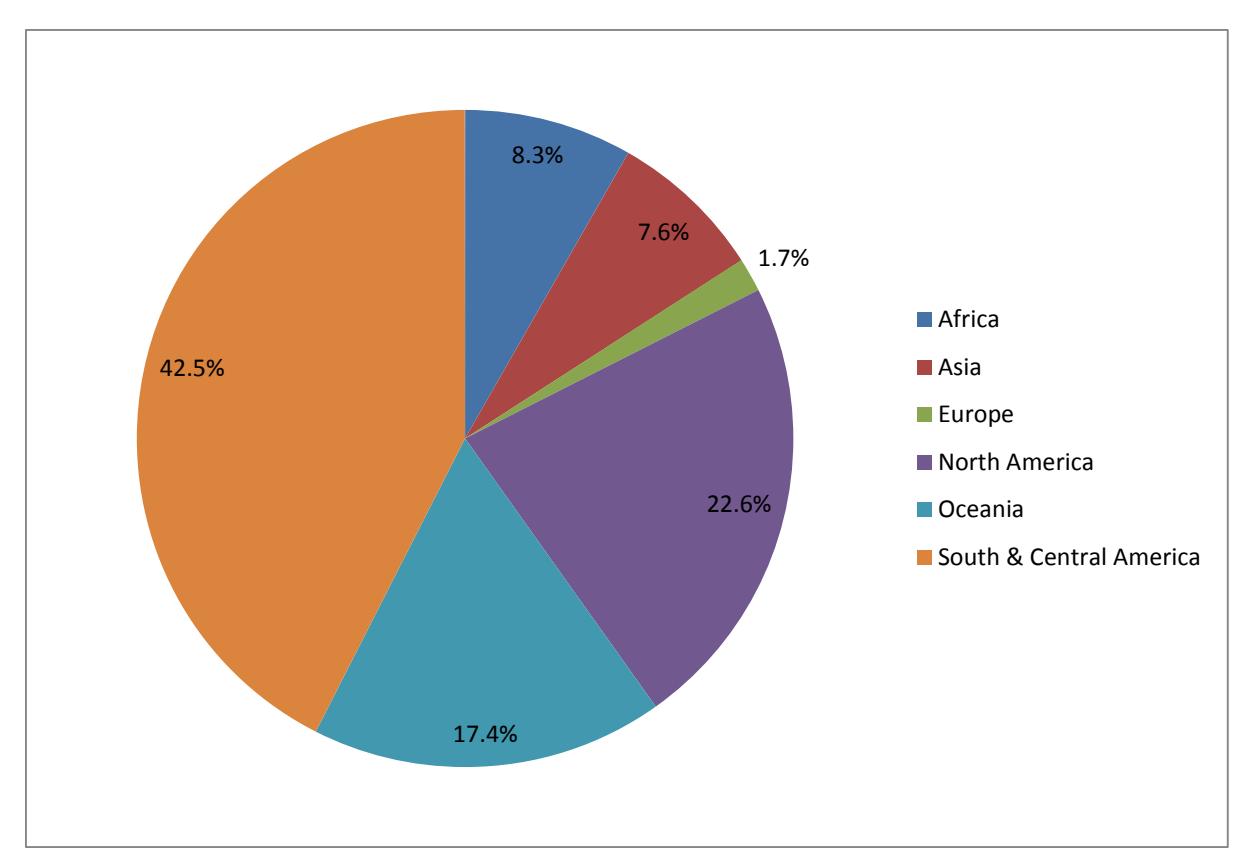
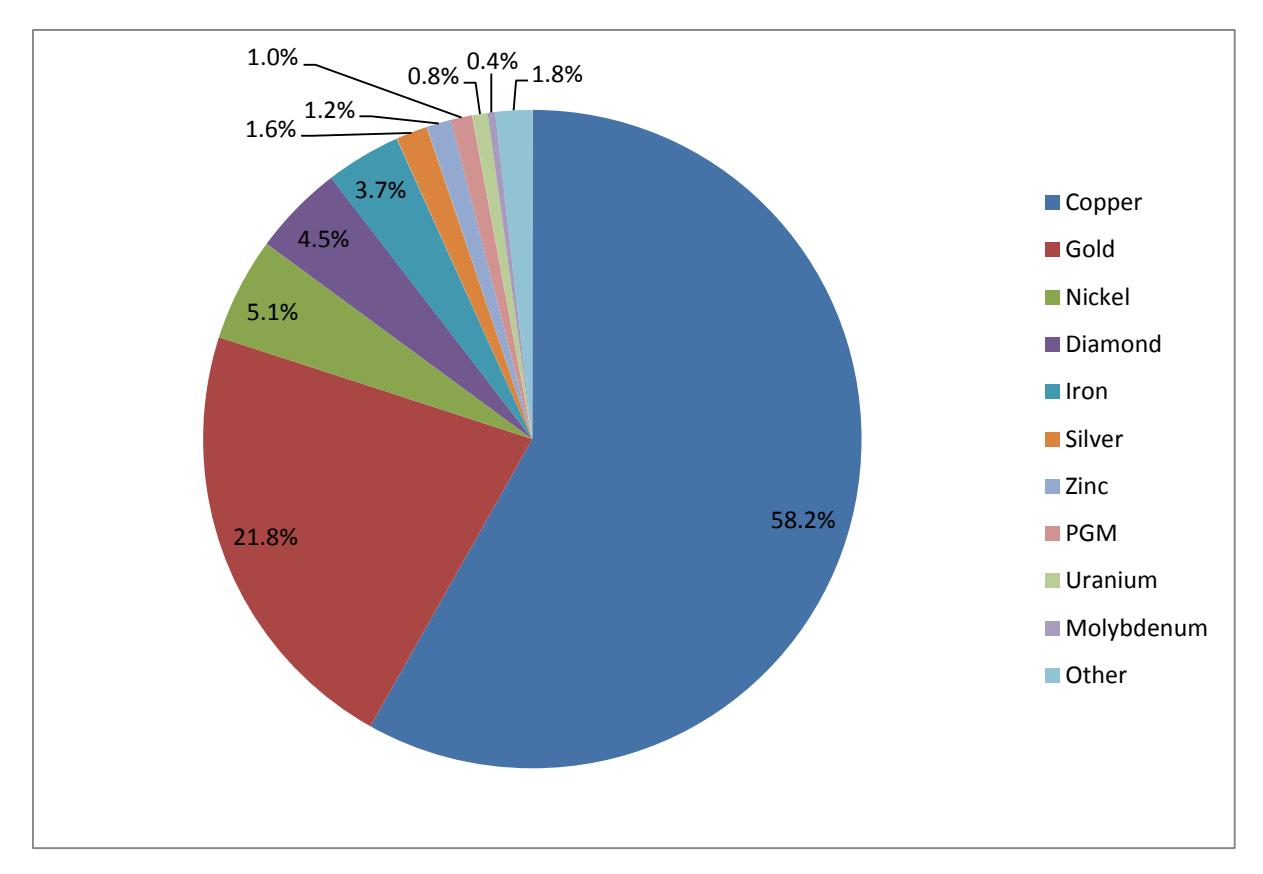
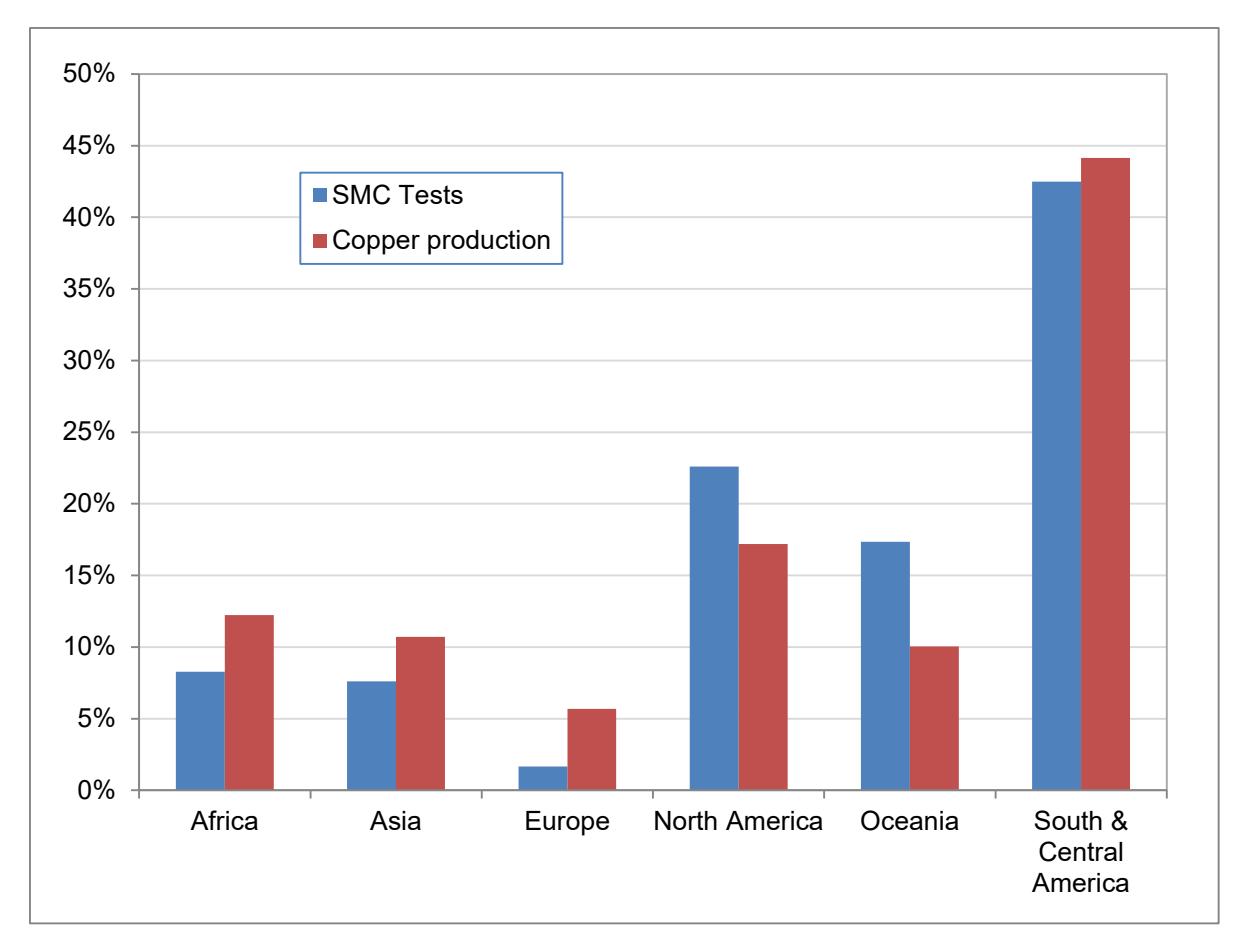
Having established the accuracy of the SMC Test® parameters from a comminution perspective, observed differences in these parameters across geographical boundaries and between commodities can now be reviewed in the light of their statistically significant relevance. To date over 35000 SMC Tests have been conducted. Samples have come from 82 different countries, a list of which is given in Appendix 1. Commodities covered are listed in Appendix 2 and number a total of 30. It should be noted that in classifying each test the primary commodity has been recorded, though in many cases ores contain a number of commodities eg Copper/Gold, Lead/Zinc etc. If the data are grouped geographically then the distribution between continents is as shown in Figure 6. South and Central America dominate the distribution, accounting for almost 43% of total tests, with North America and Oceania accounting for 23% and 17% respectively. The commodity distribution is shown in Figure 7 and indicates that copper ore tests alone account for 58% with gold accounting for 22%. Considering the trends in both these figures, it is perhaps not surprising that South and Central America account for such a large percentage of tests given the importance of this continent in terms of copper production. This is illustrated in Figure 8, which compares relative copper production by continent with the relative number of SMC Tests. As can be seen a close correspondence is seen and to a large extent reflects the supposition that the number of ore characterisation tests should be proportional to the size of ore deposits.
HARDNESS ANALYSIS
Overall
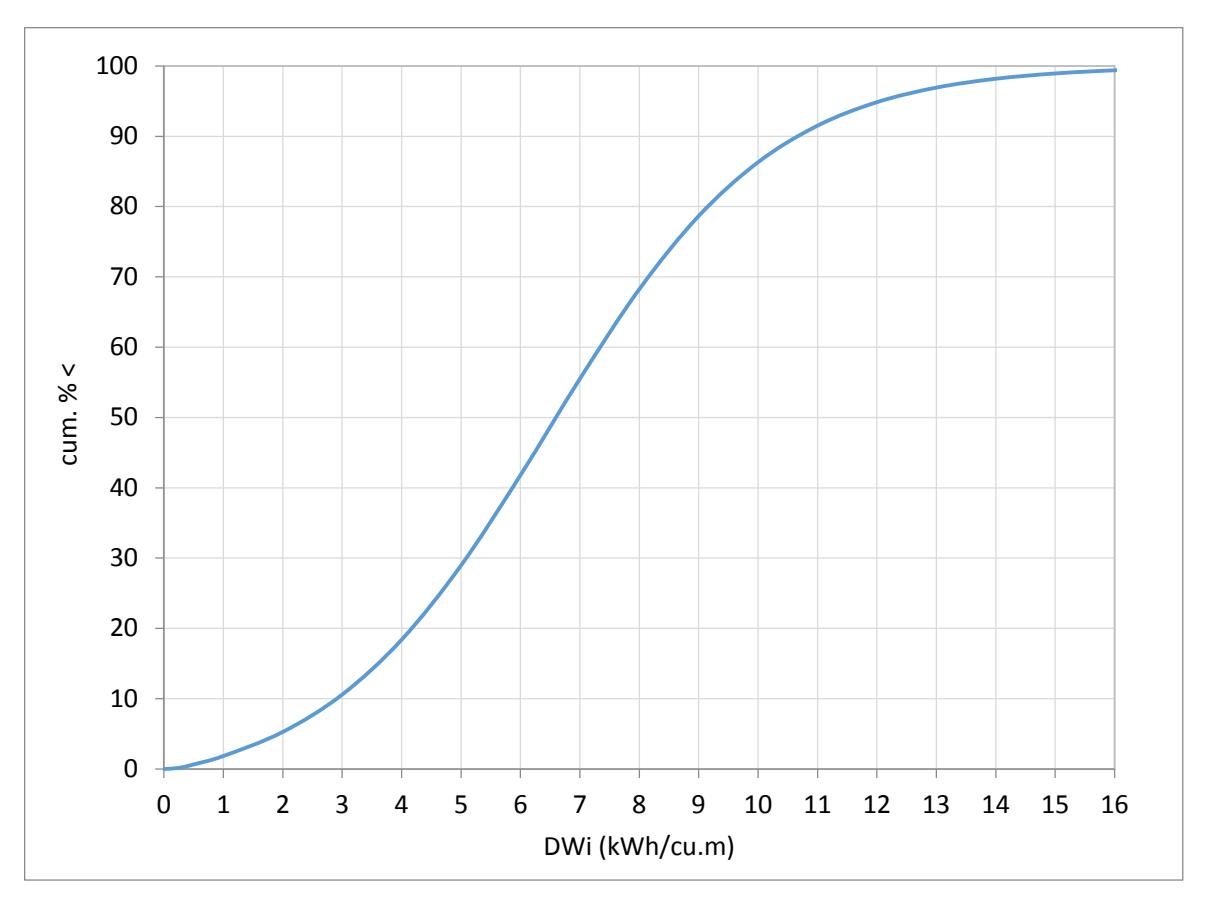
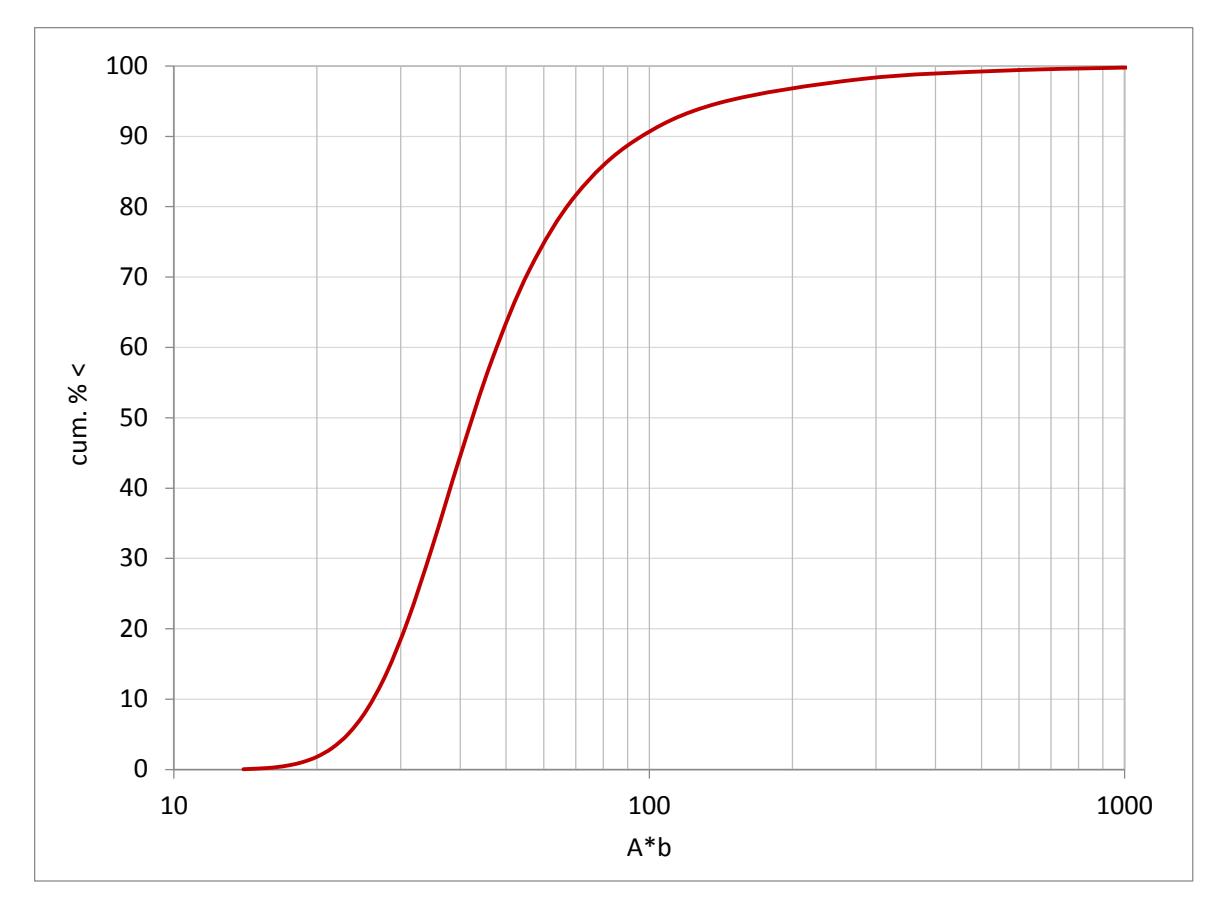
Given that the main subject of the conference is AG/SAG milling the hardness analyses mainly concentrate on statistics associated with the DWi parameter as it is this parameter that is used to predict AG/SAG circuit performance. Figure 8 shows the cumulative distribution of the DWi, using the 35000+ tests carried out to date. The minimum value is 0.15 kWh/m³ and the maximum value is 22 kWh/m³. The 50th percentile value is 6.6 kWh/m³. The JK A*b parameter is also provided by the SMC Test® and although is not used directly in power-based equations to predict AG/SAG performance it is used in simulations and does provide a qualitative indication of ore hardness. Remembering that high values of A*b indicate a soft ore, the cumulative distribution is shown in Figure 9. The minimum value is 9.4, the maximum value is 1320 and the 50th percentile is 43. Note that in Figure 9 the x-axis has been represented in logarithmic space. This is because the variation in hardness with A*b is distinctly non-linear. As a result plotting the values in logarithmic space helps view the distribution more clearly.
Commodities
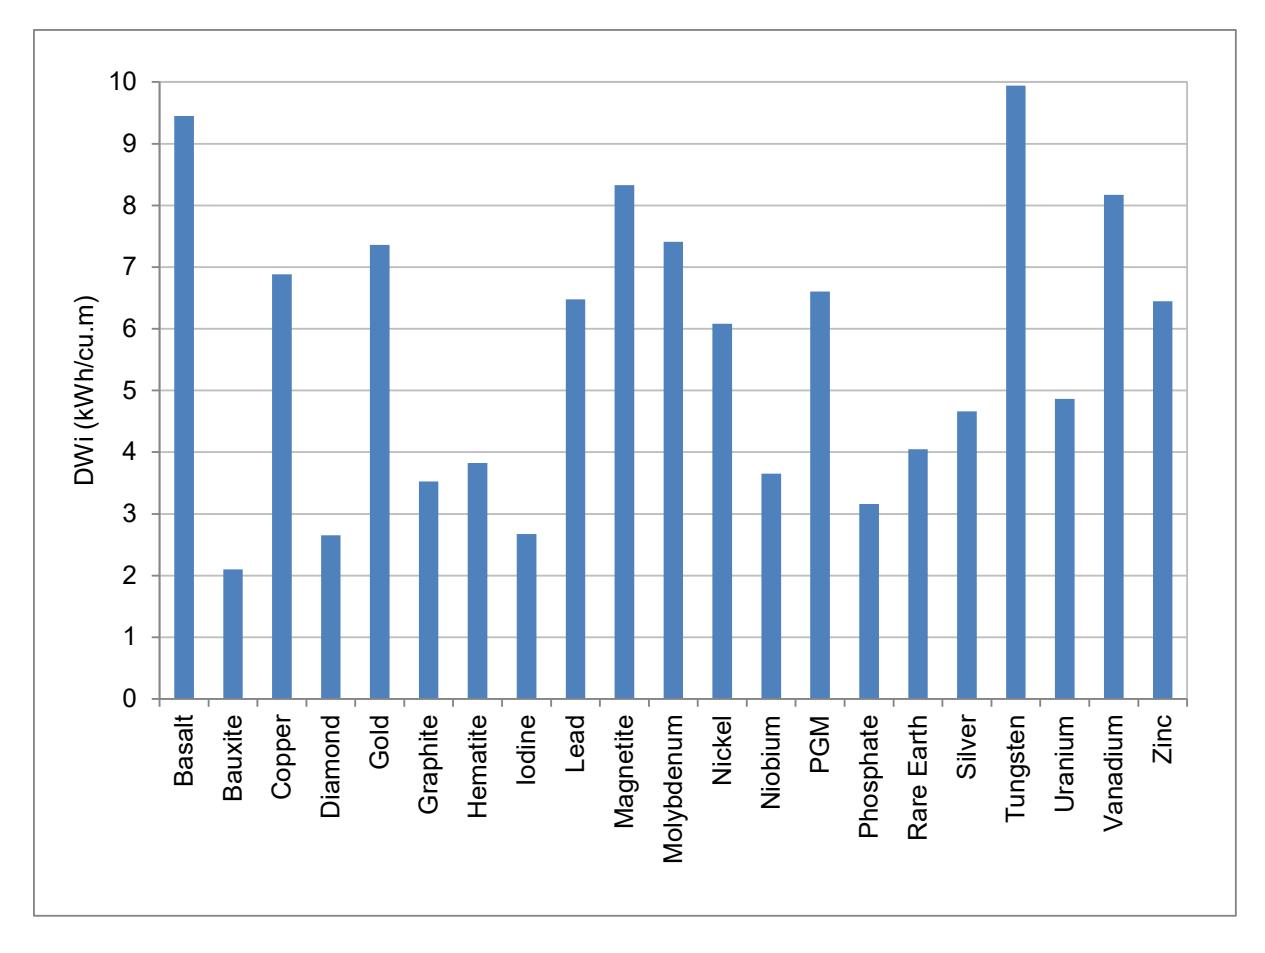
The mean DWi values by commodity are given in histogram form in Figure 10. Only commodities that account individually for more than 0.1% of total numbers of SMC Tests have been included. As can be seen there is a very large variation between commodities, with Tungsten ore topping the list with a mean DWi of almost \( 10 \text{ kWh/m}^3 \) and bauxite being the softest with a mean value of almost \( 2 \text{ kWh/m}^3 \) . Of note is the interesting difference between Hematitic and Magnetitic iron ores, which indicate that, on average, the former is much softer than the latter and that the sg of Hematite ores is higher (3.75) than that of Magnetite ores (3.4). This is probably due to the fact that Hematite ores tend to have a higher iron grade than Magnetite ores and hence tend to be denser.
Geographical
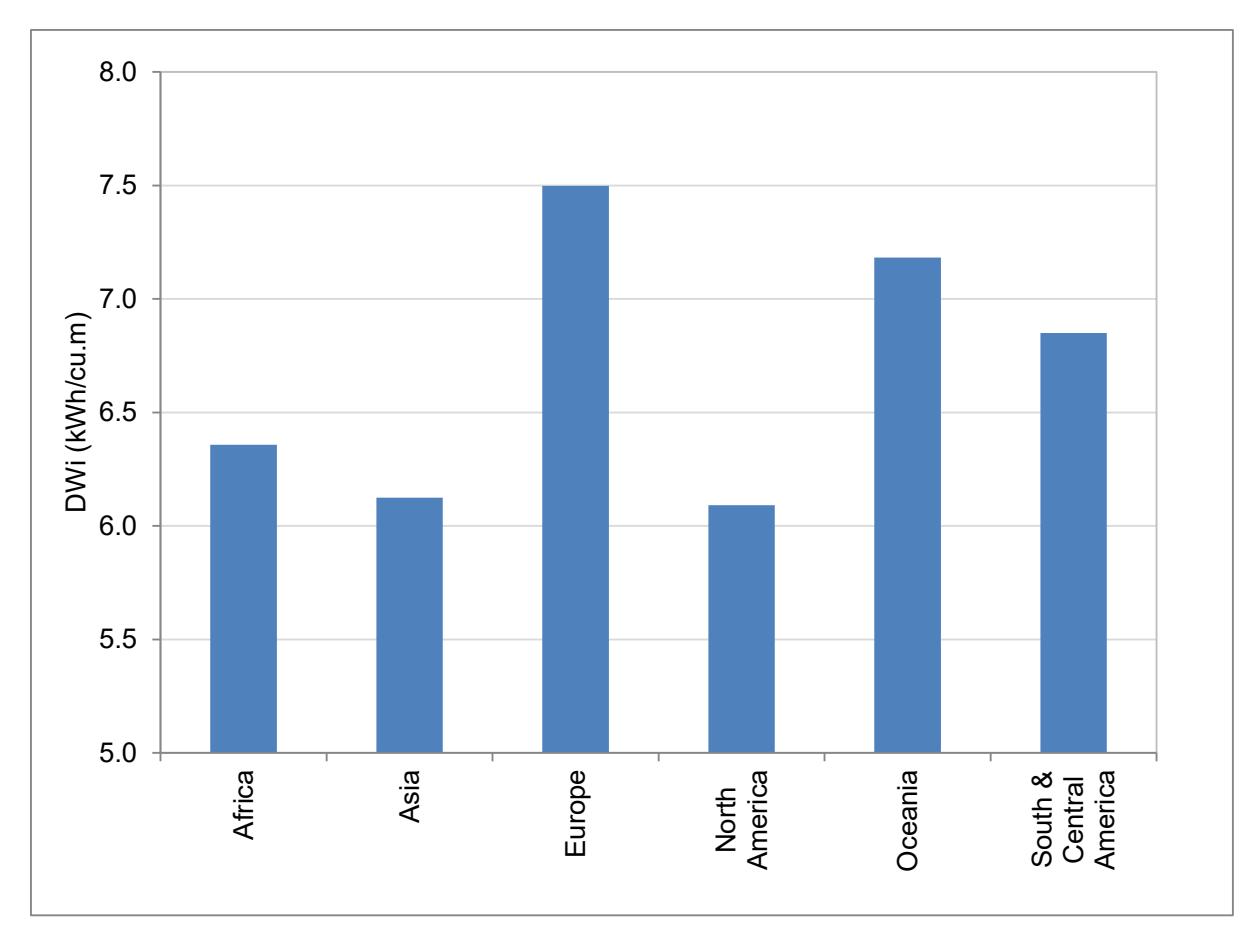
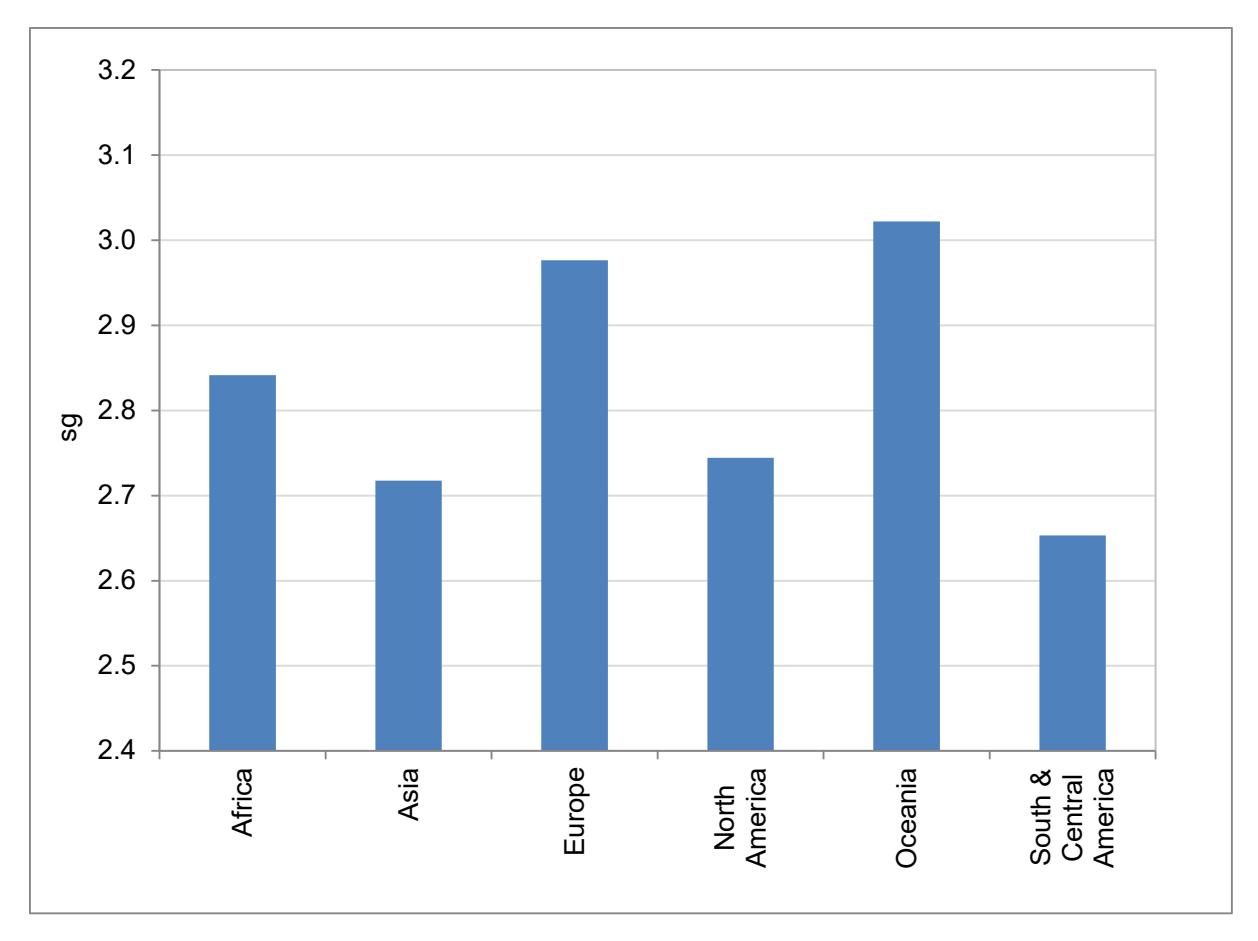
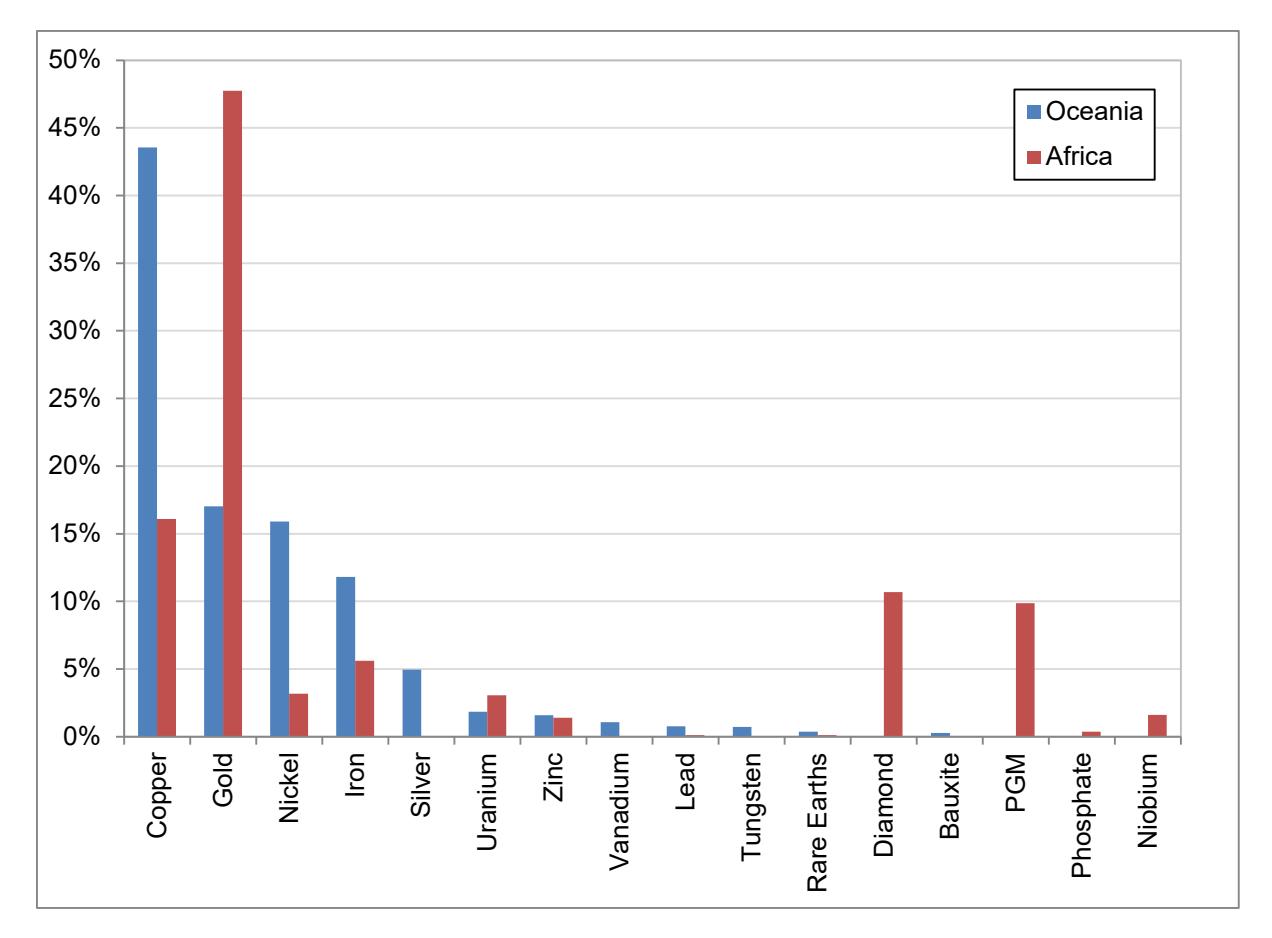
The mean DWi by continent is shown in Figure 11 and shows that on average the ores tested from Asia and North America are relatively soft, whereas those from Europe and Oceania are relatively hard. Interestingly a similar pattern is seen when the sg of the ores are also calculated on a continent-bycontinent basis (Figure 12). Change in ore sg is often overlooked by Minerals Processors as an excellent indicator in many cases of changes in ore types. Hence the differences in Figure 11 are a reflection of the different make up of ores in each continent. Figure 12 illustrates this very well by comparing the distribution of tests by commodity between Africa and Oceania
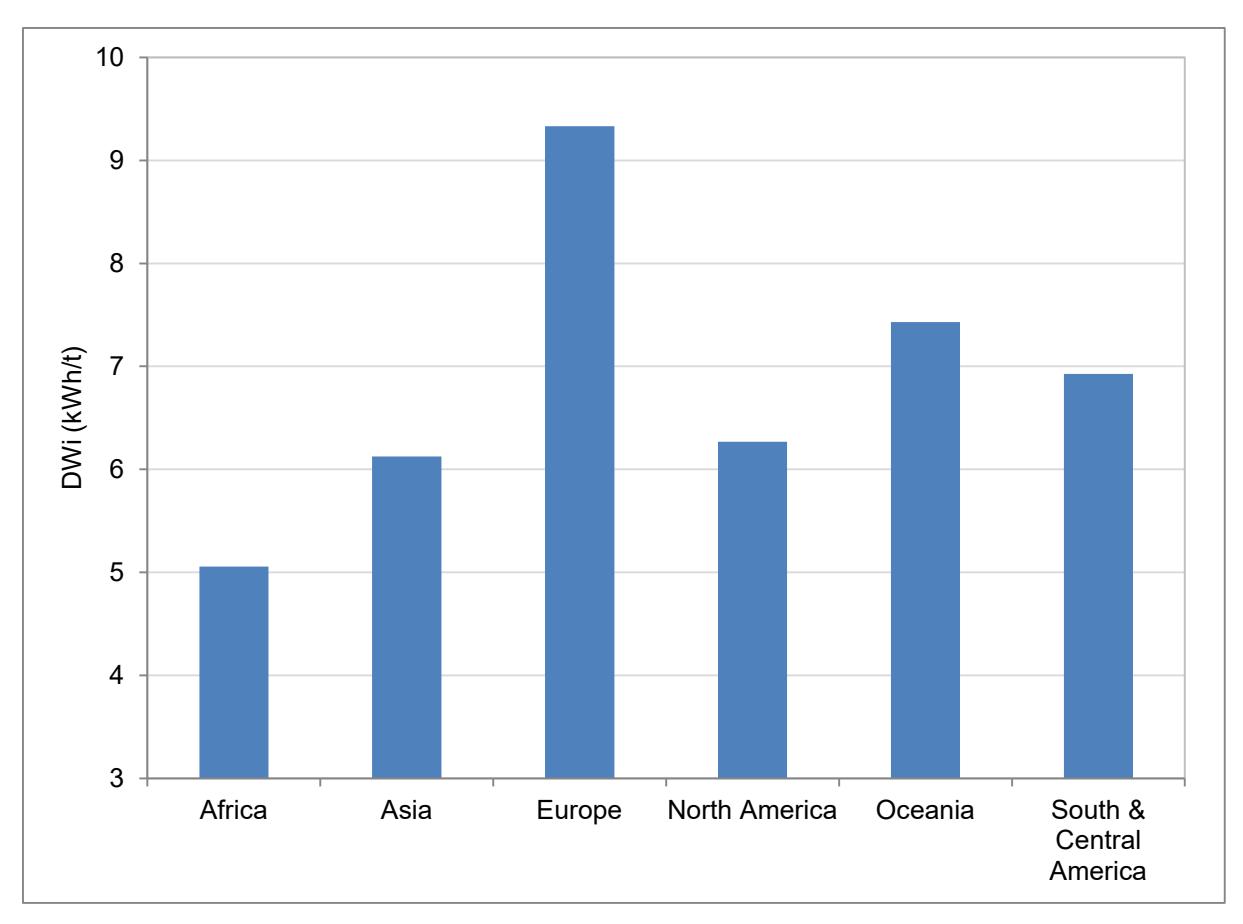
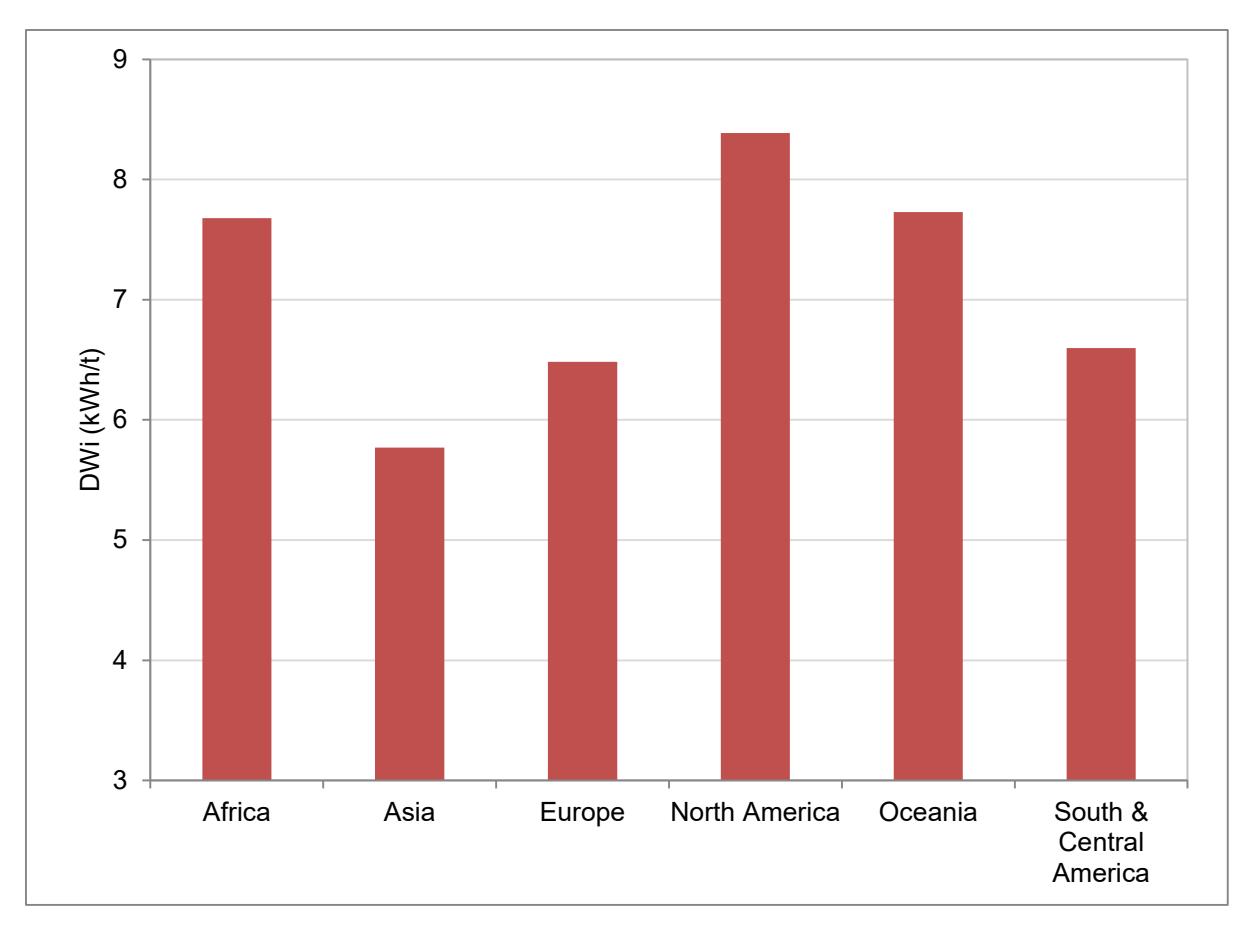
As copper and gold between them account for 80% of all tests, it is interesting to look at how the mean hardness of these deposits vary by continent. Figure 14 shows the histogram for copper, where it can be seen that there are significant differences in hardness between some of the continents, particularly Africa and Europe. Asia, North America and South/Central American values are all relatively similar, with Oceania being marginally higher. Figure 15 shows the equivalent gold deposit histogram. A very different distribution is seen, with the highest hardness values coming from North American deposits, followed closely by Africa and Oceania.
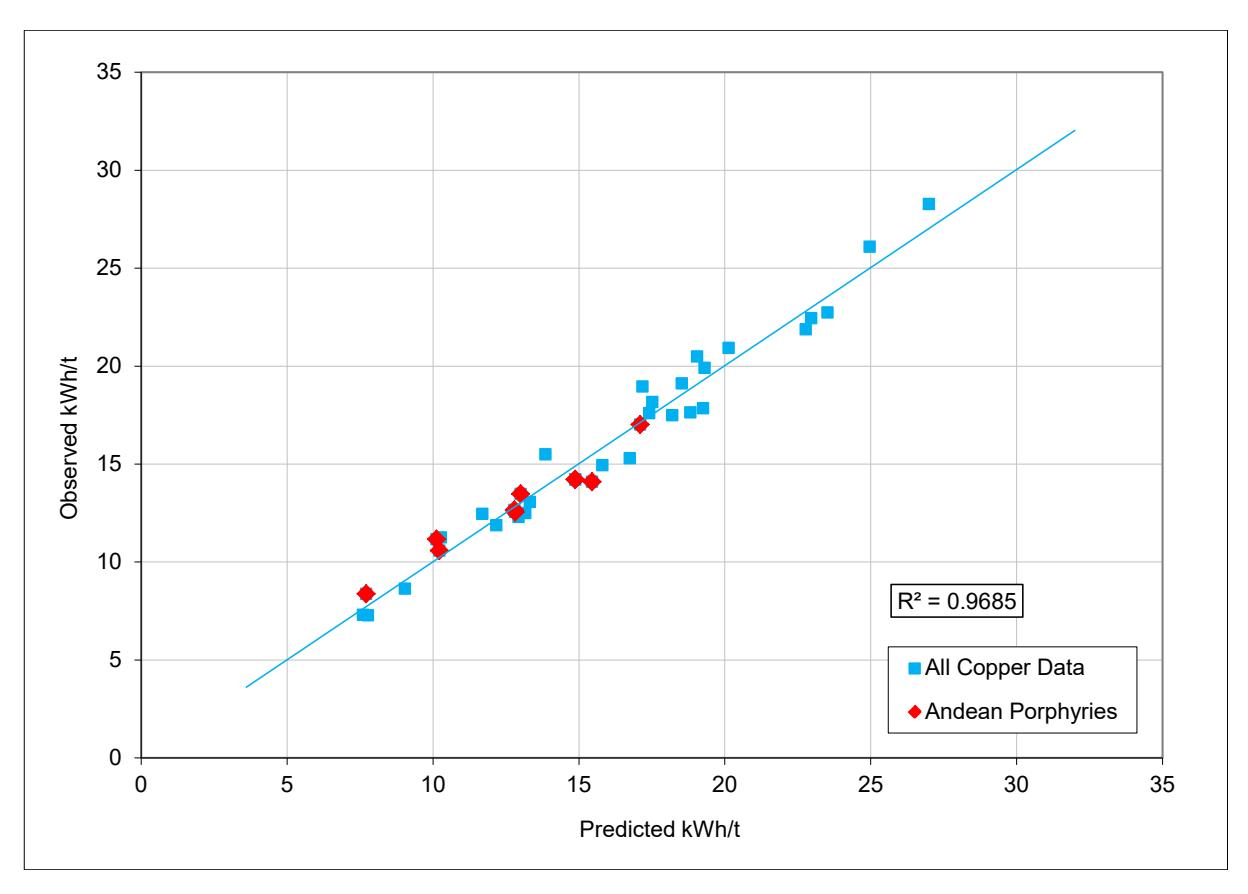
Interestingly, there have been some claims that South American Porphyry Copper deposits are somehow different to those elsewhere and that the SMC Test® when used to predict specific energy tends to giver higher values than observed for such deposits. Figure 14 indicates that there is nothing significantly different about the hardness of South/Central American copper deposits and that they have a similar hardness to the overall average of all copper deposits. Figure 16 shows the predicted vs observed circuit specific energies for South American Porphyry deposits as well as all other copper deposits, the results having been separated out from the benchmarking data in Figure 1. There appears to be no obvious bias in the results, all data being equally well predicted. The conclusion from this analysis is that there is nothing "special" about the hardness of South American porphyries and that specific energies are predicted accurately from the use of the SMC Test®.
CONCLUSIONS
To date over 35,000 SMC Tests have been carried out from over 1,300 deposits worldwide. These deposits are from 82 different countries and cover 30 different commodities. Hardness values were found to vary significantly from commodity to commodity. Similarly values varied from continent to continent mainly as a result of the different make-up of the commodities mined.
ACKNOWLEDGEMENTS
The contribution of Andrew Morrell in compiling the data base is gratefully acknowledged
REFERENCES
Alruiza, O.M., Morrell, S., Suazoa, C.J. and, Naranjoa, A. (2009) A novel approach to the geometallurgical modelling of the Collahuasi grinding circuit , Minerals Engineering, Volume 22, Issue 12, October 2009, Pages 1060–1067.
Buckingham, L, Dupont, J-F., Steiger, J Blain, B. and Brits, C., (2011). Improving Energy Efficiency in Barrick Grinding Circuits, Proc. SAG 2011. Paper no 150, Vancouver.
Festa, A., Putland, B., and Scinto, P. (2015). OMC Power-Based Comminution Calculations for Design, Modelling and Circuit Optimisation . 47th Canadian Mineral Processor Conference, Ottawa.
- Lane, G., Foggiatto, B. and Bueno, M. (2013). Power-based comminution calculations using Ausgrind , Procemin 2013 (pp. 85-96). Santiago.
- Morrell, S.(2004). Predicting the Specific Energy of Autogenous and Semi-autogenous Mills from Small Diameter Drill Core Samples . Minerals Engineering , Volume 17, Issue 3, March, Pages 447-451.
- Morrell, S.(2008). A method for predicting the specific energy requirement of comminution circuits and assessing their energy utilisation efficiency , Minerals Engineering, Volume 21, Issue 3, February, Pages 224-233
- Morrell, S.(2009). Predicting the overall specific energy requirement of crushing, high pressure grinding roll and tumbling mill circuits, Minerals Engineering, Volume 22, Issue 6, May, Pages 544-549.
- Morrell, S.(2010). Predicting the specific energy required for size reduction of relatively coarse feeds in conventional crushers and high pressure grinding rolls, minerals engineering Volume 23, Issue 2, January, Pages 151-153.
- Wang, E., Morrell, S., and Tian, J. (2015). A Guide to the Citic SMCC Approach Using Modelling and Simulation for the Design of Comminution Circuits . SME Annual Conference 2015, Denver.
- Wirfiyata, F. and McCaffery, K., (2011) Applied Geo-Metallurgical Characterisation for Life of Mine Throughput Prediction at Batu Hijau, Proc. SAG 2011. Paper no 32, Vancouver.
APPENDIX 1 – COUNTRIES FROM WHICH SAMPLES HAVE HAD SMC TESTS CARRIED OUT ON THEM
Argentina Armenia Australia Austria Bolivia Botswana Brazil Burkina Faso Canada Central African Republic Mongolia Morocco Mozambique Namibia New Zealand Nicaragua Niger Nigeria Pakistan Panama
Chile China Colombia Congo Cote d'Ivoire
Democratic Republic of Congo
Ecuador Egypt Eritrea Ethiopia Fiji Finland Ghana Greece Greenland Guatemala Guinea Guyana India Indonesia
Iran Ireland Kazakhstan Kyrgyzstan Laos
Lesotho Liberia Malawi Mali Mauritania
Mexico
Papua New Guinea Peru Philippines Poland Portugal Romania Russia Saudi Arabia Senegal Serbia Sierra Leone South Africa South Korea Spain Suriname Sweden
Tajikistan Tanzania Thailand Turkey
Ukraine United Kingdom Uruguay USA Uzbekistan Venezuela Vietnam Zambia Zimbabwe
APPENDIX 2 – PRIMARY COMMODITY CONTAINED IN ORE SAMPLES WHICH HAVE HAD SMC TESTS CARRIED OUT ON THEM
Basalt
Bauxite
Bentonite
Coal
Cobalt
Copper
Diamond
Fluorspar Gold
Graphite
Hematite
Iodine
K-Feldspar
Lead
Lithium
Magnetite
Manganese
Molybdenum
Nickel
Niobium
PGM
Phosphate
Rare Earths
Silver
Tin
Titanium
Tungsten
Uranium
Vanadium
Zinc