



The content on this page was automatically generated from the PDF publication document and may contain errors or inaccuracies. Please refer to the original PDF for the most accurate information.
Modelling and Scale-up of High Pressure Grinding Rolls
Steve Morrell, Luis Tondo and Frank Shi
INTRODUCTION
The high pressure grinding rolls (HPGR) is a relatively new technology which offers potential benefits in energy savings, circuit simplicity and improved product characteristics in mineral processing applications. To date the modelling of HPGR performance has been largely restricted to describing size distribution curves from laboratory machines using the self-similarity principle (Kapur [1]; Fuerstenau et al . [2]). For plant designers and operators interested in how HPGR technology can be incorporated in comminution circuits, such descriptions are of limited value. What is required is a performance model which is able to describe the throughput, size reduction and power draw of an HPGR given its dimensions, speed and a representative ore sample. A new HPGR model has been developed, which meets these objectives.
In this paper a fundamental model describing the HPGR throughput and a phenomenological model for the size reduction and power draw are given. Using laboratory test data the models are calibrated, after which they are able to scale-up to pilot and industrial size units. Details of the scale-up procedure are illustrated and examples of the scale-up are included.
MODELLING OF HPGR THROUGHPUT
Rolls throughput can be theoretically expressed as follows:
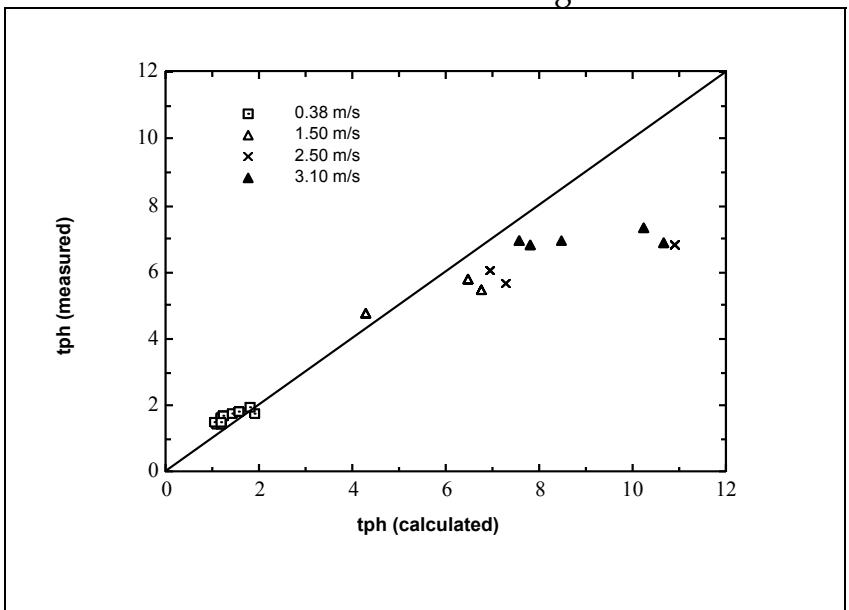
However equation 1 assumes that there is no slip between the rolls surface and the ore. Figure 1 shows the deviation between the measured throughput and the calculated one using equation 1 for a diamondiferous ore treated through a 100 mm Polysius laboratory scale HPGR. It is clear that the equation progressively overpredicts the HPGR throughput as rolls speed is increased, indicating that slip at the rolls face is occurring.
To correct for the slip effect it is considered that for a specific feed the slip is a function of the rolls speed and the dimensionless working gap which is defined as
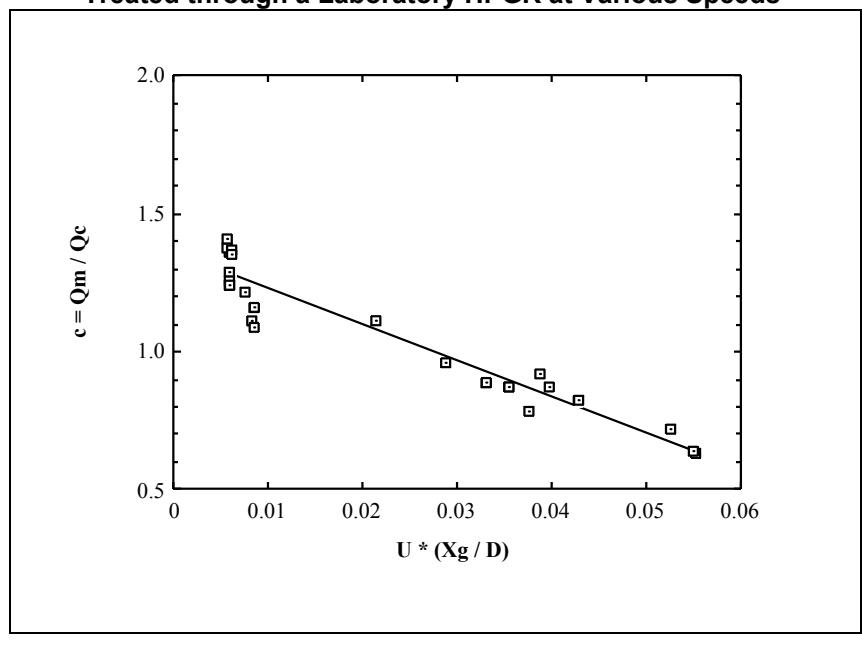
xg /D, where D is the rolls diameter. Figure 2 plots the correction factor c (c = Qm Qc , where Qm is the measured throughput and Qc is that calculated by equation 1) versus the product of the speed and the dimensionless gap (U* xg D ) diamondiferous ore. A linear regression of the plot was obtained and equation 1 was accordingly modified as follows:
$$ Q = 3600 U L x_g \rho_g c $$ (2)
where c is the correction factor determined from Figure 2.
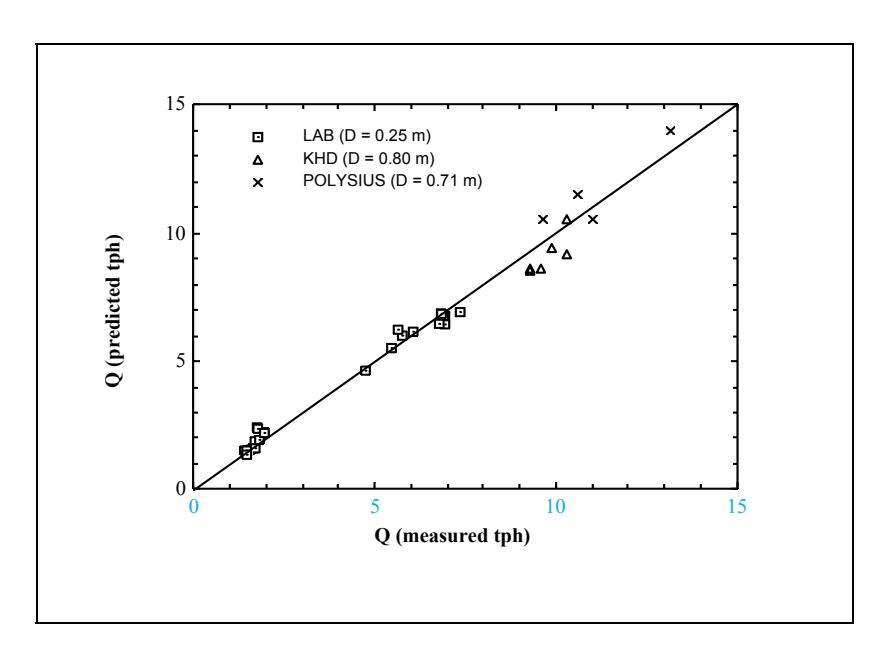
Using equation 2 with c determined from Figure 2, the throughput of a laboratory scale HPGR (D = 0.25 m) and two pilot scale HPGRs (KHD, D = 0.8 m; Krupp Polysius, D = 0.71 m) was predicted. A comparison between the calculated and the measured throughputs is given in Figure 3. The rolls speeds varied from 0.29 m/s to 3.1 m/s, rolls length from 0.1 m to 0.21 m, rolls diameters from 0.25 m to 0.80 m, and working gaps from 3 mm to 23 mm. The throughput model prediction is seen to be good.
MODELLING OF SIZE REDUCTION
Model structure
Underlying the structure of the size reduction model are three assumptions about the inherent breakage mechanisms that occur in HPGRs (Morrell et al ,[3]),viz.
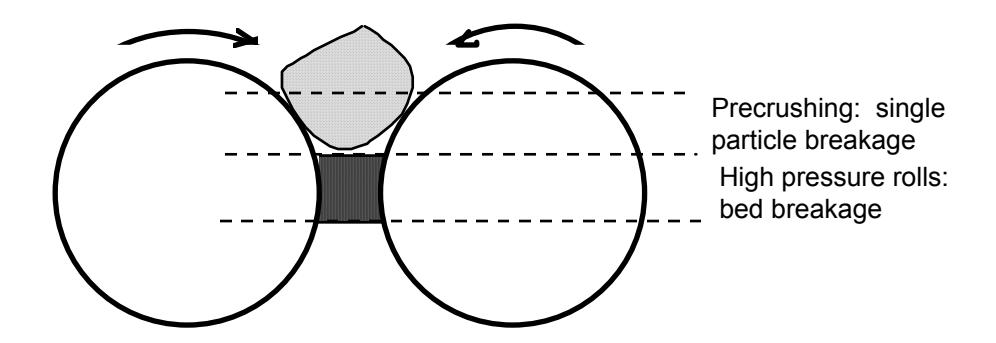
i. If particles are bigger than a certain critical size they will be broken directly by the roll faces as would occur in a conventional rolls crusher. The breakage in this zone can be considered as analogous to a 'pre-crusher', the products from which may subsequently pass to a region where a bed under compression has formed (Figure 4). The boundary between the pre-crusher and bed compression regions is defined by a critical gap (xc).
ii. Breakage at the edge of the rolls is different to that at the centre and conforms more to that experienced in a conventional rolls crusher (Figure 5). This is the so-called 'edge effect' which defines the proportion of relatively coarse particles usually seen in HPGR products. Its existence has been explained by the pressure gradient across the width of the roll and the static confinement of the ore at the edges of the rolls which the cheek-plates provide.
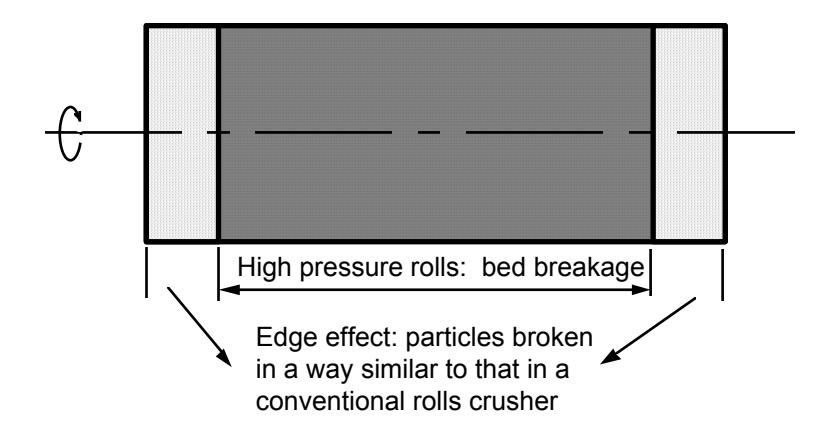
iii. At some point away from the edges of the rolls, and extending upwards from the area of minimum gap (xg) to an area bounded by the critical gap (xc), is a compression zone where breakage conditions are those experienced in a compressed packed bed.
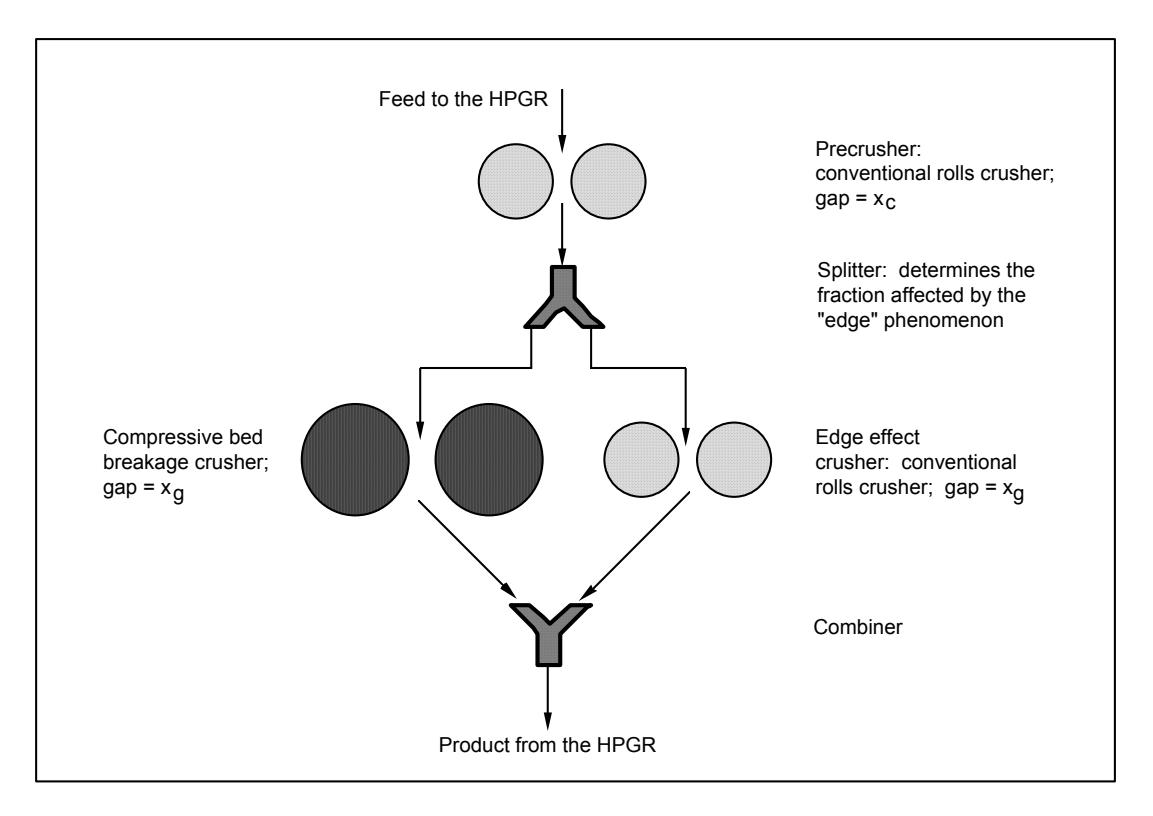
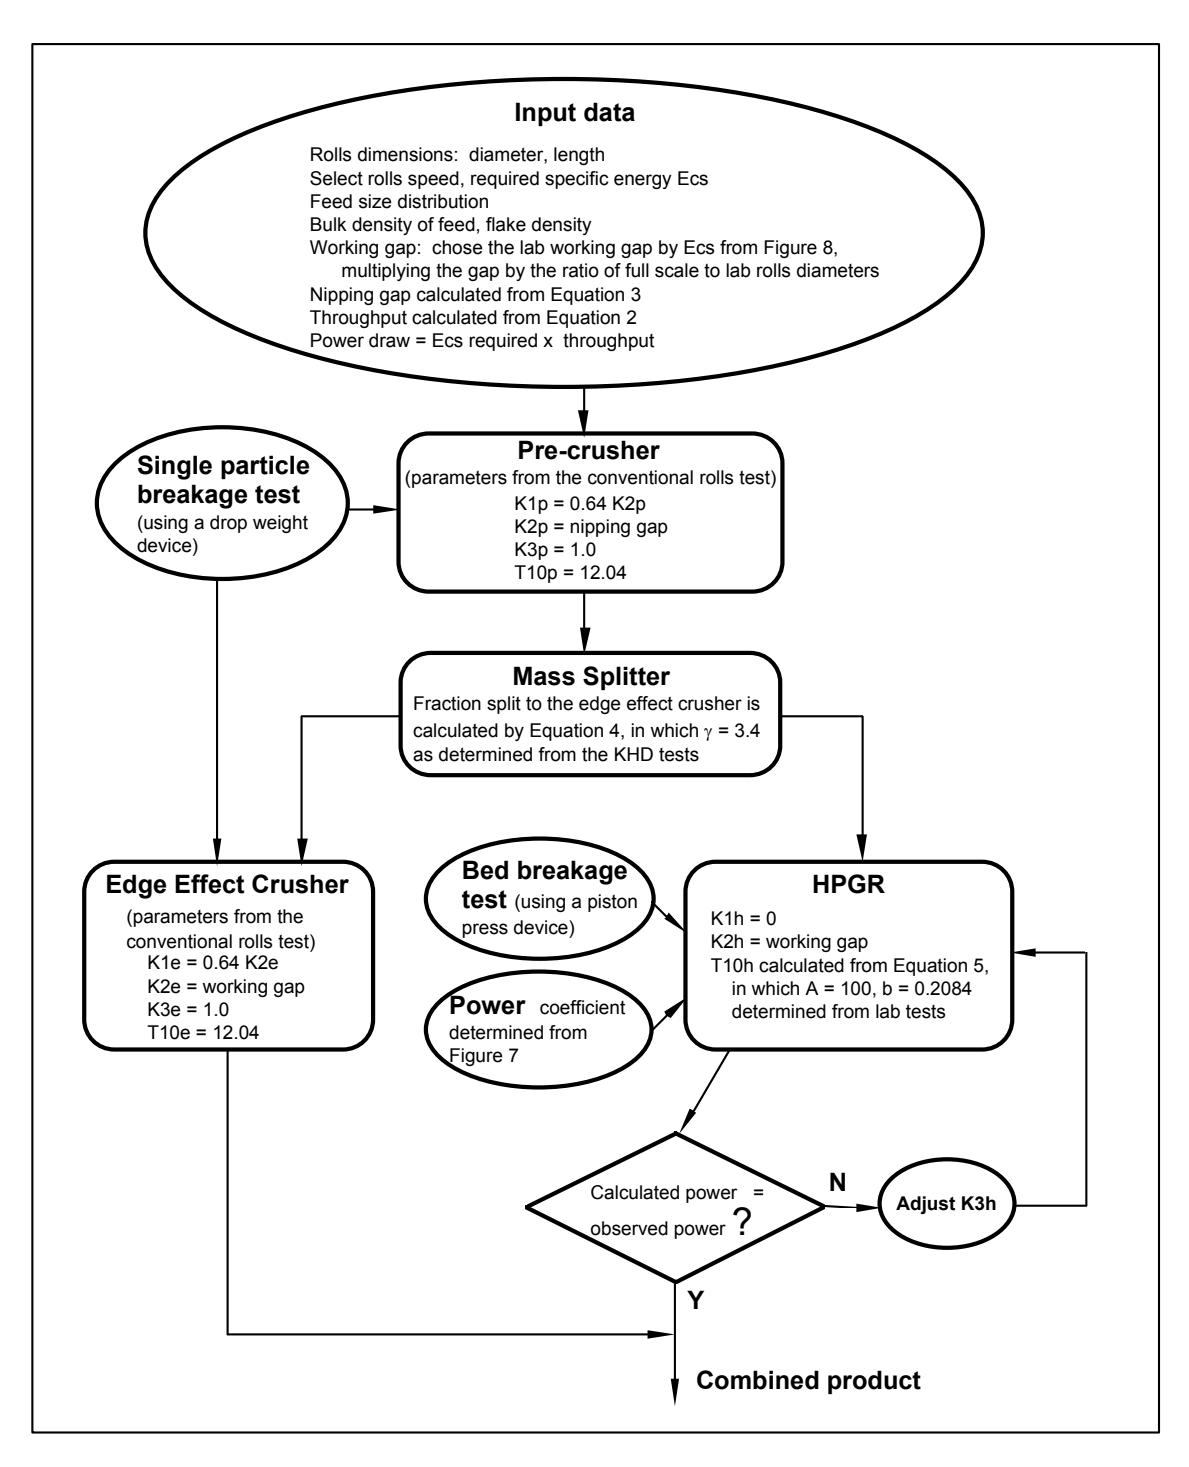
From a modelling viewpoint these assumptions can be accommodated in the conceptual structure shown in Figure 6. Feed firstly passes to the 'pre-crusher'. Particles greater in diameter than the critical gap (xc) are crushed below this size in a single particle breakage mode. The products from this breakage then combine with feed particles which are smaller than xc. A proportion is then diverted to another single particle crusher stage where all particles greater than the minimum gap (xg) are crushed to below this size. The remainder are diverted to a compression stage where all particles greater than xg are crushed below this size but in a compressed bed mode. All products then combine to produce the final HPGR product.
Using the model
The model contains three breakage processes and one splitting process between the edge and compressed bed zones. For the breakage processes a conventional crushing model (Andersen [4]; Whiten [5]) is employed to describe the size reduction.
For the pre-crushing process, breakage of particles is assumed to be in single particle mode in which rocks are nipped directly by the faces of the rolls, similar to a conventional rolls crusher. The parameters used to describe crushing in this zone are determined from tests conducted in a conventional (non-HPGR) laboratory rolls crusher and single particle breakage tests. The effective gap of the crusher is represented as follows:
$$ x_{c} = 0.5 \left\{ (D + x_{g}) - \left[ (D + x_{g})^{2} - \frac{4\rho_{g} Dx_{g}}{\rho_{c}} \right]^{0.5} \right\} $$ (3)
where \( x_g \) is the working gap, \( \rho_C \) is bulk density of feed and \( \rho_g \) is flake density.
In the edge zones rock breakage is also assumed to take place in single particle mode. The parameters used to describe crushing in this zone are the same as that for pre-crushing, except that the effective gap is set to that of the working gap \( (x_g) \) .
In the compressed bed crushing zone size reduction is assumed to be similar to that experienced by a bed of particles in a piston press. The parameters used to describe size reduction are determined from tests in a laboratory or pilot scale HPGR machine combined with breakage tests in a piston press. The piston press tests provide information on the relationship between size reduction and energy input in a compressed bed. They also provide a description of the characteristic shape of the product size distribution. This part of the model contains 2 parameters which are fitted to the laboratory scale HPGR test data
The last sub-process in the model is the split between the edge and compressed bed zones. The edge zones are associated with the drop in pressure that is experienced towards the edge of the rolls. Their extent is assumed to be a function of the working gap. The fraction of feed which is crushed in the edge zones (f) can therefore be expressed as:
where γ is split factor. Using the KHD pilot scale HPGR test results where sizing data of both pure flake and total product were available, the split factor γ was found to be approximately constant with a value of 3.4. In physical terms this means that the edge effect zone extended from the edge of the roll a distance equivalent to 1.7 times that of the working gap.
MODELLING OF POWER DRAW
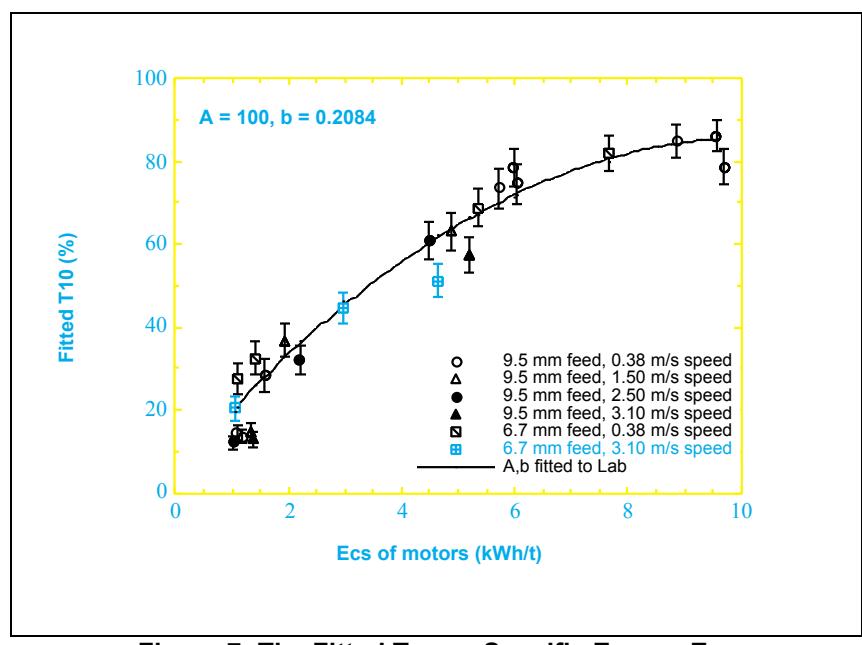
The size reduction model contains an energy balance equation (Andersen and Napier-Munn [6]) which ensures that the energy for size reduction is compatible with that provided by the motor. In the size reduction model two are fitted to the laboratory scale HPGR data. One of these, the T10 parameter, is related to the specific energy imparted by the HPGR. To illustrate this the T10 - Ecs plot from 24 sets of diamondiferous ore tests under various rolls speeds and feed size conditions are shown in Figure 7.
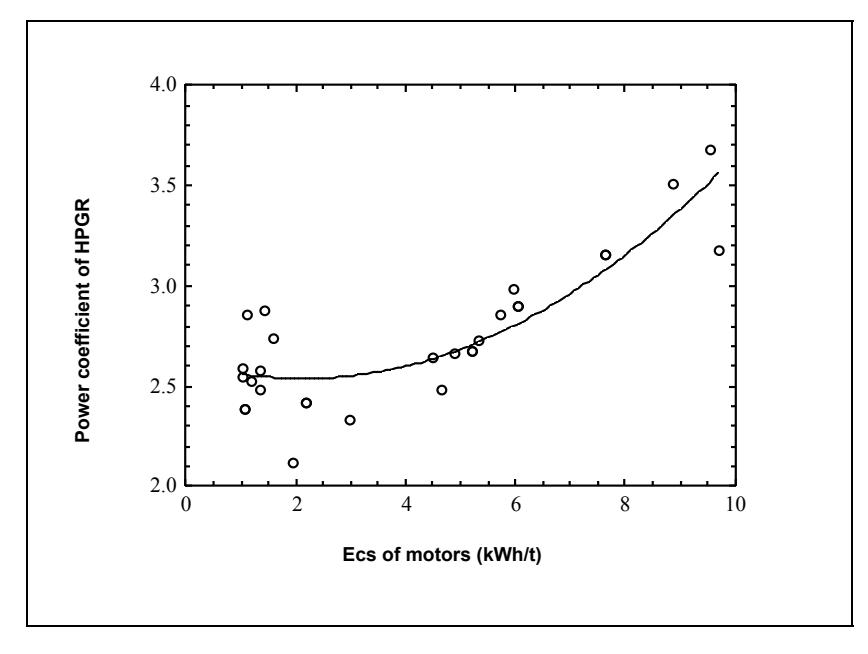
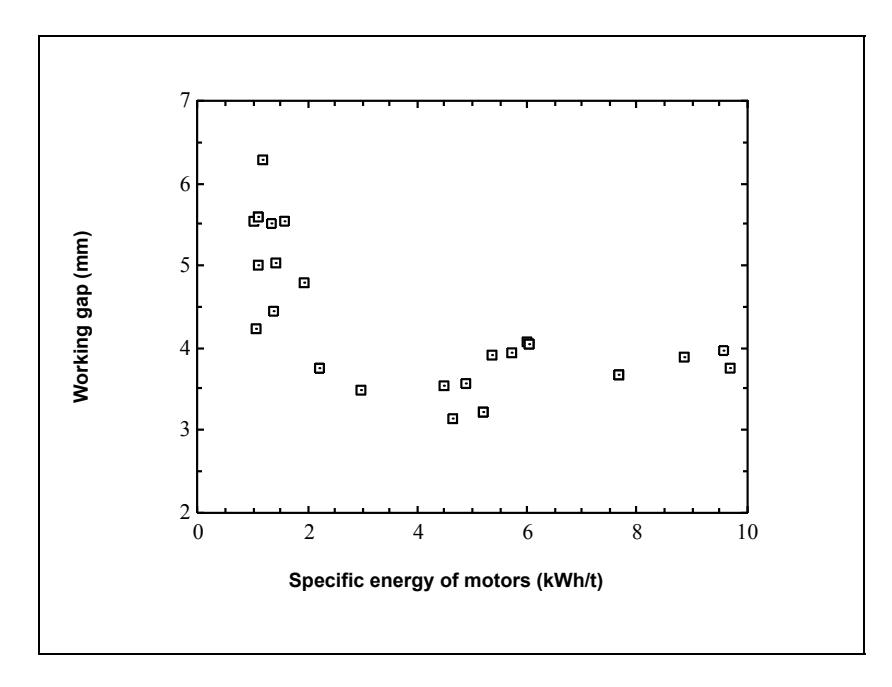
A power coefficient kp is required which relates the measured power to that derived from the model for size reduction. This model uses the specific energy (kWh/t) and associated T values from the piston press breakage experiments. From these it calculates the overall specific energy in a piston press. The difference between this value and that observed from the motor is accommodated by kp, ie. kp is the ratio of the observed to the theoretical piston press specific energy. This coefficient has been found to be reasonably constant over a range of specific energies but increases rapidly beyond a certain limiting value. This is shown in Figure 8 for the 24 sets of diamondiferous ore data.
SCALE-UP
Scale-up procedure
The parameters ρc and ρg in Equation 3 will all be functions of feed type, operating conditions (eg working pressure) and the roll surface (eg smooth, chevroned, studded). Therefore, providing the pilot scale or the full scale machines are operating under similar conditions to the laboratory unit, then xg will be proportional to the diameter of the rolls. The principal dependence of the working gap will be on the working pressure, with the gap reducing as the pressure increases. As working pressure is directly related to specific energy, then it will be found that as the specific energy increases the gap will decrease. An example of this is shown in Figure 9 for diamondiferous ore treated through the laboratory machine.
To predict the performance of pilot scale and full scale HPGRs the model is firstly calibrated using the results from the laboratory, conventional rolls, single particle breakage and piston bed breakage test. Figure 10 illustrates the scale-up procedures. Also shown in Figure 10 are the values of the parameters obtained from the calibration, which are now used to predict the two pilot scale units and one full size machines treating the diamondiferous ore.
Examples of scale-up
The full scale-up procedure has now been implemented in the comminution simulator JKSimMet. When running the simulations of pilot scale or the full scale machines the parameter K3 for the compressed bed crushing zone is automatically adjusted until the model predicts the same power draw as was originally chosen for the simulation. As a the resultant product size distribution is based on this power consumption.
Pilot scale
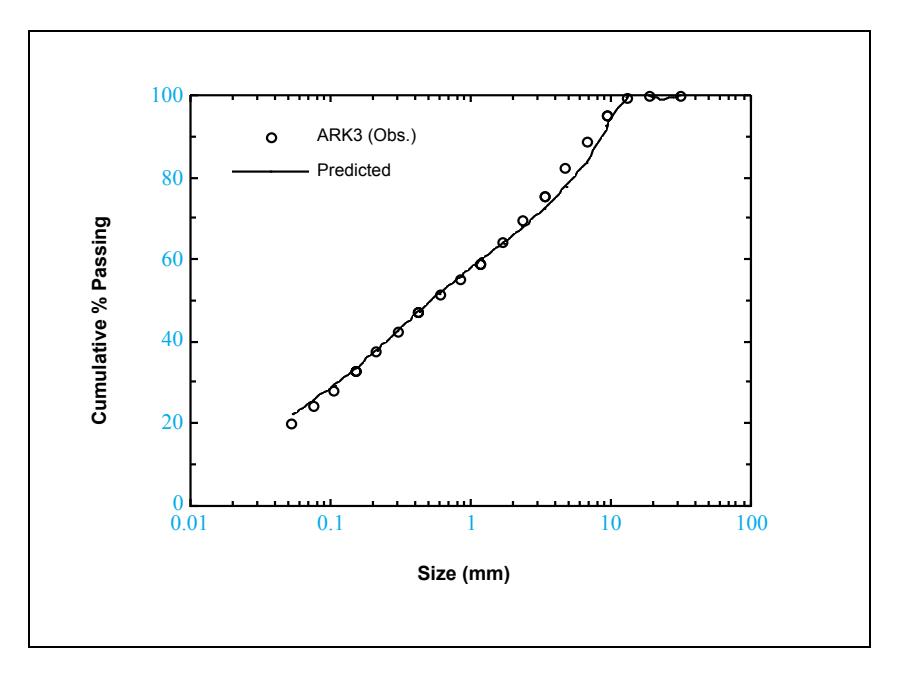
In the case of the KHD tests the rolls diameter was scaled up to 0.8m from 0.25m of the laboratory machine, with smooth roll surface as that for the laboratory test.
The model prediction and actual data for this test are shown in Figure 11. The agreement is good.
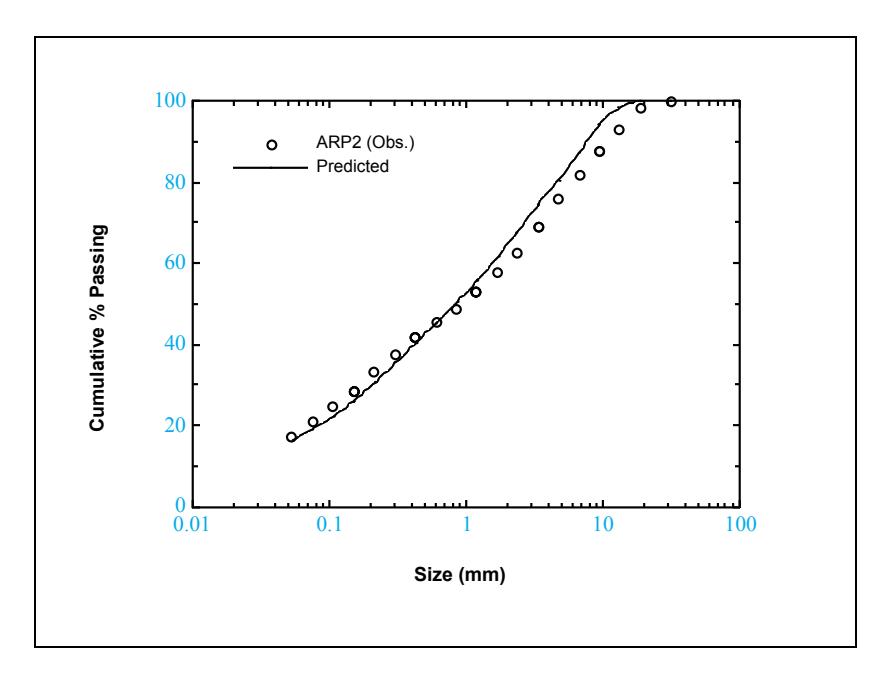
In the case of the Krupp Polysius pilot tests (rolls diameter 0.71 m), difficulties were experienced due to the use of 4 mm profiles on the rolls of the machine. These resulted in a considerably larger working gap than was observed for the KHD pilot tests using smooth rolls. It is concluded that laboratory tests must be conducted with a rolls surface similar to that proposed on the full scale machine. To obtain some indication of whether the model could predict the Polysius pilot results it was assumed that as the machine had 4 mm high profiles its working gap would be 8 mm greater than with smooth rolls (ie each roll would drag into the gap an extra amount of material equivalent to the gap increasing by 4 mm). The results from using this assumption are shown in Figure 12. Considering the assumptions that had to be made the predicted results compare favourably with those observed.
Full scale
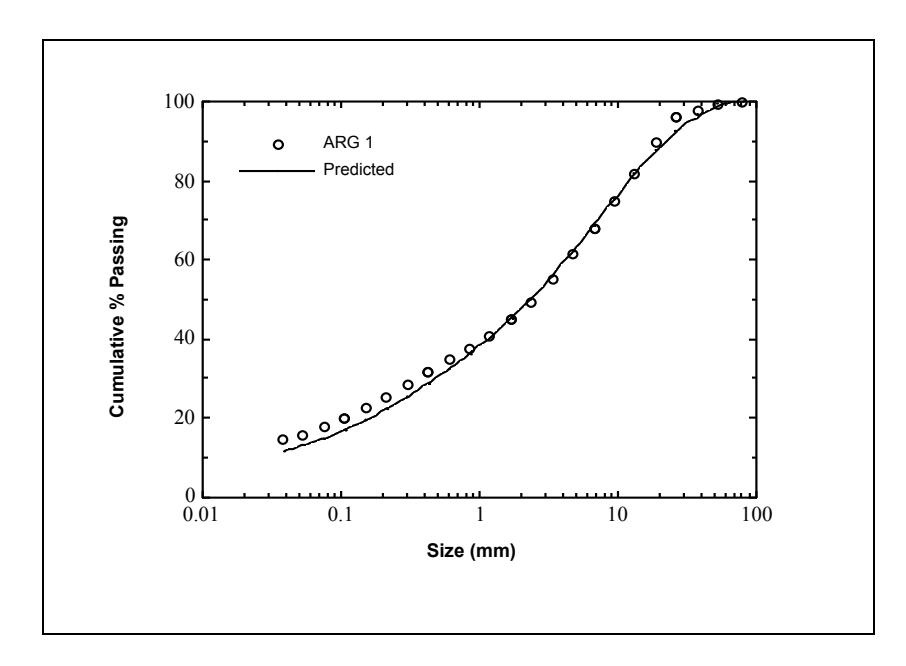
Figure 13 shows the results from predicting the product size distribution of a 2.2m diameter machine using the model calibrated from laboratory scale data on the same ore. Again, the agreement between the observed and predicted data is good.
CONCLUSIONS
A fundamental model for HPGR throughput and a phenomenological model for size reduction and power draw have been developed by considering the machine operation as comprising the sub-processes of pre-crushing, compressed bed crushing and edge effect crushing. Parameters for the models can be obtained from simple laboratory breakage tests and a limited testwork programme using a laboratory scale HPGR. After calibration the model is able to scale-up to pilot and industrial size units to predict throughput, size reduction and power draw.
ACKNOWLEDGMENTS
The authors wish to acknowledge the financial support of the sponsors of the AMIRA P428 project (Application of High Pressure Grinding Rolls in Mineral Processing) including the Centre for Mining Technology and Equipment (CMTE). The considerable assistance of the staff at KHD and Krupp Polysius in helping with the conducting of the testwork, as well as the relevant staff and students at the JKMRC and CSIRO, in particular Wilson Lim of CSIRO, is also gratefully acknowledged. The laboratory HPGR used in the work was the Polysius 100 mm unit of the CSIRO Division of Minerals. The full scale machine was that operated by Argyle Diamond Mines. The assistance of ADM in the testwork, and particularly Dean David, is gratefully acknowledged.
REFERENCES
- [1] P.C. Kapur: Self preserving size spectra of comminuted particles. Chem. Engng. Science , 27: 425-431, 1972.
- [2] D.W. Fuerstenau, A. Shukla and P.C. Kapur: Energy consumption and product size distributions in choke-fed, high compression roll mills. Int. J. Miner. Process. , 32: 59-79, 1991.
- [3] S. Morrell, Lim. W, F. Shi and L. Tondo: Modelling of the HPGR crusher. To be presented at SME Annual Conference , Denver, Colorado, 1997.
- [4] J.S. Andersen: Development of a cone crusher model. M. Eng. Sc. Thesis , University of Queensland (JKMRC), 1988.
- [5] W.J. Whiten: The simulation of crushing plants with models developed using multiple spline regression. J. South Afr. Inst. Min. Metall . 72: 257-264. 1972.
- [6] J.S. Andersen and T.J. Napier-Munn: Power prediction for cone crushers. Proc. 3rd Mill Ops Conf, Cobar , Aus. Inst. Min. Met., 1988.