



The content on this page was automatically generated from the PDF publication document and may contain errors or inaccuracies. Please refer to the original PDF for the most accurate information.
"Modelling and Simulation Techniques Applied for Optimisation of Mine to Mill Operations and Case Studies"
Walter Valery Jnr. 1 , Steve Morrell 1 , Toni Kojovic 1 , Sarma Kanchibotla 1 and Darren Thornton 1
Julius Kruttschnitt Mineral Research Centre, Isles Road, Indooroopilly, Qld 4068, Brisbane, Australia
ABSTRACT
Mine fragmentation can influence the operational performance of the comminution sections of the treatment plant. Recent work at the Julius Kruttschnitt Mineral Research Centre (JKMRC) has proven that changes in blast design can have dramatic effects on overall profitability whether the mine feeds a milling or crushing comminution plant. Field experimentation in this area is often found to be difficult because of high implementation costs and insufficient understanding about the effect of fragmentation at different stages in a comminution circuit. Modelling and simulation of blasting and comminution processes provides a more economic alternative to explore the impact of blast design changes on the down stream operations. The JKMRC has been conducting research in understanding and modelling of comminution for the past three decades and hence are ideally placed to determine the blast fragmentation/milling interactions as well as the effect on further downstream comminution steps. This paper briefly describes the techniques utilised and results obtained from case studies where optimisation of mine to mill processes were conducted.
INTRODUCTION
The JKMRC has developed and applied tools to explore ways of improving overall mine to mill process performance. One such way is to modify blasting so that a more favourable size distribution is presented to the comminution step thus leading to increased throughput or change in product specification eg lump:fines ratio in iron ore operations. From a comminution viewpoint, it is possible that to generate a more favourable run of mine (ROM), the mining cost will increase, hence offsetting, at least in part, the increases in revenue due to enhanced throughput and/or product quality. Whether such changes can be obtained by modifying blasting and what their associated costs are can be determined by trial and error in the field. However, this is likely to be a very costly approach with no guarantee that a successful outcome will result. Simulation of the blasting and comminution steps provides a cheap way to explore the potential for making beneficial changes to blasting and provides data with which to conduct financial analyses of the consequences.
Historically, blast modelling has confined itself to sizes of more direct importance to mining operations - typically > 50-100mm, and hence has ignored the material smaller than this. However, it is this size which typically affects the performance of the comminution steps. The JKMRC has developed further a number of blast models, which aim to address this deficiency. Based on studies at a number of mines these models have shown to be very accurate. This paper describes the application of one of these blast models, in conjunction with models of crushing, screening, and SAG milling, to illustrate the potential of this technique in determining changes in blast design which may lead to significant increases in lump:fines ratio and mill throughput. Hamersley Iron's Marandoo (Kojovic et al, 1998) and KCGM's Fimiston (Kanchibotla et al, 1998) operations have been used for these demonstrations.
MODELLING
Blasting
Model Structure
The blast model used for this exercise uses a modified Kuz-Ram approach to predict the coarse end of the ROM size distribution (Kuznetsov, 1973; Cunningham, 1987). In this model the size distribution of blasted rock is represented by the Rosin-Rammler distribution:
where
R = percentage smaller than x
x = size of rock x = median rock size n = uniformity exponent.
Using Cunningham's equations the median rock size is related to the type and amount of explosive plus a rock factor. The rock factor is influenced by the UCS, Young's Modulus, insitu block size and joint spacing. Cunningham also related the uniformity exponent to the blast design.
In the case of the finer fractions it is hypothesized that they are produced by the pulverizing or crushing action of the explosive adjacent to the blast holes. A cylinder of rock around each hole is therefore defined within which crushing takes place. The radius of the cylinder, and hence its volume, is determined by calculating the point at which the radial stress around the blast hole exceeds the dynamic compressive strength of the rock. For this purpose Jaeger and Cook's equation (1979) is used. Currently a size of 1mm is used to define the coarsest particle that results from crushing.
Having defined the volume of the crushing zone around each blast hole and knowing the number of blast holes the volume of crushed material (-1mm) can be calculated (Vcrush). As the volume of rock blasted (Vbr) is also known the % of blasted rock smaller than 1mm can be estimated from:
The Rosin-Rammler size distribution is also used to describe the finer fractions but with a different uniformity exponent (n). This is calculated from equations 1 and 2, as the % - 1mm from equation 2 is the value of R at 1mm in equation 1.
Characterisation
For the crushed zone model information is required about the rock strength and its structure as follows:
Young's Modulus UCS Mean in situ block size Joint spacing
Comminution
Characterisation
Rock breakage characteristics are determined by using a drop-weight device. This is used to break rocks in a range of sizes under a range of energies. The results are condensed in a relationship between the T10 and the specific breakage energy as follows:
$$ T10 = A (1-e^{-bEcs}) $$ (3)
where
A, b = ore specific parameters Ecs = specific breakage energy
(kWh/t)
T10 = % passing 1/10th original particle size.
By convention the T10 is the % passing 1/10th of the original particle size, whilst the T50 is the % passing 1/50th etc. The T10 relationship with respect to the rest of the product size curve is therefore expressed as a matrix of Tn values where n = 2, 4, 25, 50, 75.
In the case of the sag mill model the parameters A and b are required. The model then uses these to reconstitute product size distributions from breakage events. In the case of the crusher model a matrix such as described above is required, with required values being determined by spline interpolation.
Model Structure
Crushing
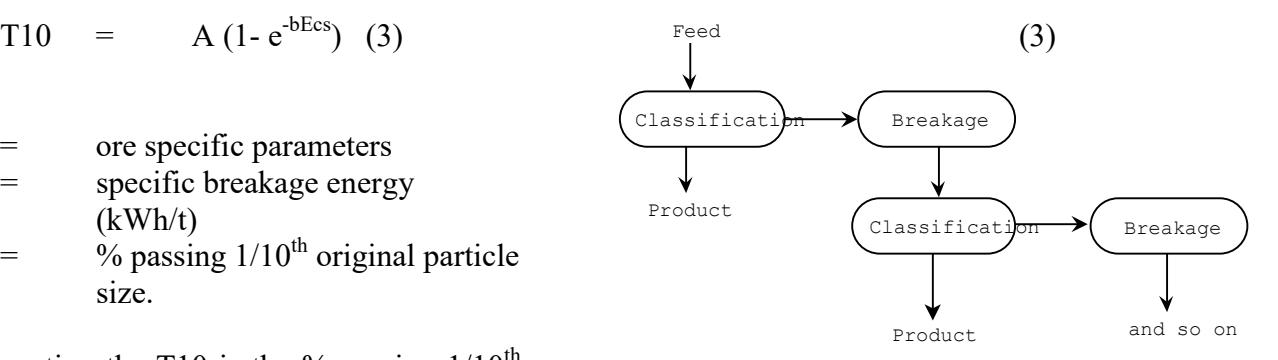
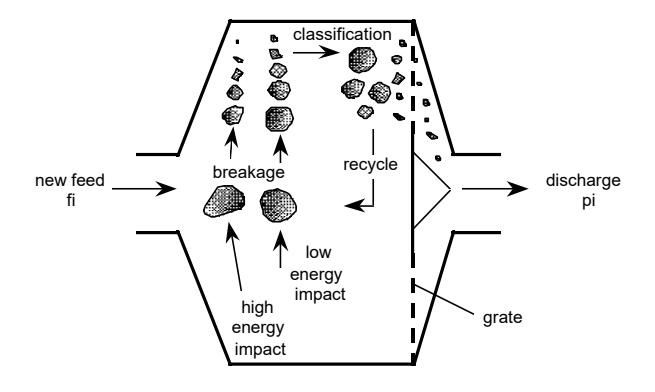
The model used is that developed by Whiten (1974) and subsequently modified by Andersen (1988). Conceptually it is described in Figure 1 and, given that the crushing action of jaw and gyratory crushers is similar (Figure 2), can be used for both devices. Feed is considered to undergo a series of breakage and classification stages as it passes down the crushing chamber, reducing in size as it does so. Each breakage stage is assumed to produce the same geometric size reduction. This is modelled through the use of the T10 parameter, which in turn is related to the product size distribution resulting from breakage. The relationship between T10 and the breakage size distribution is determined experimentally by breaking representative rock specimens using the JKMRC's drop-weight tester.
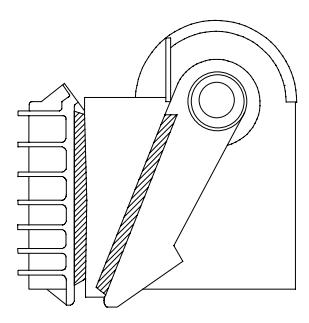
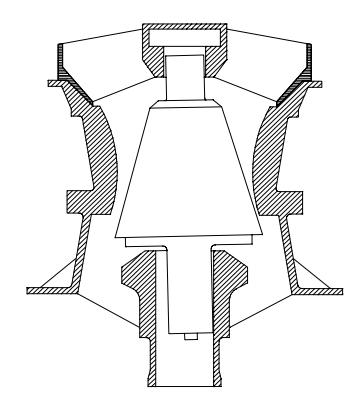
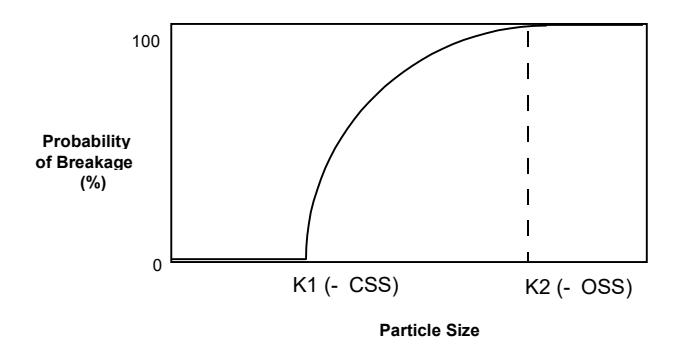
Classification in the chamber of the crusher is controlled by the open and closed side setting. If the rock is larger than the open side setting (oss) then it will remain in the chamber and be broken. Conversely if the rock is smaller than the closed side setting (css) it will fall out of the chamber and not be crushed any further. For rocks which are in between the css and oss in size a probability exists from them to either remain or pass out of the crusher. This probability (classification) function has a shape similar to that shown in Figure 3. described by 3 parameters - K1, K2, K3, where K1 and K2 ideally should equal the css and oss respectively and K3 describes the shape of the curve.
Screening
Screen performance is described using a classification efficiency curve, which is described by Whiten (Napier-Munn et al , 1996) as follows:
E = $$ C((e^{\alpha}-1)/(e^{\alpha xi}+e^{\alpha}-2)) $$ (4)
where
\( \alpha \) = efficiency sharpness parameter \( E_i \) = fraction to underscreen of size
fraction i C = by-pass fraction
\( x_i = d_i / d_{50c} \)
\( d_i \) = particle diameter of size
fraction i
\( d_{50c} \) = corrected cut point
Degradation
Degradation can be viewed as breakage which takes place at low specific energy levels and typically results in the original rock remaining largely intact but with some of its surface features altered. In the case of very friable rock more substantial breakage may occur. degree of breakage will therefore be strongly ore-strength dependent. To reproduce this type of breakage a model has been introduced to the JKSimMet simulator in which a single breakage step is applied to each size fraction in the feed. The amount of breakage is determined by a user-supplied T10 value. This value is determined from the A and b breakage parameters supplied by the drop weight testing of the ore in question, plus the estimated input energy of the degradation step (eq. 3). This needs to be determined from local geometry eg the height drop in a bin or the speed with which a stream of rock impacts a liner in a conveyor transfer chute.
Semi Autogenous Milling
The most recent version of the sag mill model is based on that originally developed by Leung (1987). This has been subsequently modified to incorporate the effect of ball load, feed size and speed (Morrell and Morrison, 1996) as well as the effects of grate design (Morrell and Stephenson, 1996). In addition a power draw model was also added (Morrell, 1996a, 1996b). Conceptually the model is represented in Figure 4.
The model utilises the concept that breakage within a mill is dependent upon specific breakage energy. This in turn is related to the mill dimension and a grinding medium size which is a characteristic of the ball charge (if any) and rock charge. The relationship between specific breakage energy and the progeny size distribution is provided by the same dropweight test that provides data for the crusher model plus a tumbling test both of which are carried out on the ore in question. generate breakage parameters, which relate to the high energy (impact) and low energy (abrasion) size reduction processes that are believed to take place in AG/SAG mills. Transport of slurry through the mill is described by a function which relates the hold-up of slurry, grate design, grate open area and mill speed to the volumetric discharge rate through the grate.
The model reflects feed size changes by changing the load size distribution and hence rock grinding media size. In addition the size-by-size breakage rate distribution, which is central to the operation of the model, is modified by using an empirical correlation based on a large database of operating mills.
MARANDOO CASE HISTORY
Blast Model Validation
Marandoo used ANFO, which has a nominal density of 850 kg/m3 and a VOD of 4000 m/s. Different blast patterns were employed to suit the properties of the different domains within the deposit. The patterns employed in the three of the domains are shown in Table 1.
| Blast Design | Bench | Bench | Bench |
|---|---|---|---|
| Parameter | 750/604 | 200/227 | 300/212 |
| Burden (m) | 4.8 | 5.1 | 5.6 |
| Spacing (m) | 5.5 | 5.9 | 6.4 |
| Powder Factor | 0.30 | 0.24 | 0.22 |
| (kg/t) |
To realistically simulate Marandoo the operation it was first necessary to characterise the ore body composition in terms of hard and soft ore types and to use the blasting model to predict the ROM from each, independently. Marandoo staff therefore provided initial estimates of the proportions of hard and soft ore based on visual observation of samples. The predicted ROM size distributions from the soft and hard ore types were then combined using proportions which gave the best match to the measured ROM sizings. In all, 3 domains were studied. The Marandoo staff estimates of the proportion of soft and hard in each domain together with the estimates based on the blast model are shown in Table 2. As can be seen the estimates match very well and confirm the validity of the blast model.
|
Audit
1 (750/604) |
Audit
2 (200/227) |
Audit
3 (300/212) |
|
|---|---|---|---|
| Domain1 | Domain2 | Domain3 | |
|
Hard/Soft
(%) - HI |
60:40 | 57:43 | 40:60 |
|
Hard/Soft
(%) - JK |
59:41 | 61:39 | 43:57 |
Comminution Model Validation
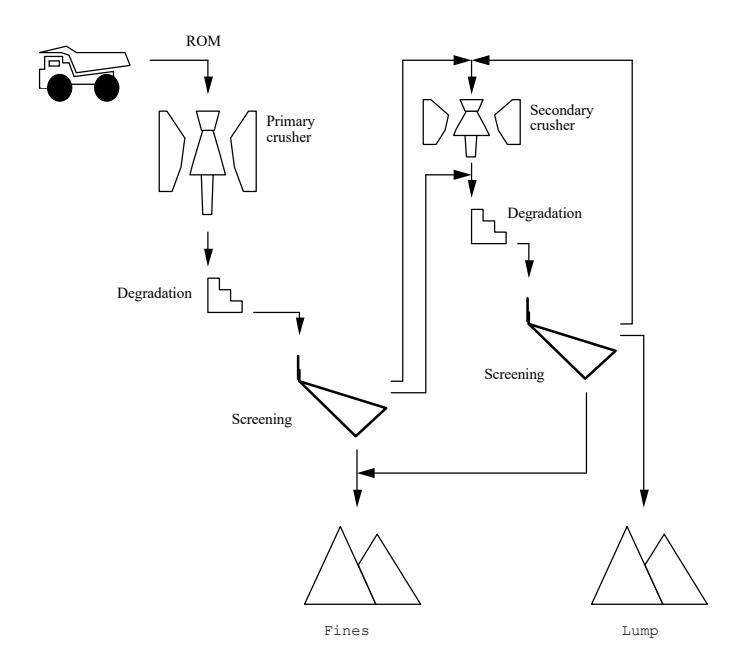
The comminution circuit is shown in Figure 5. Surveys were conducted of all of the individual units in the circuit. These data were then used to generate models which were combined into a full flowsheet simulation. The predicted ROM size distributions were then used as feed to the circuit. Hard and soft components were treated separately and combined at the end of the simulation. The resultant final lump:fines ratios predicted from simulation are given in Table 3. These are compared with the DCS data which were collected whilst the ores from each domain were being treated through the plant. Good agreement was found.
| Audit 1 | Audit 2 | Audit 3 | ||||
|---|---|---|---|---|---|---|
| meas. | sim | meas. | sim | meas. | sim | |
| Lump | 49-51 | 49 | n/a | 51 | 44-47 | 47 |
| (Gen + | ||||||
| Nat.) | ||||||
| Fines | 51-49 | 51 | n/a | 49 | 56-53 | 53 |
| (Gen + | ||||||
| Nat.) |
Simulations of Changing Blasting Practice
Having validated both the blasting and comminution models, simulations were then run to determine whether the blast design could be manipulated to change the final lump:fines ratio.
The influence of the following changes in the blast design on the fragmentation was studied:
- Expansion of pattern.
- Use of low density (700 kg/m3) and low VOD (3000 m/s) explosive.
- Use of low density/low VOD explosive with expanded pattern.
Expanded Pattern
The pattern was expanded by 16-52%, as summarised in Table 4, to give the same powder factor for all three domains.
| Domain | ||||||
|---|---|---|---|---|---|---|
| Blast Design | 1 | 2 | 3 | |||
| Parameter | old | new | old | new | old | new |
| Burden (m) | 4.8 | 5.9 | 5.1 | 5.8 | 5.6 | 6.0 |
| Spacing (m) | 5.5 | 6.8 | 5.9 | 6.6 | 6.4 | 6.9 |
| Powder Factor | 0.30 | 0.19 | 0.24 | 0.19 | 0.22 | 0.19 |
| (kg/t) | ||||||
|
Change
in |
52 | 27 | 16 | |||
| Pattern (%) | ||||||
The simulation results, summarised in Table 5 by the final lump/fines ratio and secondary crusher circulating load, suggest that expanding the pattern is expected to increase the final lump/fines ratio and the circulating load. The greatest change is seen in Domains 1 and 2 which contain higher proportions of hard ore.
| Domain | Blast | Lump/Fines | Circulating |
|---|---|---|---|
| Design | % | Load, tph | |
| 1 | old | 49/51 | 851 |
| new | 56/44 | 1028 | |
| 2 | old | 51/49 | 823 |
| new | 55/45 | 923 | |
| 3 | old | 47/53 | 651 |
| new | 49/51 | 705 |
Low Density/Low VOD Explosive
Based purely on the manner in which commercial explosives deliver energy into rock, the general explosive/rock interaction criteria would suggest that Marandoo, with predominantly soft rock, should be using diluted ANFOs which have a very low VOD. The usage of low VOD explosive with the same patterns, will alter the partition of explosive energy to reduce the percentage of shock energy whilst maintaining the heave energy. Therefore the usage of low VOD explosive is aimed not only at increasing the lump to fine ratio but also improving muckpile looseness. However, these aspects should be investigated further. The terms hard and soft rock relate not only to the intact rock strengths and mode of failure but also to the spacing and condition of the jointing. To test this hypothesis an explosive with a nominal density of 700 kg/m3 and 3000 m/s VOD (Relative Weight Strength of 98) was simulated.
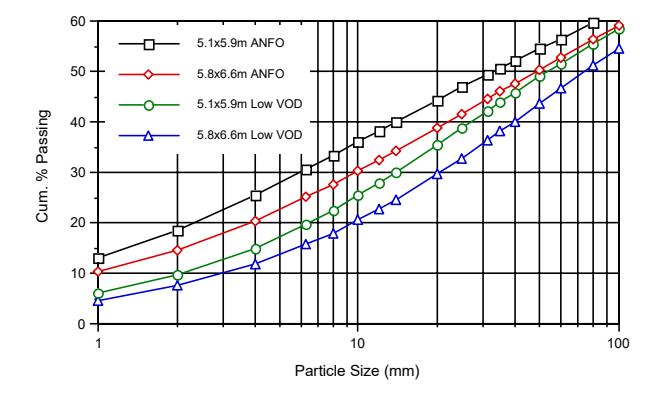
The simulation results suggest that the low density/low VOD explosive has a much more pronounced effect on the lump/fines ratio, as shown in Table 6, compared to the pattern expansion. The change in explosive type represents an eight percent improvement in lump production, for a moderate increase in circulating load. The reason why the change in explosive type makes such a large difference is that the ROM size distribution is coarser by virtue of a reduction in fines (<6.3mm), whilst the natural lump has increased a few percent. The benefit of lower fines therefore translated almost directly to higher lump/fines ratio.
Expanded Pattern & Low Density/Low VOD Explosive
Simulations were also carried out on the combined effect of expanding the pattern whilst using the low density/low VOD explosive. Figure 6 illustrates the effect on the ROM. The results showed that there would be a further improvement in lump/fines ratio over that already achieved in just changing the explosive type or pattern, at the expense of a major increase in crusher circulating load. Domain 1 would yield 62/38 at 1210 tph, Domain 2 61/39 at 1082 tph and Lower Flats 56/44 at 904 tph. Note that the greatest change is in the hardest ore type. The increased circulating load would require the use of both secondary crushers in production.
| Bench | Domain | Blast | Lump/ | Circulating |
|---|---|---|---|---|
| Design | Fines, | Load, | ||
| % | tph | |||
| 750/604 | 1 | old | 49/51 | 851 |
| new | 58/42 | 1008 | ||
| 200/227 | Flats | old | 51/49 | 823 |
| Upper | ||||
| 2 | new | 59/41 | 988 | |
| 300/212 | Flats | old | 47/53 | 651 |
| Lower | ||||
| 3 | new | 55/45 | 818 |
The simulations of blasting, crushing and screening using a dual circuit approach to represent the soft and hard ore separately give realistic results and confirm the trend with ore hardness as expected from geologists logging.
On the basis of simulations, there is scope to improve the lump/fines ratio by changing the blast pattern. Alternatively, the use of a low density low VOD explosive should significantly reduce the fines in the ROM which represents an eight percent improvement in the lump/fines ratio. The impact of the changes in ROM size distribution on excavation and productivity will need to be considered.
KCGM CASE HISTORY
Model Parameters
Blasting
Ore Characteristics
The blast model requires the UCS, Young's modulus, in-situ block size and joint spacing of the rock. For the domain used for this study rock samples were taken to determine the first two parameters at the JKMRC. In-situ block size and joint spacing were provided by mine staff. The resulting values were:
| Young's Modulus | 80 GPa | ||
|---|---|---|---|
| UCS | 100 MPa | ||
| Joint Spacing | 0.8 m | ||
| In situ Block Size | 1.103 m | ||
Blast Model Calibration
The blast design details used by the company were provided by mine staff (Table 7) and were put into the blast model. The model was then run and a ROM size distribution predicted. This was compared to that provided by Split analysis of images of ROM on the back of haul trucks. Reasonable correspondence was obtained (Atasoy et al., 1998, Kanchibotla et al, 1998 and Valery et al., 1999).
| Burden (m) | 5 |
|---|---|
| Spacing (m) | 5.8 |
| Hole depth (m) | 11.3 |
| Hole diameter (mm) | 165 |
| Column charge length (m) | 7.2 |
| Explosive | Energan2620 |
| Density (kg/m3) | 1100 |
| VOD (m/s) | 4550 |
| Powder factor (kg/t) | 0.58 |
Crusher and Mill Model Validation
The comminution circuit at Fimiston is shown in Figure 7.
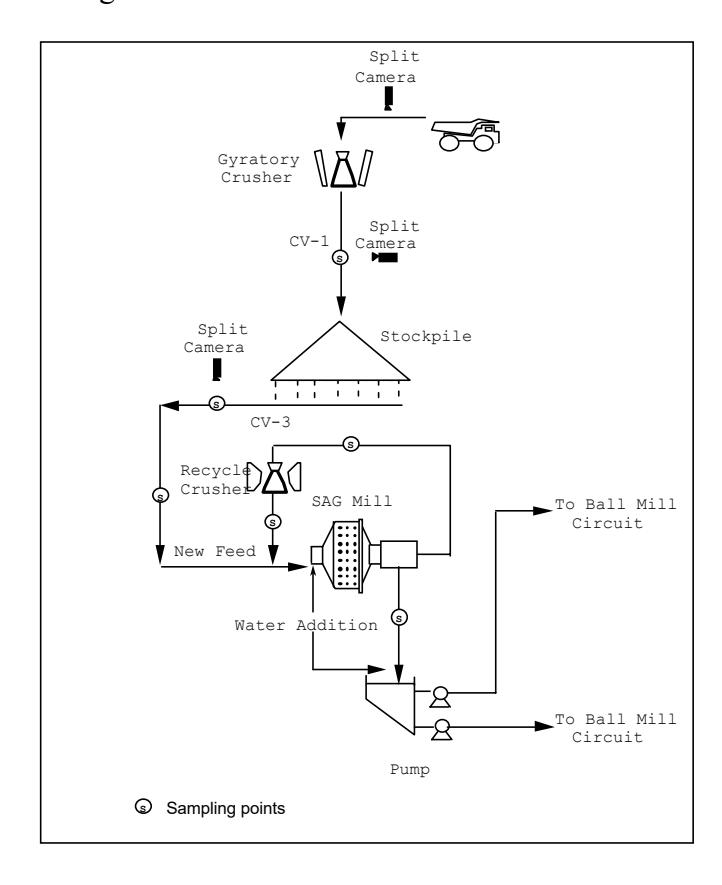
The primary crusher, mill and recycle crusher models were developed from real plant data. During the last 5 years these models have been successfully applied at KCGM to optimise their grinding circuit and hence there is a high degree of confidence that they do mimic the general performance characteristics of the comminution circuit (Nelson et al., 1996).
If the primary crusher model is accurate, as well as the ROM sizings predicted from the blast model, then it would be expected that if the current comminution circuit were simulated with the SAG mill feed size predicted from the primary crusher model a lifelike throughput should be predicted. To test this the blast and comminution circuit models were combined and such a simulation run. The SAG mill model was set to run with a maximum filling of 30%. The simulation results are shown in Table 8 together with the observed results of industrial survey of the circuit. It can be seen that the results are in good agreement and hence confirm the accuracy of the blast and comminution plant models.
| Observed | Predicted | ||
|---|---|---|---|
| Feedrate (t/hr) | 1250 | 1250 | |
| Feed F80 (mm) | 130 | 118 | |
|
Trommel undersize P80
(mm) |
3.06 | 3.21 | |
|
Recycle crusher feedrate
(t/hr) |
276 | 345 | |
|
Recycle
crusher F80 (mm) |
63.6 | 60.7 | |
|
Recycle
crusher P80 (mm) |
15.0 | 15.5 | |
|
Mill filling (%)
Mill power (kW) |
29.5
12717 |
30
12750 |
|
Simulations
Having validated the models using the current design, the blasting, crushing and sag mill models were linked together and changes made to the blast design to determine their effect on mill performance.
Blast Design Details
Two different blast designs were chosen to illustrate their effect on mill throughput. Details of these designs (Designs 3 and 9) are given in Table 9. Design 1, which is the mine's current design is also given for comparison. It can be seen that design 3 and 9 use different explosives and powder factors compared to the current situation.
| Design1 | Design3 | Design9 | |
|---|---|---|---|
| Burden (m) | 5 | 5 | 4 |
| Spacing (m) | 5.8 | 5.8 | 5 |
| Hole depth (m) | 11.3 | 11.3 | 11.3 |
| Hole diameter (mm) | 165 | 165 | 165 |
|
Column
charge |
7.2 | 7.2 | 7.2 |
| length (m) | |||
| Explosive | Energan26 | Powergel | powergel |
| 20 | gold | gold | |
| Density (kg/m3) | 1100 | 1250 | 1250 |
| VOD (m/s) | 4550 | 6000 | 6000 |
| Powder factor (kg/t) | 0.58 | 0.66 | 0.96 |
Effect on ROM Sizing
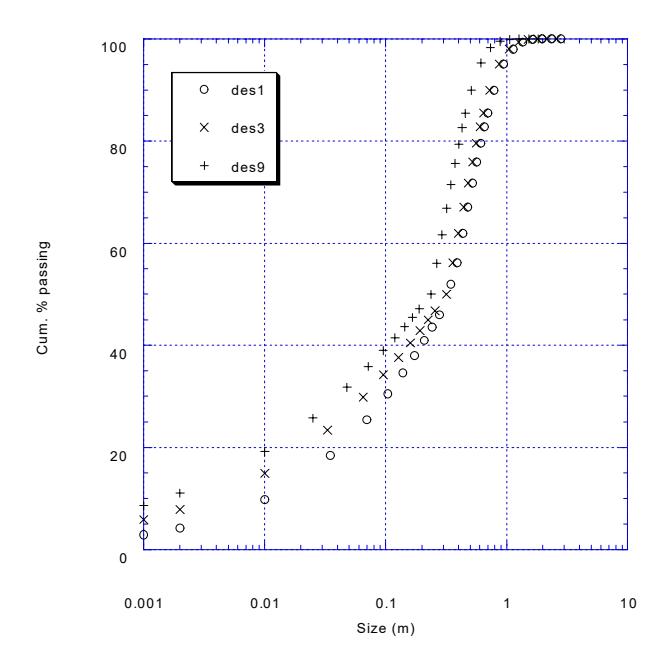
The predicted size distributions of the ROM from all 3 designs are shown in Figure 8. It is immediately apparent that the new designs have produced more fines as would be expected from the higher powder factors and higher VOD explosive used. It should be noted that Design 3 has only minimal effect at the coarse end of the distribution whereas Design 9 has a marked one due to the changes in burden and spacing.
Effect on Crusher Product
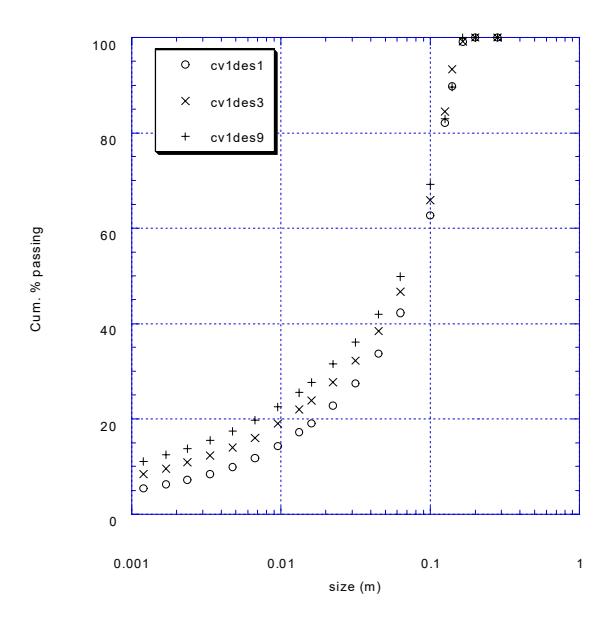
The results of simulating the various ROM distributions after they have passed through the primary crusher are shown in Figure 9. Interestingly the differences between the ROM distributions are significantly reduced post crusher, particularly in the +100 mm fraction. This is due to the typical action of primary crushers which generate very little fines but tend to crush oversize rocks into 2-3 size fractions immediately below the closed side setting. However, despite the reduction in the differences between the ROM distributions that result from primary crushing, there still exist some significant differences in the crusher product distributions. Notably there is an increase in the amount of -10mm with the new designs, a steepening of the distribution in the +100mm fraction and a reduction in the gradient in the -100+25mm size range.
In addition to the effect on product size it is also noteworthy that due to the reduction in top size in Design 9, primary crusher throughput capacity will increase. Alternatively, the primary crusher gap could be reduced with this design.
Effect on Mill Performance
Mill performance is usually evaluated in terms of throughput, specific energy (kWh/t) and final grind size. For these simulations the mill was run at a constant mill filling and speed, and hence constant power, so that the effect on throughput could be gauged. The results are shown in Table 10 for the 2 new designs (3 & 9) together with the current design (1).
| Design |
Feedrate
(t/hr) |
P80
(mm) |
P50
(mm) |
Power
(kW) |
kWh/t |
|---|---|---|---|---|---|
| 1 | 1250 | 3.21 | 0.69 | 12750 | 10.2 |
| 3 | 1420 | 3.13 | 0.65 | 12755 | 9.0 |
| 9 | 1480 | 3.11 | 0.63 | 12749 | 8.6 |
As can be seen a significant increase in throughput is obtained with Design 3 with further, though proportionately much less improvement with Design 9. This is despite the 50% increase in powder factor in Design 9 compared with Design 3. The reasons for the increased throughput are twofold. Firstly both new designs generate more -10mm material which does not need to be ground and is essentially "free" throughput for the mill. Secondly the changes in the +50mm size range lead to marginally lower amounts of so-called "critical" size in the feed and a narrower distribution in the +100mm media size range, with less unnecessary oversize.
An increase in powder factor to 0.75 was implemented by KCGM and throughput rates were increased to 1350 – 1400 t/h. Experience has shown that feed size distribution is one of the main factors in affecting the performance of ag and sag mill circuits (Valery and Morrell, 1997). It is also clear that blasting can affect the ROM size distribution. Although the primary crusher tends to limit the effect of a change in the ROM distribution this simulation study has indicated that enough remains to significantly affect the performance of the mill.
CONCLUSIONS
Whether mining is followed by crushing and screening steps or SAG milling, simulations indicate that considerable potential exists for increasing throughput or improving product quality by modifying blast design. The JKMRC models are relatively simple to calibrate and good enough to reproduce the observed performance trends and interaction between the mine and subsequent comminution steps. These models have been successfully used in mine to mill optimisation projects at several mine sites such as Minera Alumbrera (Argentina), BHP Newman (Australia), Cadia Mine (Australia), Century Zinc (Australia), Ernest Henry Mining (Australia), Highland Valley Copper (Canada), Cerro Colorado (Chile), Escondida (Chile), OKTedi Mining (Papua New Guniea), Porgera Joint Venture (Papua New Guniea), and others.
ACKNOWLEDGEMENTS
The authors would like to acknowledge Hamersley Iron and KCGM for their financial and site support in conducting this research as well as the additional financial support of the sponsors of the AMIRA P483 project.
REFERENCES
- Andersen, J.S., (1988 ) Development of a cone crusher model. M.Eng.Sc. Thesis, University of Queensland, JKMRC, Brisbane.
- Atasoy Y., Brunton I., Tapia-Vergara F., Kanchibotla S. (1998). Implementation of Split to estimate the size distribution of rocks in mining and milling operations, Proc. Mine to Mill Conference, AUSIMM, Brisbane, 1998.
- Cunningham, C.V.B., (1987). Fragmentation estimations and the Kuz-Ram model - Four years on, Proc. 2nd Int. Symp. on Rock Fragmentation by Blasting , Colorado, 475-487.
- JKMRC/AMIRA Project P483 Optimization of Mine Fragmentation for Downstream Processing , 2nd Progress Report, 1997.
- Kanchibotla, S S., Morrell, S., Valery, W and O'Loughlin,P., (1998), Exploring the effect of blast design on SAG mill
- throughput at KCGM, Proc. Mine-Mill Conf., Brisbane.
- Kojovic T, Kanchibotla S S, Poetschka N, Chapman J., (1998), The effect of blast design on the lump:fines ratio at Marandoo iron ore operations, Proc. Mine-Mill Conf., Brisbane.
- Kuznetsov, V.M., (1973). The mean diameter of fragments formed by blasting rock, Soviet Mining Science , 9(2), 144-148.
- Leung, K., 1987. "An energy based ore specific model for autogenous and semiautogenous grinding", Ph.D. Thesis, The University of Queensland, JKMRC, Australia.
- Napier-Munn, T.J., Morrell, S., Morrison, R.D., Kojovic, T., (1996 ). Mineral Comminution Circuits-Their Operation and Optimisation , JKMRC, The University of Queensland, Australia.
- Morrell, S., and Stephenson, I. (1995) Slurry discharge capacity of autogenous and semi-autogenous mills and the effect of grate design. International Journal of Mineral Processing, 46, p. 53-72.
- Morrell, S. (1996a and 1996b) Power draw of wet tumbling mills and its relationship to charge dynamics - Parts 1 and 2. Transactions of the Institution of Mining and Metallurgy, 105 (Section C), p. C43- C62.
- Morrell, S., and Morrison, R.D. (1996) AG and SAG mill circuit selection and design by simulation. International Conference on Autogenous and Semiautogenous Grinding Technology, 2, p. 769-790, Vancouver, Canada.
- Napier-Munn et al (1996), Mineral comminution circuits, JKMRC Monograph Series in Mining and Mineral Processing 2, Ed. Napier-Munn, T.J.
- Narayanan S S. and Whiten W.J. (1988), Determination of comminution characteristics from single particle breakage tests and its application to ball mill scale-up. Trans. Inst. Min. Metall, 97, C115-124.
- Nelson, M., Valery Jnr., W., and Morrell, S. (1996) Performance characteristics and optimisation of the Fimiston (KCGM) SAG mill circuit. International Conference on Autogenous and Semiautogenous Grinding Technology, 1, p. 233-248, Vancouver, Canada.
- Valery Jnr., W., Kojovic, T., Tapia-Vergara, F. and Morrell, S. (1999) Optimisation of blasting and sag mill feed size by application of online size analysis. IRR Crushing and Grinding Conference, Perth, WA 29-31 March.
- Valery Jnr., W. and Morrell, S. (1997) A dynamic and steady-state model of autogenous and semi-autogenous mills. International Conference Comminution '98, in Brisbane, Australia, from February 16-18, 1998.
- Whiten, W.J., 1974. A matrix theory of comminution machines, Chem.Eng.Sci. No. 29: 585-599.