



The content on this page was automatically generated from the PDF publication document and may contain errors or inaccuracies. Please refer to the original PDF for the most accurate information.
PERFORMANCE CHARACTERISTICS AND OPTlMlSATlON OF THE FlMlSTON (KCGM) SAG MILL CIRCUIT
M. Nelson (1) , W. Valery Jr. (2) , S. Morrell (3) 1- Process Development Superintendent, Fimiston Plant, KCGM, Western Australia, 2- Ph.D. Research Scholar, JKMRC, 3)- Manager Comminution Research, JKMRC, Queensland, Australia.
ABSTRACT
In August 1995, Kalgoorlie Consolidated Gold Mines Ltd. (KCGM) expanded its Fimiston plant operations located in Kalgoorlie, Western Australia, to provide a total plant throughput of 11.6Mtpa. Part of the expansion included increasing the refractory sulphide ore circuit throughput from 5Mtpa to 7.5Mtpa. This was achieved by the installation of a 12MW SAG mill with a diameter of 10.97m (36ft). The mill, when built, was the largest SAG mill operating at any existing Australian mine.
To aid in commissioning and optimising the mill, the Julius Kruttschnitt Mineral Research Centre (JKMRC) and plant staff conducted extensive surveys of the grinding circuit. Using the JKMRC's process simulator JKSimMet, these data were used to construct mathematical models of the circuit. Simulations were then run to determine the best operating strategy to achieve design throughput and product specifications.
Circuit alternatives such as the introduction of a recycle crusher and the effect of manipulating the feed particle size distribution were of particular interest due to the secondary crushed material that the mill was fed with (F80 of 40 to 75mm).
This paper describes the performance characteristics of the Fimiston grinding circuit under a range of operating conditions together with the results of the optimisation programme.
INTRODUCTION
Kalgoorlie Consolidated Gold Mines (KCGM), located 600km East of Perth, Western Australia, operates three gold plants and a roaster, processing ore from its underground mine (Mt Charlotte) and open cut pit (Super Pit). The company produces approximately 700,000 ounces of gold per year, treating a total of 11.6Mtpa ore which makes it currently Australia's largest gold producer.
KCGM's Fimiston plant was originally commissioned in 1989 to process 2Mtpa of sulphide ore from the Super Pit. An expansion in 1991 enabled throughput to increase to 5Mtpa. In 1994195, a second expansion was undertaken, primarily to replace lost production from KCGM's Oroya mill which was demolished to allow for expansion of the open cut operation. This second expansion included the installation of a new 12MW SAG mill, 10.97m (36ft) diameter, fed from an existing secondary crushing plant and followed by two existing ball mills.
In August 1995, KCGM enlisted the Julius Kruttschnitt Mineral Research Centre (JKMRC) to work with its metallurgical staff and initiated a mill performance optimisation programme for the Fimiston sulphide milling circuit to ensure that it reached its maximum performance at the earliest possible time. This paper describes the optimisation programme and the conclusions drawn from test work and simulation studies that have been conducted since the commissioning of the circuit.
Description of Sulphide Circuit
Ore mined from the Super Pit is essentially a refractory sulphide, composed of complex lodes and sheared and bleached Golden Mile Dolerite, as well as Paringa basalt containing pyrite. The ore has a relatively homogenous distribution of pyrite. The gold is present as fine particles, either locked within pyrite grains or distributed along grain boundaries and fracture filling.
A small amount of gold is present as fine native gold or alloyed as gold-tellurides ( 5%).
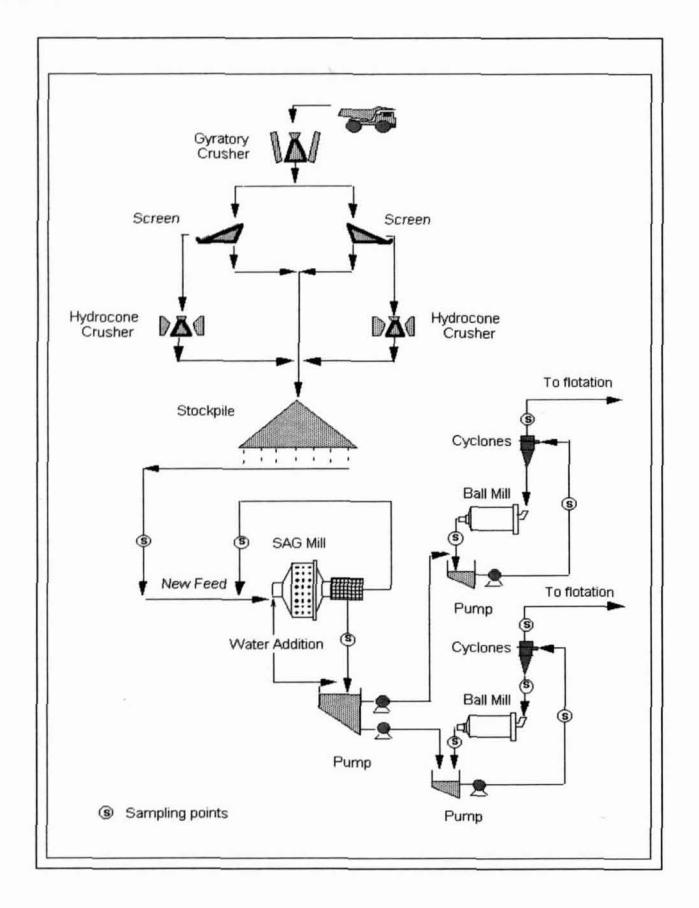
Run of Mine ore is crushed to -150mm by an Allis Chalmers 54/74 gyratory crusher. Ore is then transferred to secondary crushers after scalping of the -50mm material. The secondary crushers are Allis Chalmers 13184 Hydrocones, producing a product with an F80 between 40 and 75mm. This product is stockpiled as SAG mill feed. The SAG mill was supplied by Fuller and measures 10.97m in diameter. It is driven by two constant torque variable speed Siemens electric motors each rated at 6000kW. Power is supplied to the motors from a cycloconverter unit to provide a controlled speed variation of the mill. Product from the SAG mill passes through internal grates onto a trommel screen which scalps +7mm material and returns it to the SAG mill feed conveyor. Trommel undersize is pumped to two parallel overflow ball mills in closed circuit with cyclones. The ANI-Ruwolt ball mills measure 5.5m x 7.5m (diameter x length). The cyclones are Krebs 660mm. Cyclone overflow is screened to remove trash and then fed to a flotation circuit which consists of three rougher columns and two parallel banks of Wemco scavenger and cleaner cells. Concentrate is filtered for transport to a roaster while flotation tails continue on to a conventional carbon-in-leach circuit. A more detailed description of the grinding circuit equipment is provided in Appendix 1.
A schematic of the Fimiston comminution circuit is given in Figure 1. Of particular interest is the fact that the SAG mill has one of the largest diameters in the world and additionally is fed with relatively fine feed, similar to that used at Kidston (Needham and Folland, 1994).
DESIGN SPECIFICATIONS
The Fimiston SAG mill circuit was designed by Orway Mineral Consultants and Fluor Daniel Wright Ltd. Pilot plant test work in a 6' x 2' mill was used to determine circuit configuration, power requirements and to assess feed sensitivity to ore hardness and feed size variation.
Details of the relevant design specifications are given in Table 1
COMMISSIONING
Although this paper concentrates mainly on the optimisation programme which was carried out after commissioning, some of the experiences gained during this period are of interest. The plant was commissioned by Minproc Engineers Ltd, under the direction of KCGM. During the commissioning of the comminution circuit, the JKMRC were on site collecting data on the SAG mill performance as the throughput was built up to design levels.
What became apparent during the early commissioning stage was that the design throughput was not being achieved at predicted ball charge levels. A substantially higher level of balls was required.
| SAG Mill | |
|---|---|
| Feed rate, tlh | 950 |
|
l~eed F,,
mm |
50-80 |
| l~vera~e power, kW | 8600-9600 |
| lBall charge, % | 8-1 0 |
| I~otal charge, % |
24
1 |
| Speed, % critical | 72-75 |
|
T,,
mm |
0.38-3.0 |
| kWh/t | 9.0-10.1 |
| l~all Mills | I |
| Power, kW | 3300-3500 |
| Ball charge, % | 27-28 |
| Ball size, mm | 50 |
| I~peed, % critical |
68
I |
|
Final product P,,
micron |
106 |
| kWh/t | 6.9-7.4 |
| Ore Characteristics | |
| IBond Ball Mill W.I., kWh/t |
14.6
1 |
| (Bond Rod Mill W.I., kWhlt |
19.4
1 |
This is illustrated in Table 2 where some of the mill performance data collected during stable periods are given.
|
Feed rate
Vh |
Ball load
% 1 |
I
TotaTd |
Power draw
1 k W |
|---|---|---|---|
It can be seen from Table 2 that with 11% balls and a total charge of 20-22% only 475t/h was achieved compared to a design expectation of 950t/h. Increasing the ball charge to 12.5% raised power draw to design levels but throughput only increased to 605-620t/h. Only when the ball charge was raised to 15% and rock charge kept very low at 1- 2%, was design or better throughput achieved. However, running the mill under these conditions presented a number of operational difficulties:
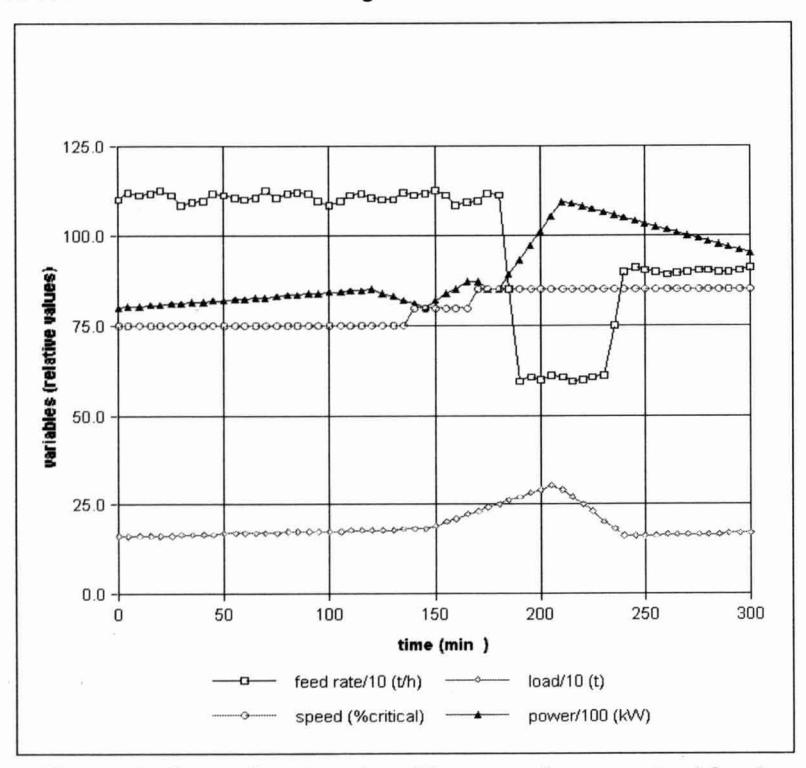
Firstly, any attempts to increase the rock charge further caused a rapid overloading of the mill. Mill speed adjustment was unsuccessful in controlling these overloads and feedrate had to be reduced. This is illustrated in Figure 2.
Excessive wear of the liners and lifters was observed after only two weeks of operation. Additionally, breakage of the discharge grates occurred as well as heavy peening causing a reduction in open area and flow restrictions.
This was a direct results of ball impact due to lack of protection which would have been present with a high rock charge as is found in more conventional (primary crushed feed) SAG operations.
The third problem was related to the ball mill circuit which, as will be seen later in the paper, generated a product much coarser than expected due in part to the coarse product the SAG mill was producing as a result of its low rock charge.
OPTlMlSATlON OF THE GRINDING CIRCUIT
The initial goals that were set for the optimisation programme were threefold:
- >>maintain throughput consistently at or above 1017tlh ie. 67tlh above the original design in order to meet new production targets
- >%find the conditions which would reduce the damage caused to the lifters and liners as a result of running with a high ball charge and low rock charge
- >>improve the ball mill circuit performance so as to reduce the final grind size to nearer design levels.
It was decided to conduct the optimisation programme in an iterative manner. This initially entailed conducting benchmark surveys to establish the performance characteristics of the plant followed by a modelling and simulation stage in which various strategies were evaluated. Those which showed most promise were then put into effect after which they were evaluated using further plant surveys. The process was then repeated until the goals were achieved.
The programme contained a number of iterations, the main ones of each will be discussed in the following sections.
Benchmark Surveys
Immediately after the formal completion of commissioning, test work was conducted to determine the following:
- i) Full mass flow and size balance around the SAG and ball mill circuits
- ii) Power response of the SAG and ball mills
- iii) Breakage characteristics of the feed ore
Mass flow and size balances: Based on the experience from the commissioning period it had been found that throughput targets could only be met with a 15% ball charge and a very low rock charge. It had also been established that as the closed side setting of the secondary crusher was reduced, higher throughputs were obtained. With the secondary crusher gap set as small as practicable and the ball and total charge at optimum levels 1070t/h was achieved. A full survey under these conditions was then conducted providing the mass flow and size balance shown in Table 3. Of particular note is the relatively low SAG mill power draw and coarse final product size of 230mm (design = 106mm).
| SAG Mill | ||
|---|---|---|
| Type of feed | all secondary crushed | |
| Feed t/h exp. | 1,070 | |
| F80(mm)exp. | 39 | |
| F20(mm)exp. | 3.3 | |
| Power (kW) | 8,395 | |
| Ball load (%) | 15 | |
| Total load (%) | 16.1 | |
| T80(mm) calc | 1.9 | |
| T50(mm) calc | 0.36 | |
| %<106mm | 35 | |
| kWh/t | 7.85 | |
| Ball Mill (1) | ||
| Power (kW) | 3,875 | |
| Recycle load (%) | 300 | |
| Cyc. overflow P80 (mm) | 230 | |
| kWh/t | 7.24 | |
| Overall kWh/t (2) | 15.49 | |
| Operating Work Index (3) | 24.52 | |
- (1) average for 1 ball mill circuit
- (2) includes 0.4 kWh/t for 2 secondary crushers
- (3) assumes secondary crusher feed F80 of 130mm
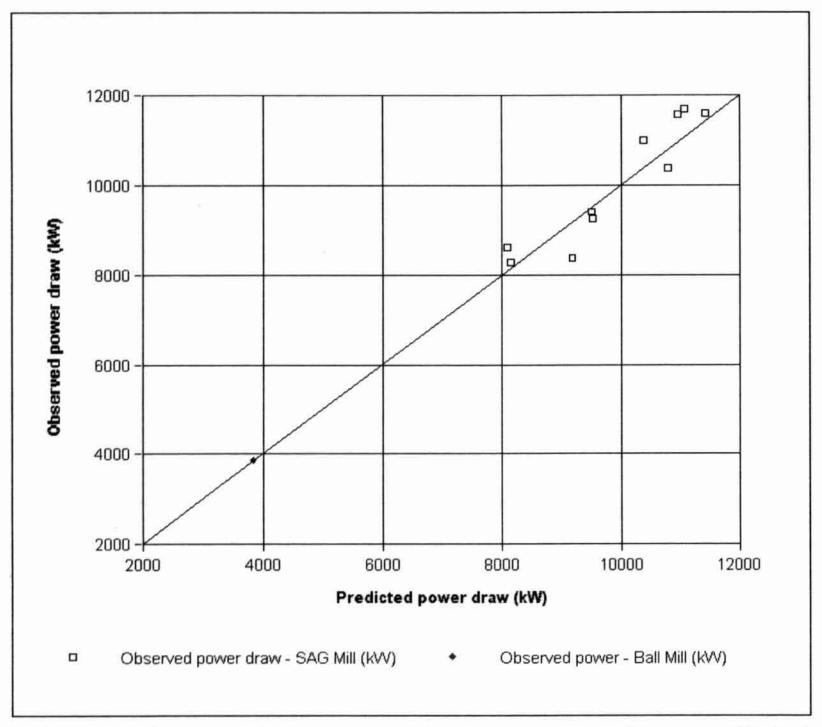
Power Response: To determine whether the power response of the SAG and ball mills was as expected and to determine what loading conditions could be reached before exceeding the motor rated power, a series of crash stops was conducted. This yielded the data shown in Tables 4 and 5. The power data refer to motor input power. Load measurements were conducted by measuring the position of the charge at rest and relate to the filling of the mill cylindrical section. This was done by measuring the width of the charge at three different positions as well as cross-checking by measuring the distance of the charge below the feed and discharge end trunnion liners. Ball loads were determined from grind-outs and measuring the level of balls. The data were compared to the JKMRC power model prediction (Morrell, 1996), the results from which are given in Figure 3. It can be seen from this figure that the observed power draw of the mills agrees closely with the power model predictions (R2 = 0.96).
| Survey# | Power | Power | Mill | Total | Ball | Mill |
|---|---|---|---|---|---|---|
|
Ob
served |
Pre
dicted |
Speed | Charge | Charge | Disch. | |
| kW | kW |
% criti
cal |
% | % | %solids | |
| Survey 1 | 9.255 | 9,515 | 72.5 | 21.6 | 13 | 65.9 |
| Survey 2 | 10,374 | 10,777 | 77 | 25.2 | 13 | 63.3 |
| Survey | Power | Power | Mill | Ball | Mill | Mill |
|---|---|---|---|---|---|---|
| Observed | Predicted |
Speed
% criti- cal |
Size |
Load
% |
Disch.
% sol- ids |
|
| kW | kW | |||||
|
Survey
1 |
3,864 | 3,823 | 66.7 | 80 | 38.7 | 72 |
Ore Characterisation: To establish whether the current ore being treated was typical of that used in the pilot programme on which the design was based, JKMRC AGISAG ore breakage characterisation tests were conducted on the feed samples. These were compared to those conducted on the pilot ore. The results are shown in Table 6.
| Parameter |
Pilot Ore
I |
Current Ore
I 31.6 1 |
|
|---|---|---|---|
|
Axb
1 |
31.2 | ||
The ore characterisation procedure comprises a series of impact breakage tests which generate 2 parameters - A and b -the product of which relates to their impact breakage resistance. A turnbling test is also conducted which generates a further parameter - ta - that indicates the rock's resistance to abrasion breakage. It can be seen from Table 6 that the parameters are very similar for the 2 samples, indicating similar breakage characteristics.
Initial Simulation Study
Using the benchmark data, mathematical models of the SAG mill, ball mills and cyclones were constructed and a range of optimisation strategies were then evaluated using the JKMRC's comminution circuit simulator - JKSimMet. From these simulations and analysis of the performance characteristics of the SAG and ball mill circuits, it was decided that the most promising course of action would be to by-pass the secondary crushers and feed the SAG mill with primary crushed material. By doing so, the expectation was that:
- i) the SAG mill ball charge could be reduced below 15%
- ii) the total mill charge (rock and balls) could be increased to 25-30%
- iii) the transfer size to the ball mill circuit could be reduced thus increasing ball mill capacity
- iv) the final product size from the ball mill circuit would be reduced.
Initial Circuit Modifications
Following the initial simulation study, the secondary crushers were by-passed and primary crushed feed used in the SAG mill.
Unfortunately, the first trial met with limited success as chutes, feeders and conveyors were unable to cope with the much increased rock size. However, the results were promising enough to modify the bottlenecks to allow primary crushed material to be fed.
Evaluation of Circuit Performance for Primary Crushed Feed
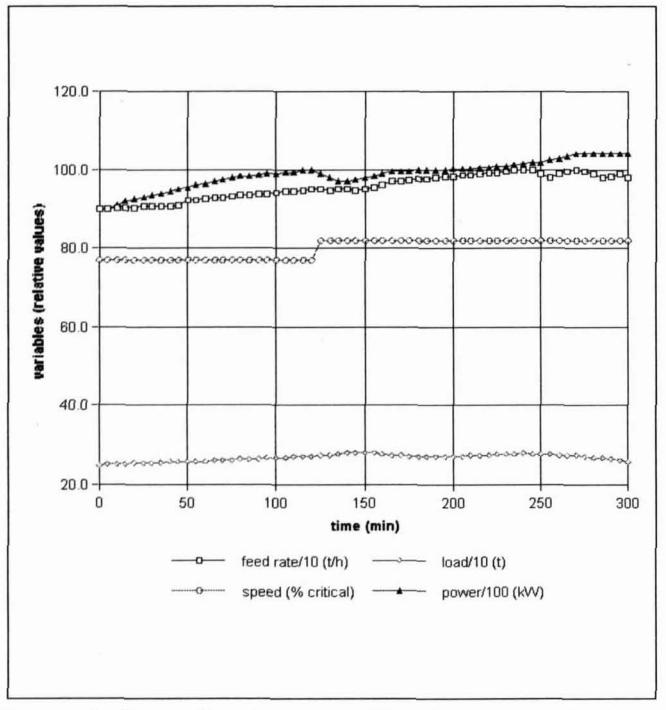
With chutes and feeders modified to allow feed of coarse material, trials were restarted with primary crushed feed. With the ball charge reduced to 13.0% from the original 15.0% and a F80 of 136mm it was found that the mill could be run for prolonged periods of time at 900-950t/h with a total charge in the range of 24-28%. Of particular note under these conditions was the quieter operation of the SAG mill, its more stable operation, the much finer ball mill product and lower overall operating work index compared to the secondary crushed feed condition. To illustrate the mill's stable operation, trends typical of its performance under these conditions are shown in Figure 4. Those operating conditions are shown in Table 7.
| No. of secon | ||||
|
crushers by-
~assed |
one
1 |
|||
| SAG Mill | ||||
|
Pebble recy-
cle |
Yes | Yes | no | |
| l~eed tlh exp. 1 | 1,070 |
91 8
1 |
1,033
1 |
|
| Power (kW) | 8,395 | 11,610 | 11,571 | |
| Ball load (%) | 15 | 13 | 13 | |
| Total load (%) | 16.1 | 28.6 | 25.8 | |
| I~80(mm) calc 1 | 1.9 | 1.85 | 1.25 | |
| T50(mm) calc 1 | 0.36 | 0.23 | 0.17 | |
| %<106mm |
35
I |
39.2 | 43.4 | |
| kWh1t | 7.85 | 12.65 | 11.2 | |
|
(I)
Ball Mill |
||||
| Power (kW) | 3,875 | 3,561 | 3,503 | |
| Recycle load | ||||
|
Cyc. overflow
P80 (mm) |
230 | |||
| 7.24 | 7.76 | 7.51 | ||
| 20.41 | 18.71 (3) | |||
|
Operating
Work Index |
24.52 | 23.47 | 19.89 |
- I. average for I ball mill circuit
- 2. includes 0.4 kWh/t for 2 secondary crushers
- 3. includes allowance for SAG pebbles stockpiled during the survey
- 4. includes 0.2 k Wh/t for only I secondary crusher
- 5. assumes secondary crusher feed F80 of 130mm
Simulations had also shown that a recycle crusher would result in higher throughputs as would the generation of a bi-modal feed size to the SAG mill ie. a distribution with limited quantities of intermediate size material (25-50mm).
It was therefore decided to firstly run the mill by not returning trommel oversize (survey 9). This was expected to confirm the beneficial effect of crushing mill pebble product. In addition, a trial was also conducted in which only one secondary crusher was bypassed whilst the other was set at approximately 20mm (survey 10). With this configuration, simulations indicated the size distribution would shift towards the desired bi-modal shape.
Both conditions resulted in higher throughputs and finer final product sizes as can be seen from Table 7. It is interesting to note that whereas when both secondary crushers were by-passed, a total charge in the range 24-28% was easily maintained. With only one secondary crusher by-passed the mill was only able to maintain a total charge of 19-21%. This charge level is almost exactly midway between the optimum for the fully secondary crushed and primary crushed feed conditions. Also clearly apparent from Table 7 is that the overall operating work index reduces considerably when the SAG mill is fed with primary crushed material, particularly with a bi-modal feed distribution (survey 10).
When both secondary crushers were by-passed and SAG tromme1 oversize was stockpiled, rather than recycled, the SAG mill was able to operate easily at relatively high rock charges, thus giving maximum protection to lifters and liners (survey 9). Its operational work index was marginally the lowest after allowance for the stockpiling of the trommel oversize. This trend is expected to be maintained should the trommel oversize be crushed and recycled.
The data in Table 7 were obtained from surveys during steady state conditions. However, the best indications of performance can only be obtained over prolonged periods of operation. Table 8, therefore, compares the average on-line production rate operating with all secondary crushed feed, all primary crushed and the blend of feed when only one secondary crusher was by-passed.
It can be seen from Table 8 that the operation with a blend of primary and secondary crushed feed resulted in the highest tonnage rate compared to the operation with only secondary or only primary crushed feed. The standard deviations which are shown in brackets also indicate a more stable operation with the blend of primary and secondary crushed feed. This performance prompted the plant to be operated full time in this manner.
| No. of days |
Total daily on
line tonnage |
Average on
line tonnage |
|
|---|---|---|---|
| Secondary | |||
| crushed feed | 31 | 22553 (3088) | 1001 (82) |
| Primary crushed | |||
| feed | 4 | 2041 1 (3347) | 928 (29) |
| Primary + Sec | |||
| ondary | 29 | 23887 (1 373) | 101 9 (58) |
CONCLUSIONS AND FUTURE DIRECTIONS
When the Fimiston SAG mill operates with secondary crushed feed, peak throughputs can be obtained only with the combination of a high ball charge and a very low rock charge. This condition was found to be difficult to control and resulted in excessive lifter and liner wear. By running the SAG mill with a relatively coarse though bi-modal feed size distribution, comparable feed rates were obtained but with a high rock charge and much lower operating work index.
At the time of writing this paper, a mobile crusher has been temporarily installed to crush trommel oversize which will then be returned to the SAG mill. Following results from this trial, a permanent recycle crusher installation will be reviewed.
ACKNOWLEDGMENTS
The authors would like to acknowledge the assistance of the metallurgical staff at KCGM for their assistance during the test work period and thank the management for allowing publication of the data.
REFERENCES
Morrell, S. "Power draw of wet tumbling mills and its relationship to charge dynamics - Parts 1 and 2". Trans. Instn. Min. Metall. (Sect. C: Mineral Process. Extr. Metall.), 105, 1996, C43-C62.
Needham, T. M. and Folland, G. V. "Grinding circuit expansion at Kidston Gold Mine". SME Annual Meeting. Albuquerque, New Mexico, USA, February 14-17, 1994.
APPENDIX 1
Fimiston SAG mill:
| Manufacturer:FullerDiameter inside shell:10.970 mDiameter inside liners:10.797 mBelly length inside liners:4.417 mCentre line length:6.920 mMill volume:490 m³Grate aperture:36 grates of 40 mmTotal grate open area:5.76 m²Fraction of grate open area:6.09%Trommel aperture:7 x 24 mmBall charge (% mill volume):varied from 5 to 15%Ball top size:125 mmMill speed:variable from 7.65 to 10.2 r.p.m. (60-80% critical) |
|---|
| Fimiston Ball mills: 2 operating Manufacturer: ANI Ruwolt (overflow) Diameter inside shell: 5.49 m Diameter inside liners: 5.35 m Belly length inside liners: 7.60 m Centre line length: 8.76 m Speed: 12.50 r.p.m % critical speed: 66.74 Ball top size: 50-65 mm Rated power: 4500 kW Ball load fraction: 0.39 |
| Fimiston Hydrocyclones: (2 clusters of 7 cyclones, 3 or 4 operating per cluster) Manufacturer: Krebs (DS26-S2085) Diameter: 0.660 m Length of cylindrical section: 0.570 m Inlet diameter: 0.250 m Spigot diameter: 0.150 and 0.190 m Vortex finder diameter: 0.232 m Cone angle: 25 degrees |