



The content on this page was automatically generated from the PDF publication document and may contain errors or inaccuracies. Please refer to the original PDF for the most accurate information.
Predicting the Overall Specific Energy Requirements of AG/SAG, Ball Mill and HPGR Circuits on the Basis of Small-Scale Laboratory Ore Characterisation Tests
S.Morrell
SMCC Pty Ltd, 29 Camborne Place, Chapel Hill, Qld. 4069 Australia E mail:
Abstract
Until recently there was an almost complete absence of a formalised and validated approach to estimating the specific energy requirements of what are now regarded as conventional comminution circuits ie AG/SAG – ball mill circuits. This problem has been further compounded by the rise in popularity of HPGR technology, for which there is an even greater scarcity of relevant work to aid circuit designers. This paper describes a simple yet accurate procedure for determining the overall specific energy for such circuits using parameters that are derived from the SMC Test® and the Bond ball work index test. The approaches that are described are subsequently used to compare the energy usage of three different circuit configurations.
1 INTRODUCTION
20 years ago discussions about conventional comminution circuits would revolve around crushing-rod-ball or crushing-ball circuits and the work of Bond in the 1960's would provide the principal tools to aid in their design. Nowadays, such circuits are all but obsolete and are mainly confined to relatively small operations. Autogenous (AG) and Semi-autogenous (SAG) milling, often combined with ball milling, now dominate comminution circuit design with strong signs that High Pressure Grinding Rolls (HPGR) are poised to make major inroads as alternatives to AG and SAG mills in some applications. Bond's specific energy equations and rock characterisation techniques were not designed for such circuits and though a number of people have tried to apply them over the years to AG and SAG circuits they have not always been found to be reliable. In the case of HPGR circuits Bond's methodologies are completely inappropriate.
To help remedy this lack of relevant rock characterisation for AG/SAG mills and HPGRs the SMC Test® (Morrell, 2004 a ) was developed. The test was designed so that it could be easily used with small diameter drill core. It generates parameters that can be used with the comminution simulator – JKSimMet – but more importantly it provides parameters that can be used in power-based equations that can be used to predict the power requirements of AG/SAG and HPGRs. This paper describes these parameters and how they can be used to determine the overall power requirements of comminution circuits.
2 EQUATIONS
2.1 General
In some ways the approach described in the following sections mirrors that of Bond in that it contains a general equation for determining the specific energy to grind rock from a coarser distribution to a finer one as well as work indices related to the strength of the rock. In the case of tumbling mills such as AG/SAG and ball mills the technique uses 2 indices. These relate to "coarse" and "fine" ore properties. "Coarse" in this case is defined as spanning the size range from a P80 of 750 microns up to the P80 of the product of the last stage of conventional crushing or HPGR circuit product prior to grinding. "Fine" covers the size range from a P80 of 750 microns down to P80 sizes typically reached by conventional ball milling, ie about 45 microns. The choice of 750 microns as the division between "coarse" and "fine" particle sizes was determined during the development of the technique and was found to give the best overall results across the range of plants in the author's data base. For HPGR size reduction a different ore characterisation parameter is used, though as will be seen later it is derived from the same test (SMC Test®) that provides the "coarse" ore characterisation parameter.
The work index covering tumbling mill size reduction of coarse sizes is labelled \( M_{ia} \) whilst that covering grinding of fine particles is labelled \( M_{ib} \) . For HPGR size reduction the parameter is labelled \( M_{ih} \) . \( M_{ia} \) values are provided as a standard output from a SMC Test® whilst \( M_{ih} \) values are obtained from a correlation with the DWi, which is also a standard output from the SMC Test®. \( M_{ib} \) values can be determined using the data generated by a conventional Bond ball mill work index test (note that \( M_{ib} \) is NOT the Bond ball work index - Morrell, 2008). Both of these tests are readily available from mineral processing laboratories around the world.
The general size reduction equation is as follows (Morrell, 2004b):
where
\( M_i \) = Relevant work index related to the breakage property of an ore (kWh/tonne); for grinding from the product of the final stage of crushing or HPGR product to a P80 of 750 microns (coarse particles) the index is labelled \( M_{ia} \) and for size reduction from 750 microns to the final product \( P_{80} \) normally reached by conventional ball mills (fine particles) it is labelled \( M_{ib} \) . For HPGRs it is labelled \( M_{ih} \)
Wi = Specific comminution energy at pinion (kWh/tonne)
\( x_2 = 80\% \) passing size for the product (microns)
\( x_1 = 80\% \) passing size for the feed (microns)
$$ f(x_i) = -(0.295 + x_i/1000000) $$ (Morrell, 2006) (2)
2.2 Specific Energy Determination for Tumbling Mill Circuits
The total specific energy at pinion \( (W_T) \) to reduce in size crusher/HPGR circuit product to final product is given by:
where
\( W_a \) = specific energy to grind coarser particles
\( W_b \) = specific energy to grind finer particles
Implicit in this approach is the assumption that the grinding specific energy is independent of the processing route and is believed to be applicable to all tumbling mills in the following circuit configurations: crush-rod-ball, crush-ball, crush-HPGR-ball, and AB/SAB, ABC/SABC and single stage AG/SAG circuits.
For coarse particle grinding equation 1 is written as:
where
K = 1.0 for all circuits that do not contain a recycle pebble crusher and 0.95 where circuits do have a pebble crusher
\( x_1 = P_{80} \) in microns of the product of the last stage of crushing before grinding
\( x_2 = 750 \text{ microns} \)
\( M_{ia} \) = Coarse ore work index and is provided directly by SMC Test®
For fine particle grinding equation 1 is written as:
where
\( x_2 = 750 \text{ microns} \)
\( x_3 = P_{80} \) of final grind in microns
\( M_{ib} \) = Provided by data from the standard Bond ball work index test using the following equation (Morrell, 2006):
where
\( M_{ib} \) = fine ore work index (kWh/tonne)
\( P_1 \) = closing screen size in microns
Gbp = net grams of screen undersize per mill revolution
p80 = 80% passing size of the product in microns
f80 = 80% passing size of the feed in microns
Note that the Bond ball work index test should be carried out with a closing screen size which gives a final product P80 similar to that intended for the full scale circuit.
2.3 Specific Energy Determination for HPGR Circuits
One of the operating features of HPGR machines is that their apparent size reduction efficiency varies with the applied grinding force. This is illustrated in Figure 1 where it can be seen that the MOWi as calculated using equation 1 increases with the specific grinding force. The data shown relate to a pilot HPGR treating the same ore and hence changes in the MOWi reflect changes in energy utilisation efficiency. Hence it is important that when determining the required specific energy for an HPGR circuit the specific grinding force is taken into account.
On studying the results from 35 separate tests using laboratory and pilot scale HPGR units treating different ores it was found that a correlation existed between the DWi and the MOWi values (expressed in terms of kWh/m 3 ) where they were determined from data in the specific grinding force range 2.5-3.5 N/mm 2 (Figure 2). The use of kWh/m 3 rather than kWh/tonne was found to reduce scatter in the correlation. This is because the power draw of HPGRs, unlike AG and SAG mills is not a function of ore sg. At constant roll speed and roll surface frictional conditions the power draw of an HPGR is a function of the volumetric throughput rate and resistance that the rolls experience in compressing the feed, ie the rock strength. Strength is normally quoted in terms of Pascals (KPa, MPa, GPa etc), which has the same dimensions as kWh/m 3 – hence the observed relationship between the MOWi and DWi, both of which have the units of kWh/m 3 .
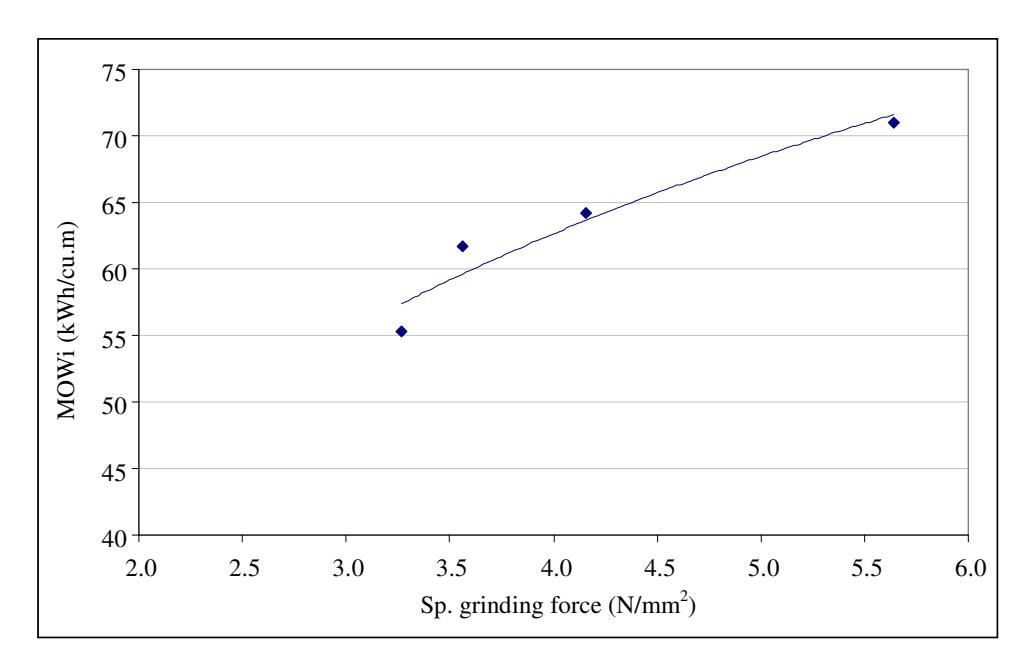
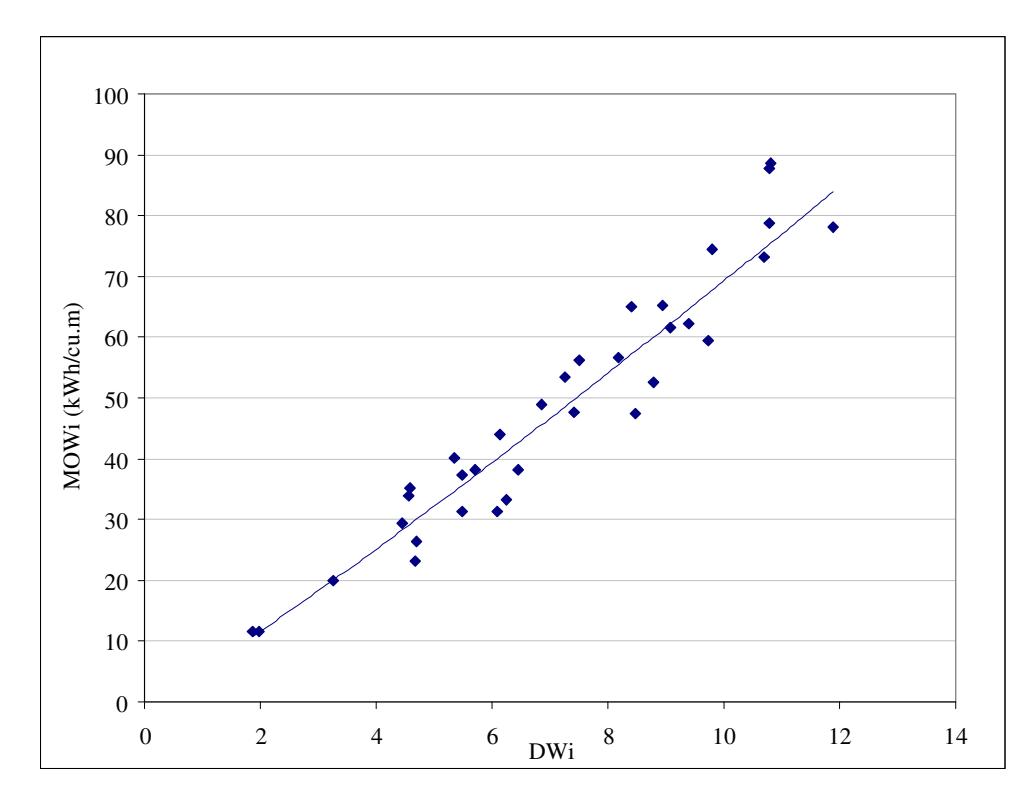
Figure 2 now provides a means for predicting the energy requirement of an HPGR circuit where the DWi is known. This can be determined using the SMC \( \operatorname{Test}^{@} \) on a suitable drill core sample. The MOWi is then read off Figure 2 and converted to kWh/t by dividing by the sg. The resulting parameter is labelled \( M_{ih} \) . The HPGR circuit specific energy \( (W_h) \) is then calculated from an HPGR circuit feed and product size, using equation 1 written as follows:
\( x_1 = P_{80} \) in microns of the product of the last stage of crushing before the HPGR circuit (ie secondary crusher circuit P80)
\( x_2 \) = HPGR circuit product P80 in microns
\( M_{ih} \) = HPGR ore work index (kWh/t) as provided by SMC Test® and the correlation in Figure 2.
2.4 Specific Energy Determination for Crushing Circuits
The specific energy of the pebble crushers in ABC/SABC circuits, secondary crushers in HPGR/ball mill circuits or crushing/ball mill circuits can be predicted using the crusher model in JKSimMet. To do so the default appearance function matrix in the model is used in combination with a specific energy – particle size matrix derived from the SMC Test® results. Alternatively if a Bond crushing work index is available then Bond's approach for crushing circuits can be used.
3 VALIDATION
3.1 Tumbling Mill Circuits
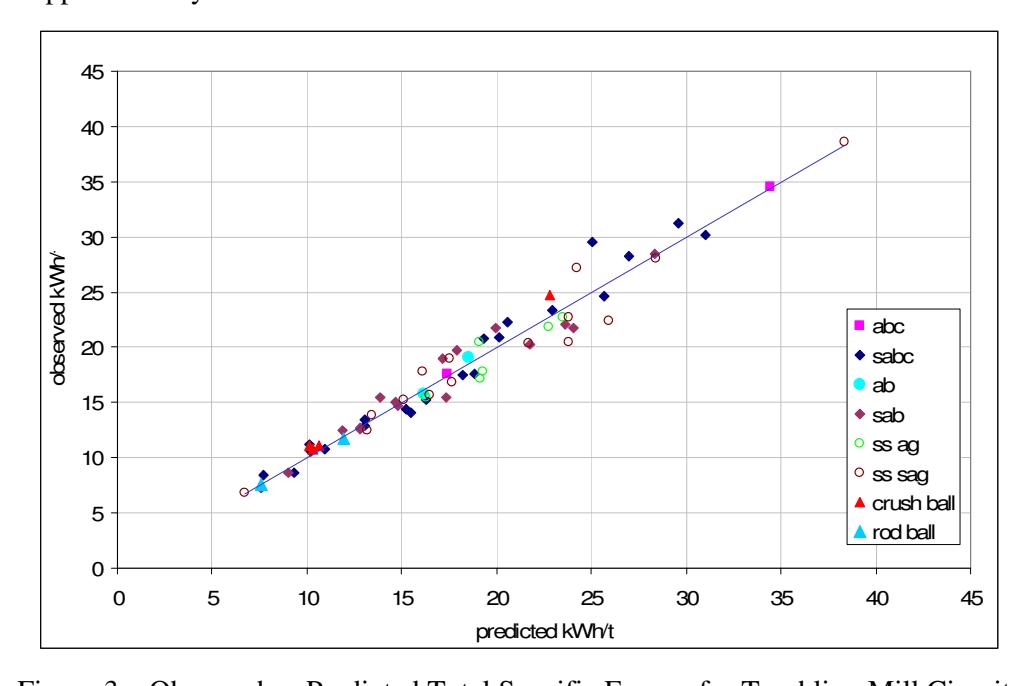
The approach described in the section 2.2 was applied to 68 industrial data sets, a summary of the data base details being given in Table 1. The results are shown in Figure 3. In all cases the specific energy relates to the tumbling mill part of the circuit that grinds from the product of the final stage of crushing to the final product. Data are presented in terms of equivalent specific energy at the pinion. In determining what these values were on each of the plants in the data base it was assumed that power at the pinion was 93.5% of the measured gross (motor input) power, this figure being typical of what is normally accepted as being reasonable to represent losses across the motor and gearbox.
Of particular relevance is that all of the circuit designs covered in the data base including rod-ball, crush-ball and most variants based around AG and SAG mills were equally well described by the same equation. The implication of this result is that tumbling mills regardless of what type have similar energy utilisation efficiency.
| DWi | BWib | F80 | ||
|---|---|---|---|---|
| Circuit | No. |
(kWh/m3
) |
(kWh/t) | (mm) |
| ABC (AG-Ball with pebble crusher) | 2 | 6.3-6.9 | 15.9-16.5 | 85-106 |
| AB (AG-Ball) | 2 | 6.0-6.2 | 9.6-12.1 | 129-134 |
| SS AG (single stage AG) | 6 | 3.3-7.1 | 13.2-19.0 | 100-178 |
| SABC (SAG-Ball with pebble crusher) | 22 | 1.9-11.0 | 10.5-25.0 | 37-176 |
| SAB (SAG-Ball) | 15 | 1.7-14.2 | 9.1-22.9 | 20-212 |
| SS SAG (single stage SAG) | 15 | 1.8-7.1 | 14.0-20.6 | 30-140 |
| Crusher-ball | 4 | 2.5-7.6 | 10.3-18.8 | 8-17 |
| Crusher-rod-ball | 2 | 3.6-7.6 | 10.0-12.4 | 25-35 |
Analysis of the relative error of the predicted specific energy vs the observed values indicated a precision (1 standard deviation) of 6.8%, giving a 95% confidence interval of approximately +/- 14%.
3.2 HPGR Circuits
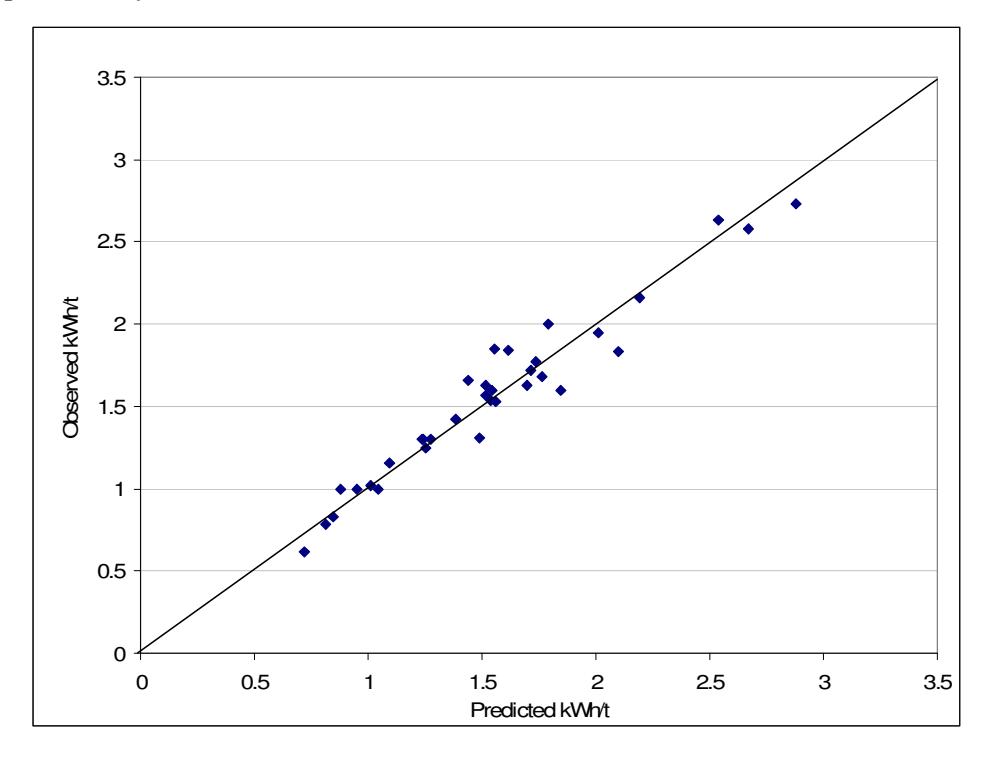
To illustrate the accuracy of the technique for HPGR circuits the correlation in Figure 2 was used in conjunction with equation 7 to predict the specific energy of the 35 HPGR tests in the SMCC data base. The results are shown in Figure 4. Analysis of the relative error of the predicted specific energy vs the observed values indicated a precision (1 standard deviation) of 7.9%, giving a 95% confidence interval of approximately +/- 16%.
4 COMPARISON OF ENERGY REQUIREMENTS FOR DIFFERENT CIRCUITS
The approaches described in the previous sections allow the overall specific energy of AG/SAG-ball mill circuits to be compared with HPGR-ball mill and also crushingball mill circuits. To illustrate this, 3 fictitious ore types (soft, medium and hard) were used as the basis for estimating the overall specific energy for each of these three types of comminution circuit (Table 2). The specific energy figures have been adjusted to reflect motor input power. To do so motor/drive train losses for tumbling mills and HPGRs were assumed to be 6.5% and 10% respectively. For conventional crushers losses were assumed to be proportionately much larger (30%) due to the high no-load powers observed with these devices. Bond's equations were also used for the crushing-ball mill circuit to compare with the Mia/Mib approach and the results are also shown in Table 2.
The results indicate that regardless of ore hardness the HPGR-ball mill circuit was estimated to use the least power. Using the Mia/Mib approach the crushing-ball mill circuit was predicted to follow closely behind the HPGR- ball circuit. However, if Bond's equations are used for this circuit the results indicate that it is only marginally better than the AG/SAG-ball mill circuit. This latter result is supported by a detailed study of such circuits in1991 (Morrell et al, 1991).
| a | b | c | ||
|---|---|---|---|---|
| Ore characteristics | ||||
| sg | 2.8 | 2.8 | 2.8 | |
| DWi | kWh/m3 | 3.0 | 6.0 | 9.0 |
| Mia | kWh/tonne | 9.9 | 17.2 | 23.8 |
| Mib | kWh/tonne | 10.3 | 16.9 | 24.1 |
| Mih | kWh/tonne | 6.5 | 13.8 | 21.6 |
| CWi | kWh/tonne | 9.0 | 18.0 | 27.0 |
| RWi | kWh/tonne | 12.0 | 17.0 | 22.0 |
| BWi | kWh/tonne | 10.0 | 15.0 | 20.0 |
| UCS | MPa | 30-50 | 90-150 | 170-270 |
| Prim crusher product P80 | mm | 75 | 122 | 162 |
| Final product P80 | microns | 150 | 150 | 150 |
| SABC | ||||
| Pebble crushing | kWh/t* | 0.14 | 0.41 | 0.57 |
| SAG and ball milling | kWh/t* | 8.88 | 15.61 | 22.14 |
| Total | kWh/t* | 9.02 | 16.03 | 22.71 |
| Sec crush/HPGR/ball milling | ||||
| Secondary crushing to 35mm | kWh/t* | 0.21 | 0.86 | 1.56 |
| HPGR size reduction to 4mm | kWh/t* | 1.56 | 2.94 | 4.00 |
| Ball milling | kWh/t* | 5.84 | 9.78 | 13.75 |
| Total | 7.61 | 13.58 | 19.30 | |
| Multi-stage crush/ball milling - Morrell | ||||
| Crushing to 10mm | kWh/t* | 0.81 | 1.83 | 2.90 |
| Ball milling | kWh/t* | 7.17 | 12.24 | 17.16 |
| Total | kWh/t* | 7.98 | 14.06 | 20.06 |
| Multi-stage crush/ball milling - Bond | ||||
| Crushing to 10mm | kWh/t* | 0.81 | 1.83 | 2.90 |
| Ball milling | kWh/t* | 7.97 | 13.32 | 20.03 |
| Total | kWh/t* | 8.78 | 15.14 | 22.93 |
* Based on estimated motor input power
5 CONCLUSIONS
Using only the results from SMC Tests® and Bond ball work index tests, sufficient information can be obtained about rock breakage characteristics to accurately predict the overall power requirements of AG/SAG-ball mill, HPGR-ball mill and crushingball mill circuits. To do so use is made of simple power-based equations that have been validated using a large data base of circuit data.
On the basis of these approaches a study of the differences in specific energy between these three circuit configurations was conducted. It was concluded that the HPGRball mill circuit required the least energy, ie was the most energy efficient.
6 REFERENCES
Morrell, S., 2004a. Predicting the specific energy of autogenous and semi-autogenous mills from small diameter drill core samples. Miner. Eng.(17/3), 447–451.
Morrell, S., 2004b. An alternative energy-size relationship to thatproposed by bond for the design and optimisation of grinding circuits.Int. J. Miner. Process. 74, 133– 141.
Morrell, S., 2006. Rock characterisation for high pressure grinding rolls circuit design. In: Proceedings of International Autogenous and Semi Autogenous Grinding Technology, vol. IV. Vancouver, pp. 267–278.
Morrell,S., 2008, A method for predicting the specific energy requirement of comminution circuits and assessing their energy utilisation efficiency, Minerals Engineering , Vol. 21 , No. 3.
Morrell, S., Johnson, G., Revy, T., 1991. A comparison through observation and simulation of the power utilisation and performance of two dissimilar comminution plants. In: Fourth Mill Operators' Conference, Aus. IMM Burnie, March. pp. 157– 160.