



The content on this page was automatically generated from the PDF publication document and may contain errors or inaccuracies. Please refer to the original PDF for the most accurate information.
Predicting the Specific Energy of Autogenous and Semi-autogenous Mills from Small Diameter Drill Core Samples
S.Morrell SMCC Pty Ltd
E-mail:
ABSTRACT
A rock breakage test has been developed that can help predict autogenous (AG) and semi-autogenous (SAG) mill performance in situations where only limited quantities of rock samples are available. The test was originally developed to make use of quartered (slivered) core but whole core, half core and lump material can also be used. Original core diameters in the range 27-85mm are suitable. The samples, once broken, can be used subsequently for Bond ball mill work index or batch grinding tests, therefore limiting overall sample requirements.
The test generates an index (DWi) that can be used to estimate the throughput of AG and SAG circuits through a combination of power-based and model-based approaches. The model-based approach makes use of the direct relationship between the DWi and the JK rock breakage parameters A and b. The power-based route uses correlations which have been developed between the DWi and the specific energies of a very wide range of operating AG and SAG circuits. Its usefulness also extends to rock mass characterisation in mining applications, as it is also correlated with the point load index/UCS. It is therefore ideally suited for mine-to-mill studies where it can be simultaneously used to predict comminution circuit performance and to augment input to blast fragmentation models. This makes it a useful tool for orebody profiling in greenfield, brownfield and established operations as, in conjunction with a mine's block model, a detailed picture can built of the blast fragmentation and comminution circuit response.
INTRODUCTION
It is generally recognised that the most accurate means for predicting the specific energy of an AG/SAG mill circuit is to pilot the circuit using a 6' x 2' mill (Mosher and Bigg, 2001). However, one of the major drawbacks of this approach is that a relatively large sample is required to do so. Collecting such a sample is expensive and in cases where the deposit is at depth, not practicable. Even if a sufficiently large sample could be obtained the question still arises as to whether the sample is representative of the orebody as a whole. In cases where the deposit is highly variable this is a particular problem. Ideally under these conditions it would be valuable to obtain samples of all of the major ore types and pilot these independently. However, such an approach would be even more prohibitive than treating a single sample. An alternative is to carry out laboratory rock breakage characterisation tests on drill core and use these results either on their own or in conjunction with one pilot test, which provides a baseline performance. The drill core data are then referenced against this result. One of the big advantages of this approach is that many core samples can be tested and a much more detailed picture of the comminution characteristics of the orebody can be obtained than would be the case if a single bulk sample were used. One of the potential drawbacks, however, is the extent to which laboratory tests are able to provide accurate predictions of AG/SAG mill performance. An important question that needs to be answered, therefore, is: "What is the most appropriate laboratory test to conduct and how should its results be used?"
Although drill core is much less expensive to obtain than bulk samples, drilling campaigns are still expensive and hence as far as possible the drill cores are put to multiple uses. This usually means halving or quartering it, with the result that only very small quantities may be available with which to carry out comminution testwork. The laboratory rock breakage test must therefore be able to accommodate this limitation.
With these problems in mind a new laboratory test has been recently developed together with a variety of approaches that use the results to predict AG/SAG mill behaviour.
TEST DESCRIPTION
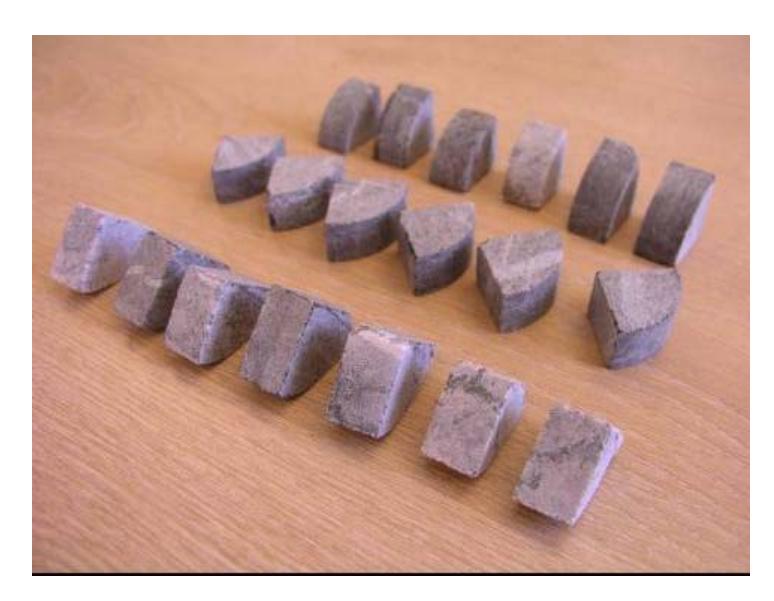
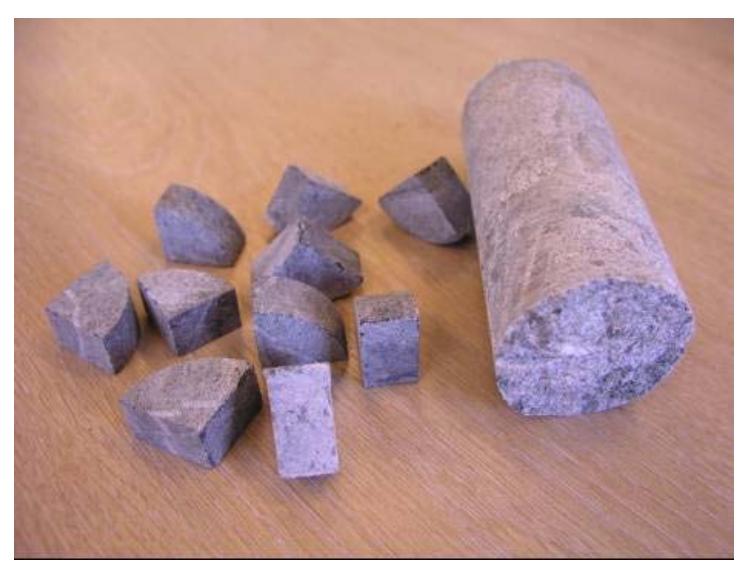
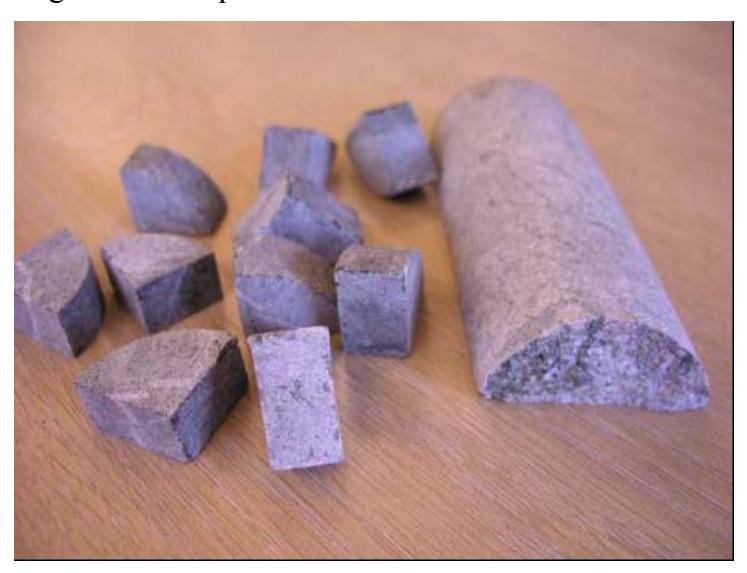
The test (referred to as the SMC test) was originally developed to make use of quartered (slivered) core, which is cut into a number of identical pieces (Figure 1) using a diamond saw. Whole core (Figure 2) and half core (Figure 3) can also be used. Original core diameters of up to 85mm are suitable. Minimum recommended sample requirements are dependent on ore sg. For rock with an sg of 2.8 the minimum recommended sample weight for 50 mm diameter core samples is 2.5 kg of intact core. For rock with a different sg or core size to this, sample requirement is calculated on a pro-rata volume basis.
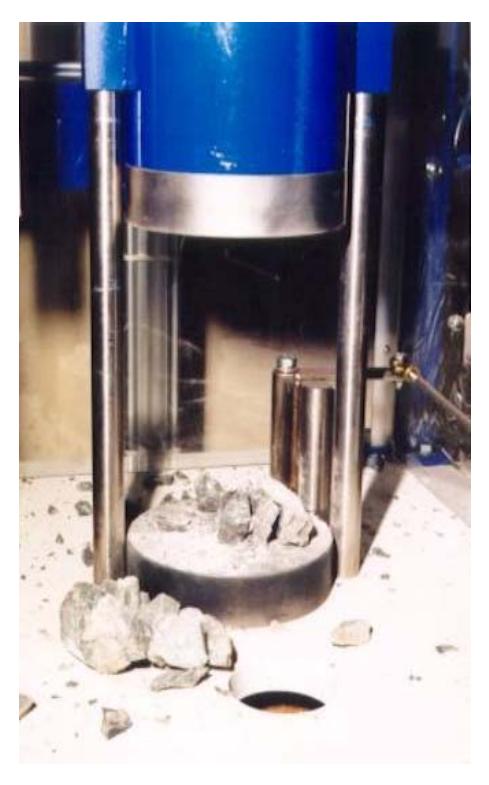
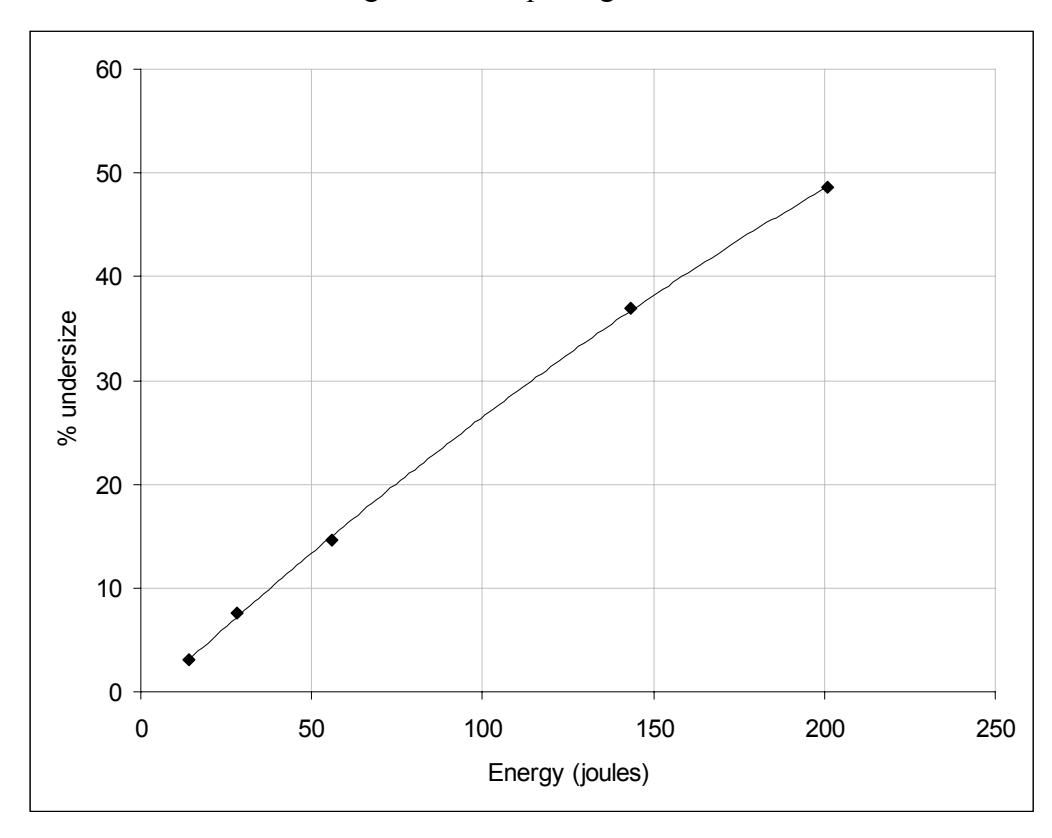
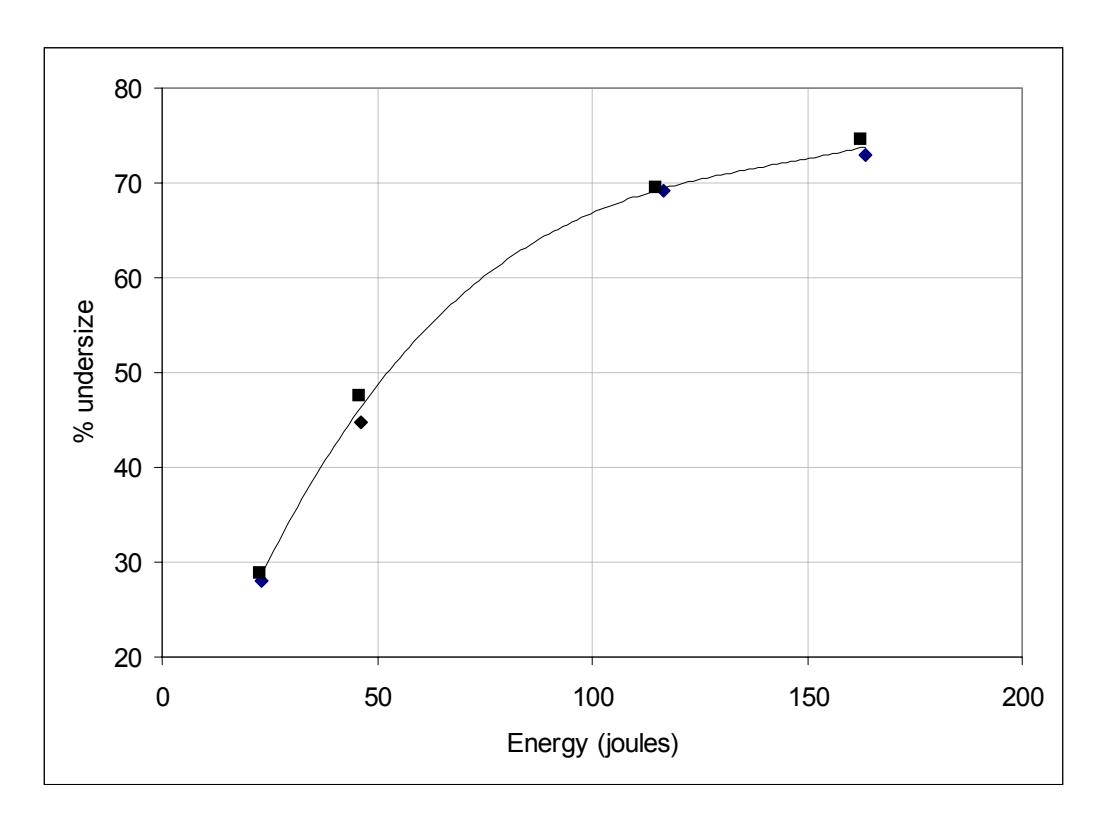
Once the core has been cut into the required number of pieces they are divided into five equal lots. Each lot is then broken in an impact device using a range of closely controlled energies. A suitable impact device is the JKMRC's drop-weight tester (Napier-Munn et al, 1996), a picture of which is shown in Figure 4. After breakage the products are collected and sized on a sieve whose aperture is related to the original particle size. The % of undersize from sieving the broken products is plotted against the input energy. A typical plot from a test is given in Figure 5 and shows the expected trend of an increasing amount of undersize as the input energy is increased. The slope of this plot is related to the strength of the rock, a slope with a larger gradient being indicative of a weaker rock. The gradient of the slope is used to generate a strength index (DWi) such that as the strength increases so does the value of the index. The high degree of control imposed on both the size of particles and the energies used to break them means that the test is relatively precise (Figure 6) and is largely free of the repeatability problems which plague tumbling mill rock characterisation tests (Angove and Dunne (1997), Kaya (2001)). Such tests usually suffer from variations in feed size, which is not closely controlled, as well as energy input, which although is often assumed to be constant is often highly variable (Levin, 1989).
USES OF THE DWi
Modelling and Simulation
The use of modelling and simulation has become routine in the design and optimisation of AG and SAG mill circuits. One of the most widely used models for this purpose is the so-called "variable rates" model (Morrell and Morrison, 1996). This uses a two-parameter description of rock breakage that is developed from data obtained from a drop-weight test (Napier-Munn et al, 1996). The two parameters (A and b) are ore specific and relate the t10 (a size distribution index) to the applied specific energy (Ecs). The equation used for describing the relationship between the t10 and Ecs is given below.
$$ t_{10} = A (1 - e^{-b.Ecs}) $$ (1)
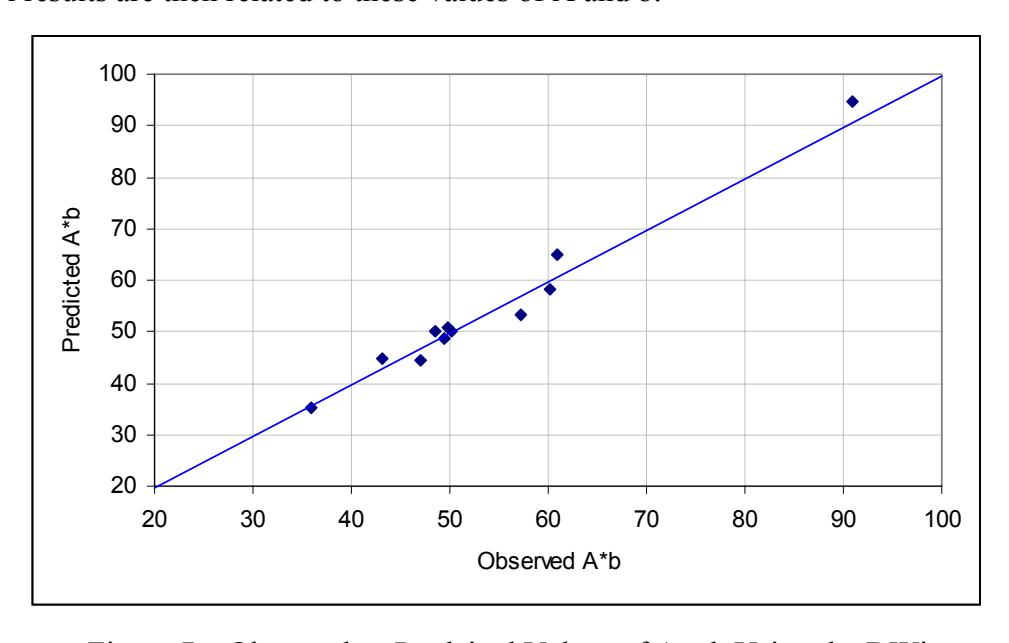
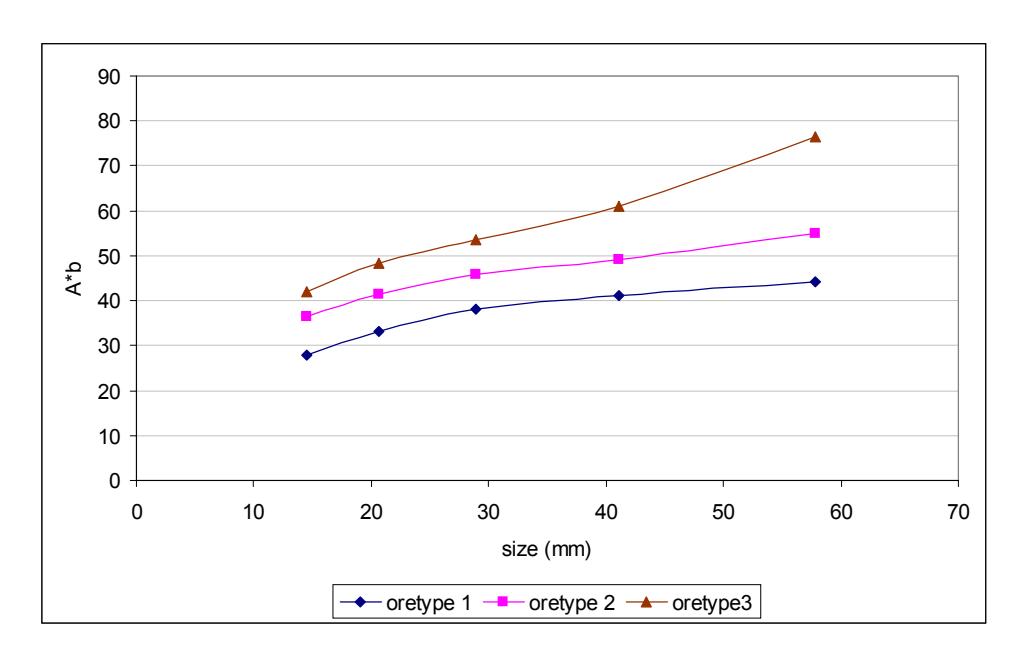
The specific comminution energy (Ecs) has the units kWh/t and is the energy applied during impact breakage. As the impact energy is varied, so does the t10. Higher impact energies produce higher values of t10, which is reflected in products with finer size distributions. The A and b parameters, in conjunction with equation 1, are used in AG/SAG mill modelling for predicting how rock breaks inside the mill. From this description the model can predict what the throughput, power draw and product size distribution will be. The standard JK drop-weight test normally needs about 75 kgs of material and hence its use is normally precluded for small drill core samples. However, the DWi is highly correlated with the A and b parameters and therefore can be used to estimate their values from such samples (Figure 7). The correlation between the DWi and the A and b parameters makes use of their size-by-size nature that is often apparent from the results of drop-weight tests (Morrell et al, 2001). This is illustrated in Figure 8, which shows how the product of A x b varies with particle size for three different rock types. These values are effectively averaged in the standard drop-weight test and a mean value of A and b is normally reported. However, the DWi is generated from testing a single size. Therefore, in developing the correlation between the DWi and the mean value of A and b, relationships such as that shown in Figure 5 are first used to predict the A and b of the same particle size that is used to generate the DWi. The DWi results are then related to these values of A and b.
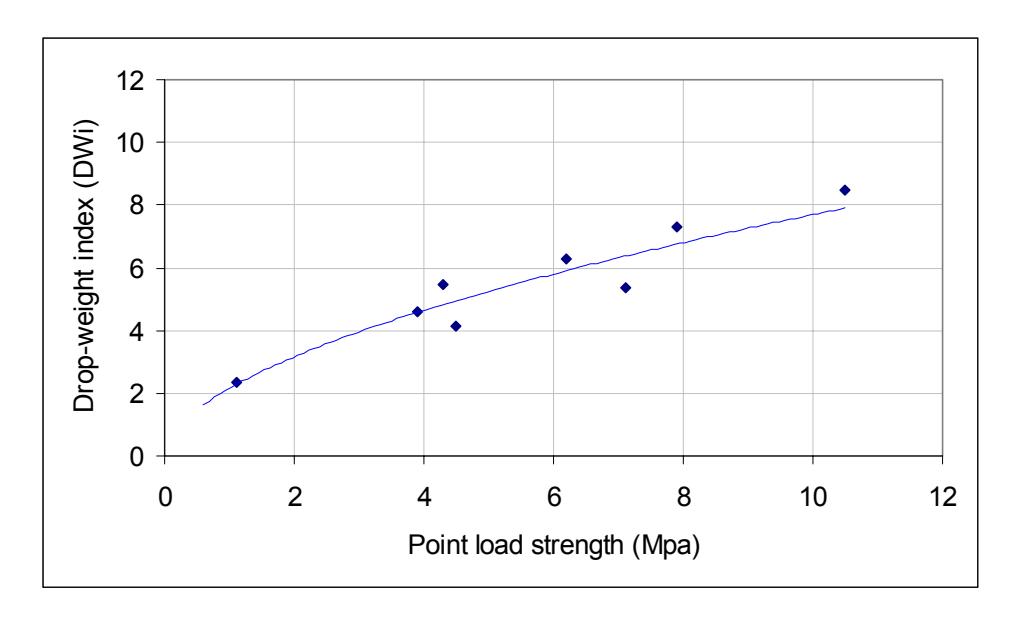
Apart from being able to predict throughput and power draw of AG/SAG mills, modelling and simulation also enables a detailed flowsheet to be built up of the comminution circuit response to changes in ore type. It also enables optimisation strategies to be developed to overcome any deleterious changes in circuit performance that are predicted. This is particularly useful during the design stage as the chosen circuit can be tested under a range of conditions to see whether the circuit will meet its production targets. Strategies can then be developed to overcome any potential problems. These can include both changes to how mills are operated eg ball load, speed etc but also changes to feed size distribution through modification to blasting practices and primary crusher operation. Blast fragmentation models are needed for this purpose. These models require information on rock mass competence such as provided by the point load strength (Scott et al, 2002). The DWi is correlated with the point load strength (Figure 9) and hence can also be used in blast fragmentation modelling where direct measurements of point load strength are not available.
Power-based Calculations
The power-based approach to design uses a methodology which, given certain ore breakage characteristics, predicts the specific energy for a particular AG/SAG mill circuit. The multiplication of the specific energy by the target throughput gives the required power draw of the mill. A mill is then selected which can draw the required power under the chosen operating conditions eg ball charge and speed.
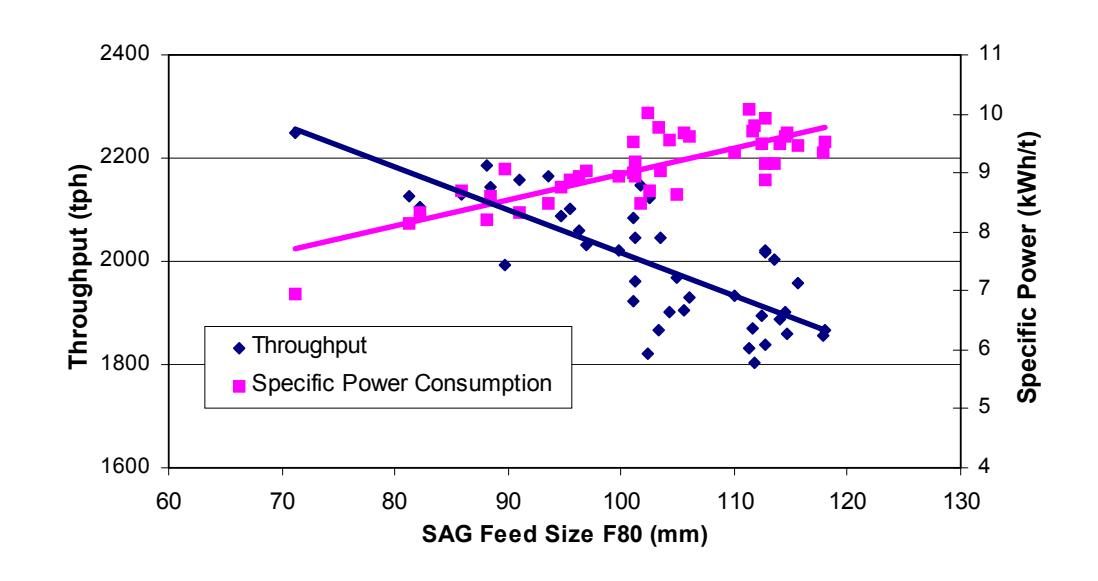
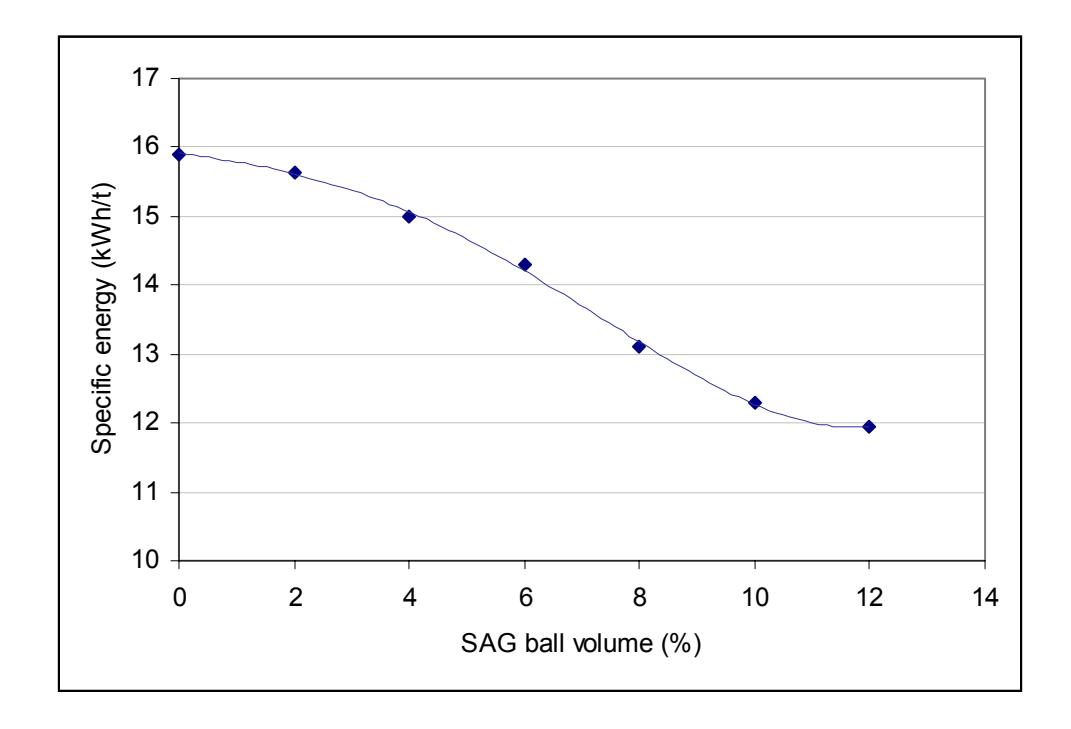
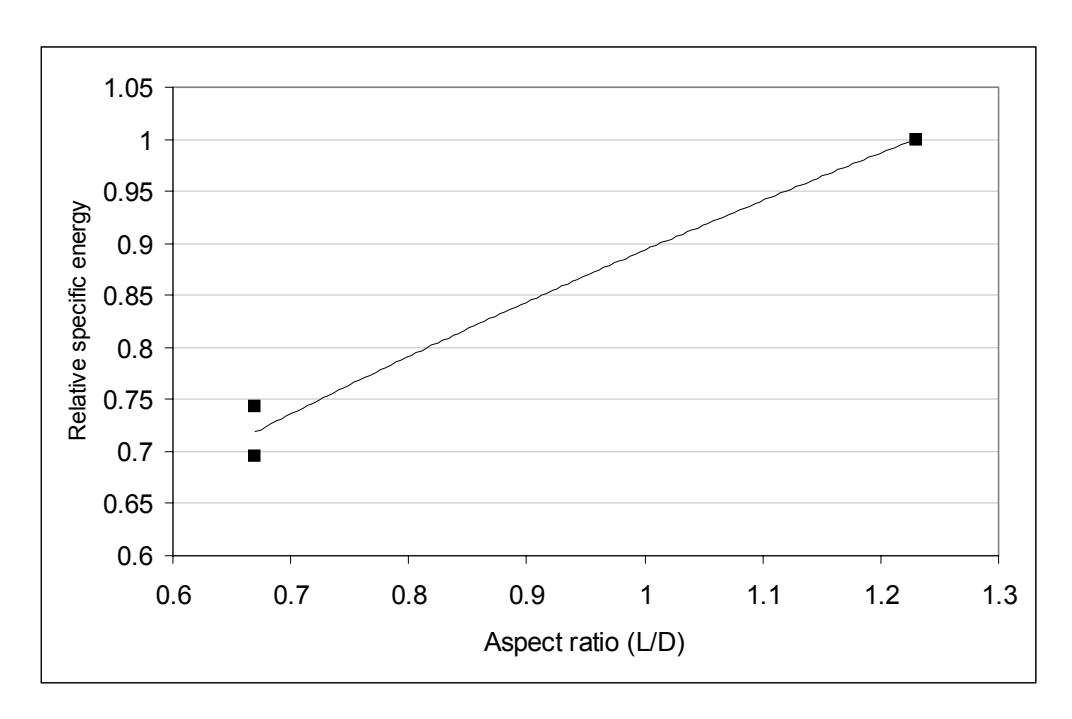
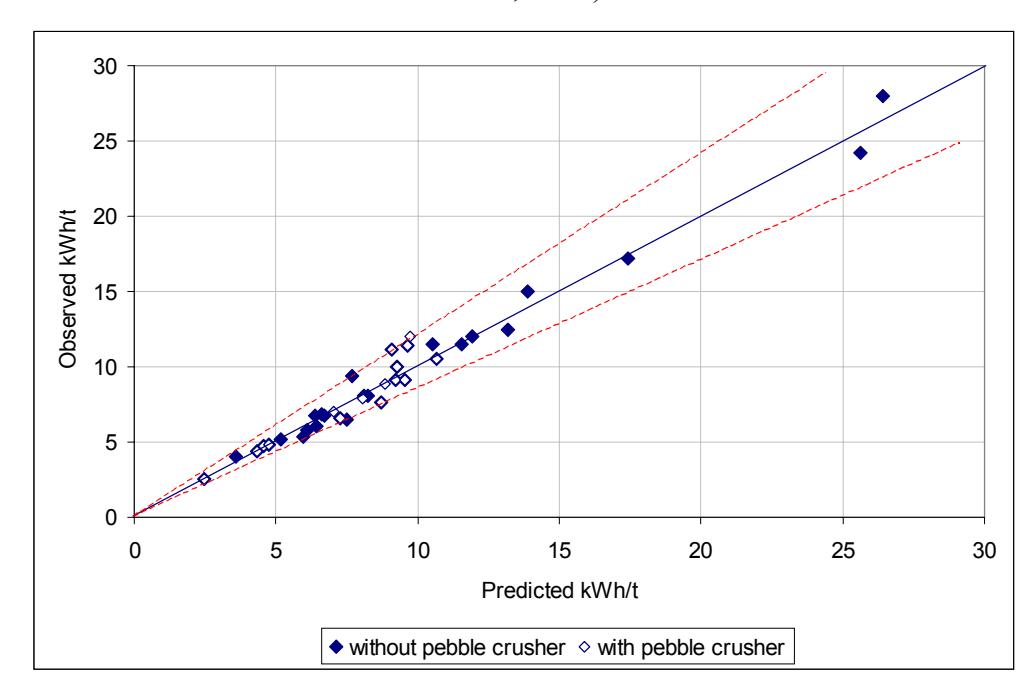
The choice of an appropriate measure of the ore breakage characteristics and an associated technique for predicting the specific energy is obviously very important for this approach to work. A potential appropriate measure of an ore's breakage characteristics is the DWi, which should be related to the specific energy required to grind the rock in an AG or SAG mill. The difficulty in determining whether such a relationship exists is that the specific energy does not just depend on ore competence but also factors such as feed size (Figure 10), ball load (Figure 11), aspect ratio (Figure 12), whether the mill has a pebble crusher or not and whether the mill is in closed circuit or not. 36 data sets from 24 different operations were therefore analysed to determine what the underlying relationships were between specific energy and various operating variables. Ore types represented in the data base were from Al, Au, Cu, Ni and Pb/Zn operations. Ball charges were in the range 0-18%, F80 in the range 20-170 mm and aspect ratio 0.5-1.1.
The result from analysing the data was an equation of the form:
Specific Energy = $$ K.F_{80}^{a}.DW_{i}^{b}.(1+c(1-e^{-dJ}))^{-1}.\phi^{e}.f(A_{r}) $$ (2)
where
F80 = 80% passing size of the feed
DWi = strength index
J = volume of balls (%)
φ = mill speed (% of critical)
f(Ar) = function of mill aspect ratio (length/diameter)
a,b,c,d,e = constants
K = function whose value is dependent upon whether a pebble
crusher is in-circuit
The ability of the equation to fit the data is shown in Figure 13, the standard deviation of the relative error being 8.2%. The specific energy predicted from equation 2 is used in conjunction with a model that predicts the power drawn by a mill with given dimensions, ball load, total load and speed (Morrell, 1994). In a design situation the throughput would be specified and hence the mill dimensions would be adjusted until the required power was obtained. Where a circuit already exists and a drilling programme is undertaken to determine how well future ores would be handled by the AG/SAG circuit, the throughput would be predicted by dividing the power draw of the existing mill by the specific energy obtained from equation 2. Each drill core tested can therefore be assigned a throughput. Thus, in conjunction with the mine's block model, it is possible to build a detailed picture of the most likely future performance of the AG/SAG mill circuit as the mine is developed further.
CONCLUSIONS
A new rock breakage characterisation test has been developed which is able to make use of very small quantities of sample such as quartered drill core. The test generates a strength index (DWi) which, via modelling and/or power-based techniques, can be used to predict the specific energy of AG and SAG mills. Its applicabilty for modelling stems from its correlation with the JK rock breakage parameters (A and b). For power-based calculations an equation has been developed which relates it and operating variables such as feed size, ball load and speed to AG/SAG mill specific energy.
The usefulness of the DWi also extends to rock mass characterisation in mining applications, as it is correlated with the point load index/UCS. It is therefore ideally suited for mine-to-mill studies as it can be simultaneously used as an input to both comminution circuit and blast fragmentation models where independent point load/UCS measurements are not available.
REFERENCES
Adam, H. W. and Hirte, D.F., 1973. Autogenous Grinding The Long And The Short Of It. AIME Annual mtg., Chicago, preprint no. 73-B-27.
Angove, J.E. and Dunne, R.C., 1997. A Review of Standard Physical Ore Property Determinations, World Gold Conference, Singapore, 1-3 September.
Hart, S., Valery, W., Clements., Reed, M., Song, M., and Dunne, R., 2001. Optimisation of the Cadia Hill SAG Mill Circuit. Proc. Int. Conf. Autogenous and Semi-autogenous Grinding Technology, vol 1, pp.11-30.
Kaya, E. 2001. Evaluation of Bond Grindability Testing. Proc. Int. Conf. Autogenous and Semi-autogenous Grinding Technology, vol 1, pp.339-347.
Levin, J., 1989. Observation on the Bond Standard Grindability Test, and a Proposal for a Standard Grindability Test for Fine Materials. SAIMM, vol 89, n0.1, pp13-21.
Mosher, J. and Bigg, T., 2001. SAG Mill Test Methodology for Design and Optimisation. Proc. Int. Conf. Autogenous and Semi-autogenous Grinding Technology, vol 1, pp.348-361.
Morrell, S. 1996. Power draw of wet tumbling mills and its relationship to charge dynamics - Part 1: a continuum approach to mathematical modelling of mill power draw. Trans Inst Min Metall, Section C Vol 105, C43-53.
Morrell, S. 1996. Power draw of wet tumbling mills and its relationship to charge dynamics - Part 2: an empirical approach to modelling of mill power draw. Trans Inst Min Metall, Section C, Vol 105, C54-62.
Morrell, S., Valery, W., Banini, G. and Latchireddi, S., 2001. Developments in AG/SAG Mill Modelling. Proc. Int. Conf. Autogenous and Semi-autogenous Grinding Technology, vol 1V, pp.71-84.
Morrell, S. and Morrison, R.D. 1996. AG and SAG mill circuit selection and design by simulation, Proc SAG '96, Vancouver, Vol 2 pp769-790.
Napier-Munn, T.J., Morrell, S., Morrison, R.D. and Kojovic, T., 1996, Mineral Comminution Circuits Their Operation and Optimisation. JKMRC Monograph Series.
Scott, A., Morrell, S. and Clark, D., 2002. Tracking and Quantifying Value from "Mine to Mill" Improvement. Proc. Value Tracking Symposium, Brisbane, Australia, AUSIMM, pp. 77-84.