



The content on this page was automatically generated from the PDF publication document and may contain errors or inaccuracies. Please refer to the original PDF for the most accurate information.
ROCK CHARACTERISATION FOR HIGH PRESSURE GRINDING ROLLS CIRCUIT DESIGN
By Stephen Morrell
Director, SMCC Pty Ltd, Brisbane, Australia
ABSTRACT
Much of the currently available rock characterisation tests have been developed specifically for rod, ball and ag/sag mills. This presents problems for High Pressure Grinding Rolls (HPGR) circuit designers as, although tests can be carried out at the pilot scale to provide appropriate machine parameters, they are only applicable to the ore that was tested. In most cases only limited quantities of ore are available for piloting, this being usually restricted to a single ore type. A full scale circuit design can be quite reliably made using these pilot data but the problem then remains as to how to determine what the circuit response will be to other ore types in the orebody for which pilot quantities are not available. Tumbling-type rock characterisation tests such as the Bond rod and ball will work indices do not appear to be correlated with HPGR performance and hence these cannot be used. The drop-weight index (DWi), however, does appear to be strongly related to HPGR performance. This parameter is derived from the SMC Test, which has been designed to accommodate small quantities of drill core. The way that the DWi is correlated to HPGR performance and how it can be used in HPGR circuit design and performance forecasting is described in this paper, using data from a wide range of ore types.
INTRODUCTION
Rock characterisation testing has tended to have developed so that specific tests are intended to apply to particular comminution machines eg Bond's crushing, rod milling and ball milling work index tests for crushers, rod and ball mills and the JK A,b parameters and the SPI test for SAG milling. To date a specific test has not been developed which has been shown to apply to High Pressure Grinding Rolls (HPGR). The problems associated with this are two-fold. Firstly, without a relevant laboratory test, determining the influence of ore variability on a proposed new or existing HPGR circuit can only be done by treatment through a laboratory or pilot-scale machine. Minimum sample requirement to do so is about 30-50 kgs per ore type (laboratory-scale machine). When only small quantities of drill core are available this is clearly not feasible. The second problem is that in greenfield design studies large sums of money can be spent on conducting variability tests on drill cores, which often include testing for AG/SAG mill ore breakage characterisation. If an HPGR-specific ore characterisation test were available it would have to be carried out in addition to the AG/SAG test, adding to the cost of the test programme. If the final choice of comminution circuit is an AG/SAG-based this cost will be wasted. Ideally therefore a test is required that is equally applicable to AG/SAG mills and HPGRs. The SMC Test meets this requirement.
SMC TEST and the DWi
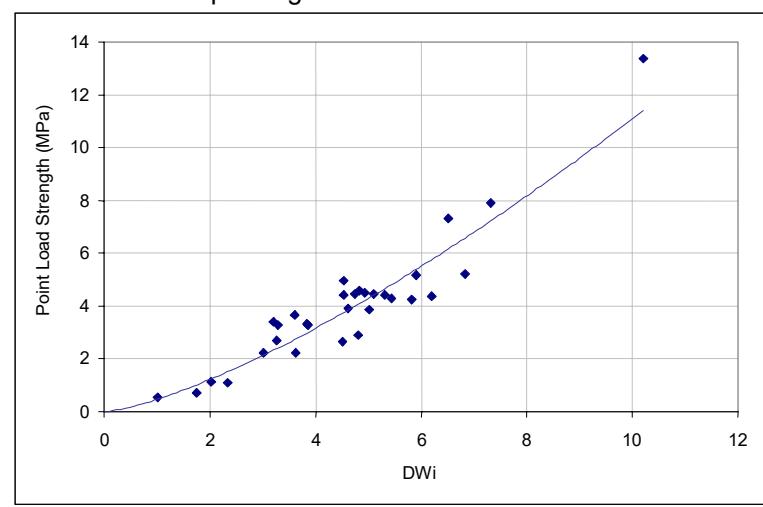
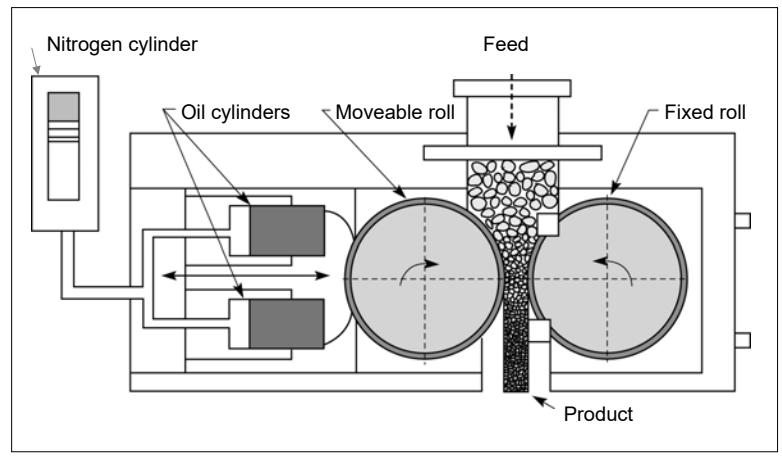
The SMC Test is designed to make use of relatively small quantities of sample such as small diameter drill core. It is described in some detail in a complementary paper in this conference "Design of AG/SAG mill Circuits Using the SMC Test" and hence no further description of the test is made in this paper. Of importance, however, is the parameter DWi, which is obtained from the SMC Test and which it has been found is correlated with the operating work index of HPGR machines when treating different ore types. The DWi is a rock strength parameter and not surprisingly is correlated with the Point Load Strength as Figure 1 shows. These data come from analysis of data from 34 different rock types. Considering how an HPGR works (Figure 2) it is to be expected that rock strength should be related to the specific energy required to grind it in these devices. As the rock is fed into an HPGR the rotation of the rolls draws material in and progressively compresses (and breaks) it as it moves down to the point of minimum gap. The resistance of the rock to this compression tends to force the rolls apart, which in turn is resisted by the rolls due to the pressure exerted by the hydraulic system. A rock with a higher strength will therefore cause the HPGR to do more work to draw it in to the rolls, compress and break it.
OPERATING WORK INDICES OF HPGR MACHINES
The performance of grinding devices can be represented using socalled operating work indices. In theory this technique reduces the performance of a device treating a particular rock type to a single number which should be independent of the feed and product size.
Perhaps the best known of this type of approach is the one put forward by Bond (1952). His well known equation for relating specific energy to the feed and product size of a grinding circuit is given in equation 1.
where
W Specific energy of the comminution device
W. Index related to the breakage property of an ore ( eg
Bond ball work index)
80% passing size for the product
F 80% passing size for the feed =
Where it is required to predict the specific energy of a grinding device the value for Wi is obtained from a suitable laboratory test eq Bond's ball work index test. Where specific energy and size distribution data from an operational device are known, ie W is known from the power draw/feedrate and the F80 and P80 have been measured from surveys. equation 1 is turned around as per equation 2 and Wi is then referred to as a "Bond Operating Work Index" (BOWi).
$$ BOW_i = \frac{W}{10(P^{-0.5} - F^{-0.5})} $$ (2)
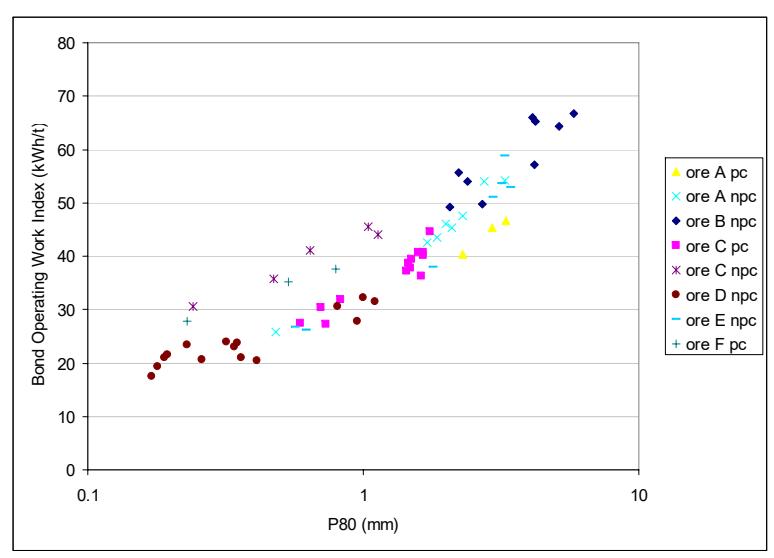
The operating work index is viewed as reflecting a combination of ore properties (hardness) and the energy efficiency of the device. However, the ability of operating work indices to reflect these parameters in a realistic manner is only as good as the equation on which they are based. Hence any bias in equation 2 will lead to erroneous conclusions concerning the values of BOWi. Whereas for ball mills equation 2 may be applicable, for primary comminution devices such as AG and SAG mills it is not applicable as there is a significant bias as Figure 3 demonstrates. As can be seen there is a clear trend in the BOWi values derived from a large number of surveys from a pilot AG/SAG mill treating a range of ore types. This trend indicates that the BOWi decreases with a decrease in particle size, independent of ore type and operating conditions. As it is unreasonable to conclude that the ore hardness reduces as particle size reduces or the energy efficiency improves as the mill grinds finer, it is likely that equation 2 is wrong (Morrell 2004). As HPGRs operate in the particle size range near to that of AG/SAG mills, it is expected that equation 2 will also not be applicable to these devices.
An alternative to equation 2 that does appear to apply to AG/SAG mills (and therefore possibly HPGRs) is the one suggested by Morrell (2004a), and is given below.
where
Specific energy of the comminution device
Index related to the breakage property of an ore 80% passing size for the product 80% passing size for the feed
Turning around equation (3) the Morrell Operating Work Index (MOWi) is obtained as shown in equation 4.
$$ MOW_i = \frac{W}{4(P^{f(P)} - F^{f(F)})} $$ (4)
This equation is very similar to equation 2 in general form. However, rather than a constant exponent of -0.5 it has a function (f(x)) whose
value depends on the magnitude of P and F. Graphically the function is shown in Figure 4. The equation representing the function is:
Where X = 80% passing size in microns
HPGR Operating Work Indices
If, in the case of HPGR machines, an operating work index can be predicted then using equation 3 the kWh/t that such devices would require could also be predicted for a given feed and product P80. However, one of the operating features of HPGR machines is that their apparent size reduction efficiency varies with the applied grinding force. This is illustrated in Figure 5 where it can be seen that the MOWi as defined by equation 4 increases with the specific grinding force. The data shown relate to a pilot HPGR treating the same ore and hence changes in the MOWi reflect changes in energy utilisation efficiency. Hence it is important that when operating work indices are used for HPGRs the associated specific grinding force is also quoted.
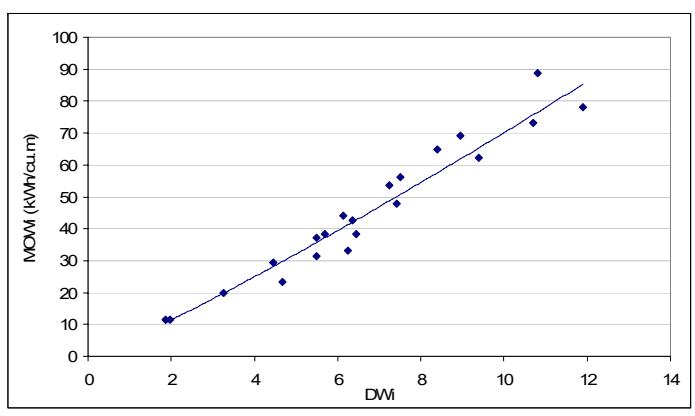
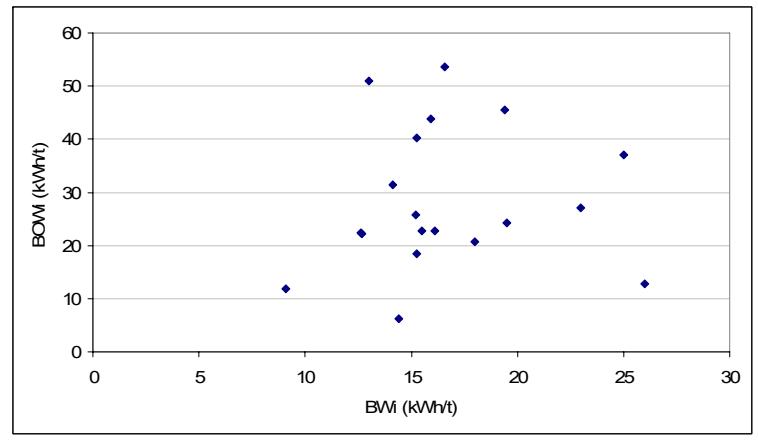
To try and obtain an equation that could predict the operating work indices of HPGR machines, operating data from 21 separate tests using laboratory and pilot scale units were collected. Using equation 4 the MOWi values (expressed in terms of kWh/m³) were determined in the specific grinding force range 2.5-3.5 N/mm². These were then plotted against the associated DWi values of the ores being treated. Figure 6 was the result, indicating a strong correlation between the values. This contrasts markedly when the same HPGR operating data are represented in terms of BOWi values and are plotted against the Bond ball work index (Bwi) (Figure 7). No significant correlation is evident.
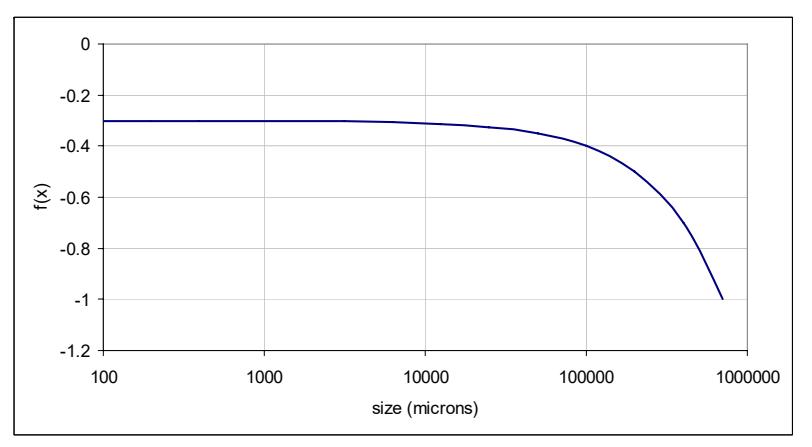
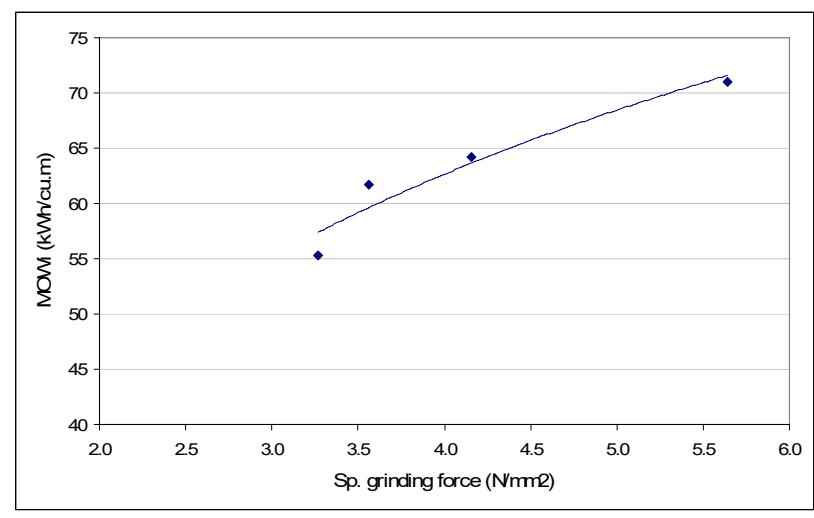
Figure 6 now provides a means for predicting the energy requirement of an HPGR circuit where the Dwi is known. This can be determined using the SMC Test on a suitable drill core sample. The MOWi is then read off Figure 6. An HPGR circuit feed and product size is then chosen and, using equation 3, the HPGR specific energy is predicted.
COMPARING HPGR AND AG/SAG CIRCUIT ENERGY REQUIREMENTS
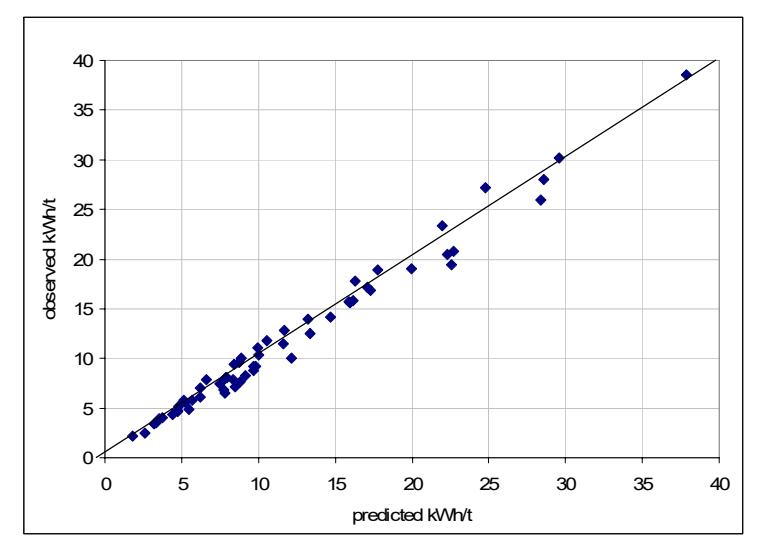
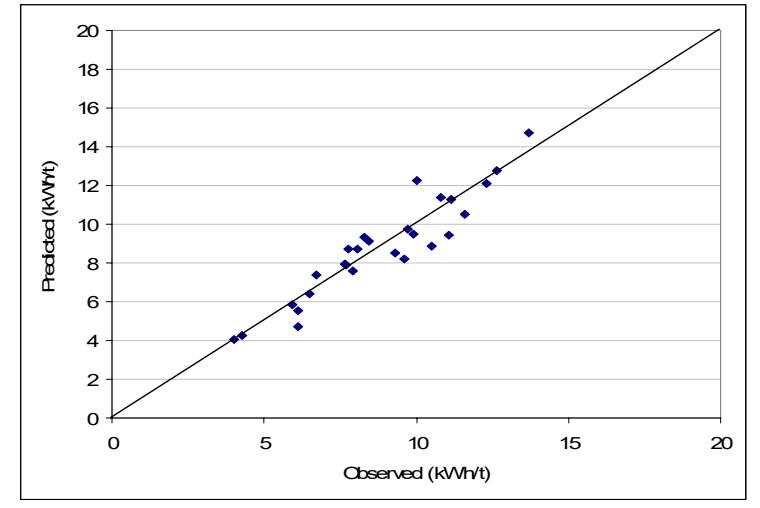
By using the relationship in Figure 6 with a given circuit feed and product P80, the power requirement of an HPGR circuit can be estimated. Using the HPGR circuit P80 and knowing the ball mill work index and final grind P80 it is also possible to estimate what the ball mill circuit power requirement will be as well, thus giving the total comminution circuit power requirement. The same can also be done for an AG/SAG mill followed by a ball mill using the Dwi equation for predicting AG/SAG mill specific energy, which is shown in equation 6 (Morrell, 2004b). This equation has been validated using 46 different data sets and gives a very good prediction of the specific energy of AG/SAG mill circuits as Figure 8 illustrates
$$ S = K.F_{80}^{a}.DW_{i}^{b}.(1+c(1-e^{-dJ}))^{-1}. \phi^{e}.f(A_{r}) $$ (6)
where
S = specific energy at the pinion
\( F_{80} \) = 80% passing size of the feed
DWi = drop-weight index
J = volume of balls (%)
\( \phi \) = mill speed (% of critical)
\( f(A_r) \) = function of mill aspect ratio
a,b,c,d,e,f,q = constants
K= function whose value is dependent upon whether a pebble crusher is in-circuit
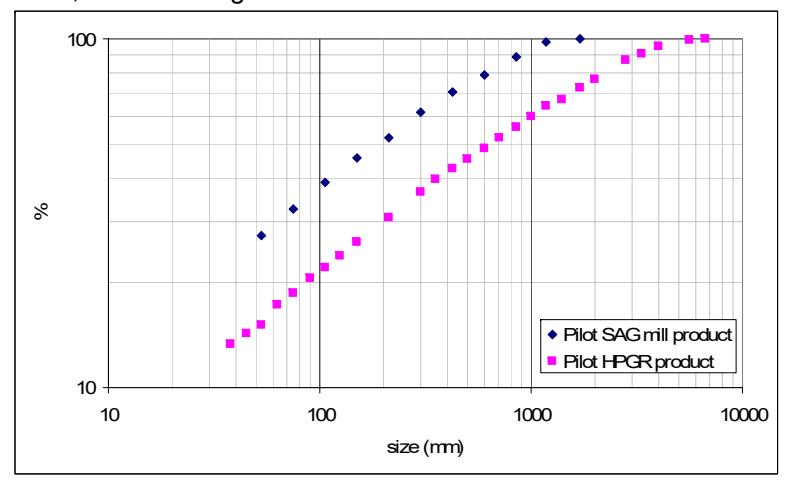
The approach in determining the ball mill circuit specific energy is similar to that put forward by Bond though equation 3 is used rather than Bond's equation (1) for the reasons stated earlier. In this case Mi is the ball mill work index and is determined using data from exactly the same ball mill laboratory test procedure that Bond developed. However, the equation for determining the value of Mi from the test data is different and is given in equation 7. Equation 7 was calibrated using 26 sets of data from ball mill circuits which are fed by AG and SAG mills and when combined with equation 3 gives the predicted values shown in Figure 9. It could be argued that as equations 3 and 7 were calibrated using ball mills in AG/SAG circuits that they would not necessarily be applicable to ball mills following HPGRs. This will need to be tested as more and more HPGR/ball mill circuits are built. However, pilot data such as those shown in Figure 10 strongly suggest that HPGR circuit product size distributions have a very similar shape to those from AG and SAG mill circuits. It is therefore reasonable to assume that, ignoring the possible influence of micro-cracking, the ball mills following HPGRs will behave in a similar manner to those in AG/SAG circuits.
$$ M_{i} = \frac{12.5}{P_{1}^{0.23} (Gbp) \left( P^{f(P)} - F^{f(F)} \right)} $$ (7)
where
Mi Morrell ball laboratory ball work index (kWh/tonne)
P₁ closing screen size in microns
Gbp net grams of screen undersize per mill revolution
80% passing size of the product in microns Ρ
F 80% passing size of the feed in microns
Having established equations which can reasonably accurately predict AG/SAG, HPGR and ball mill specific energy requirements it is possible to look at the differences between AG/SAG-ball mill and HPGR-ball mill circuits in terms of their overall energy requirements.
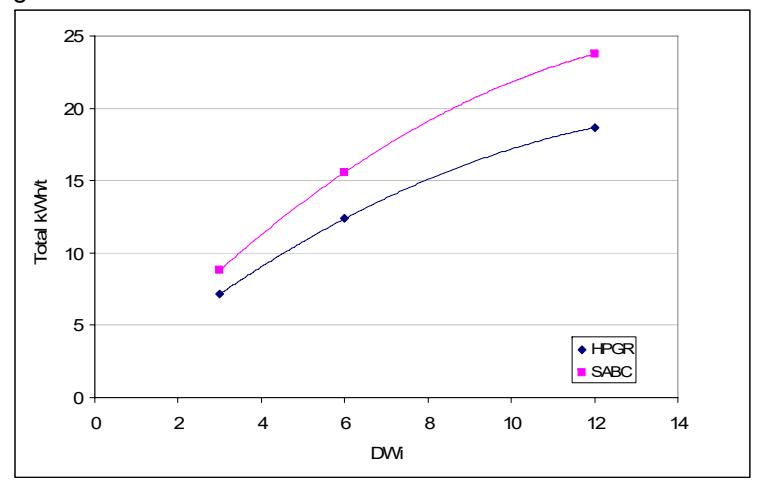
To do so the overall specific energy of an SABC circuit was compared with an HPGR-Ball mill circuit treating different ore hardnesses. In this case ore hardness was described using a range of DWi values and ball mill work indices that varied by proportionally the same amounts. The circuit feed F80 was set at 100 mm and initially a final grind P80 of 150 microns was chosen. Both the AG/SAG and HPGR circuits were closed with 12mm aperture screens. The resultant total kWh/t predicted for both types of circuit is shown in Figure 11.
Clearly the total for the HPGR circuit is significantly lower than that for the AG/SAG circuit. The difference between the two circuits is considered to be conservative as it was assumed that the strength of the material going to the ball mill in the HPGR circuit was not reduced due to the influence of micro-cracking. Laboratory and pilot tests have indicated that reductions in the ball mill circuit specific energy when HPGR products are being fed do occur when compared to results when conventionally crushed material is used, independent of feed size distribution. Micro-cracking is thought to be the cause. The effect, however, varies in magnitude and in some cases is not seen at all.
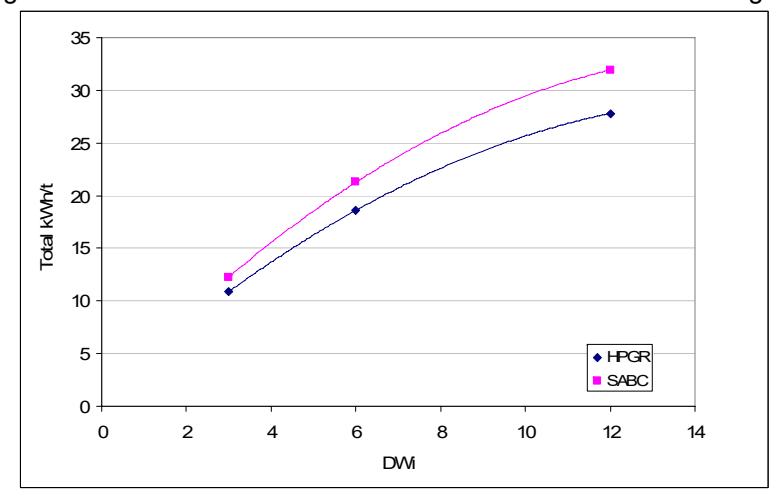
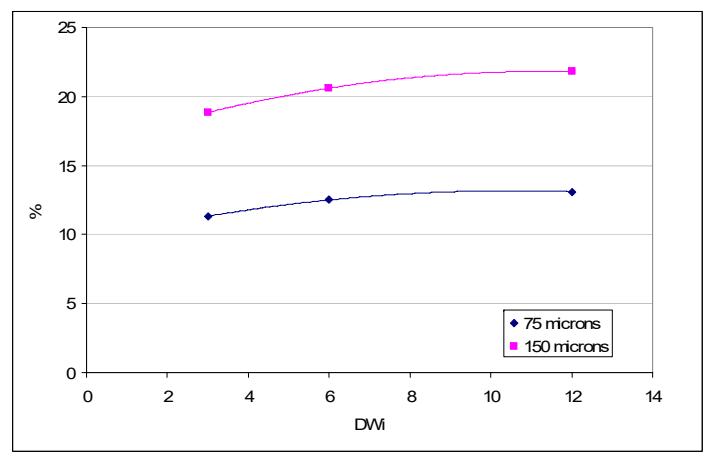
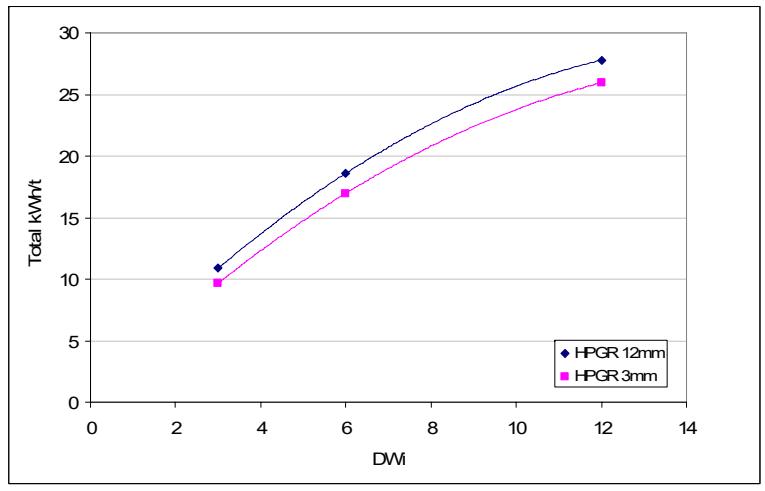
If the previous calculations are repeated but this time with a final grind P80 of 75 microns, the predicted differences between the 2 types of circuit diminishes (Figure 12). This is because the proportion of the total circuit energy accounted for by the ball mill circuit increases as the final grind size decreases. Hence the proportionate influence of the more efficient HPGR diminishes. This is summarised in Figure 12 which compares the 150 and 75 micron scenarios. In the 150 micron case overall percentage savings are of the order of 20-22% and drop to 12-14% when the grind is reduced to 75 microns. To some extent the magnitude of this effect can be reduced by making the HPGR circuit do more of the size reduction work. The easiest way to do this is to reduce the aperture of the HPGR closing screen as illustrated in Figure 14.
CONCLUSIONS
Data from a range of laboratory and pilot tests indicate that the DWi is strongly correlated with the operating work index of the HPGR circuit.
No such relationship was found when using the Bond ball mill work index. Using the correlation between the DWi and the HPGR circuit operating work index a number of scenarios were studied in which the HPGR-ball mill circuit specific energy was compared with that from an SABC circuit treating the same ore. The results indicated that with a final grind P80 of 150 microns the HPGR circuit would use at least 20% less energy than the SABC circuit. If the final grind was reduced to 75 microns the HPGR circuit energy saving dropped to about 12% due to the increased contribution of the ball mill circuit to the total energy requirement. By reducing the closing screen size of the HPGR circuit the ball mill power demand was reduced, thereby increasing the energy savings of the HPGR-ball mill circuit.
REFERENCES
Bond, F. C.,1952. The third theory of comminution, Trans AIME, vol 193, pp 484-494
Morrell, S., 2004. An Alternative Energy-Size Relationship To That Proposed By Bond For The Design and Optimisation Of Grinding Circuits . International Journal of Mineral Processing , 74, 133-141.
Morrell, S., 2004. Predicting the Specific Energy of Autogenous and Semi-autogenous Mills from Small Diameter Drill Core Samples. Minerals Engineering , Vol 17/3 pp 447-451.