



The content on this page was automatically generated from the PDF publication document and may contain errors or inaccuracies. Please refer to the original PDF for the most accurate information.
SLURRY FLOW IN MILLS : GRATE-ONLY DISCHARGE MECHANISM (Part-1)
Sanjeeva Latchireddi# and Stephen Morrell JKMRC, University of Queensland, Isles Rd., Indooroopilly – 4068, Australia
Email :
# Current Address: Regional Research Laboratory (CSIR), Bhopal – 462026, India
ABSTRACT
Discharge grates play an important role in determining the performance of autogenous (AG), semi-autogenous (SAG) and grate discharge ball mills. The flow capacity (grinding capacity) of these mills is strongly influenced by the discharge grate design open area and position of apertures, as well as the performance of the pulp lifters. As mill sizes have progressively increased and closed-circuiting has become more popular the importance of grate and pulp lifter design has grown.
Unfortunately very few studies have concentrated on this aspect of mill performance. To remedy this a series of laboratory and pilot-scale tests were undertaken to study both the performance of grates on their own and in conjunction with pulp lifters. In this first paper of a two-part series the results from the grate-only experiments are presented and discussed, whilst the performance of the grate-pulp-lifter sytem is covered in the second paper.
The results from the grate-only experiments have shown that the build-up of slurry (hold-up) inside the mill starts from the shoulder of the charge, while the toe position of the slurry progressively moves towards the toe of the charge with increasing flowrate. Besides grate design (open area and position of apertures), charge volume and mill speed were also found to have a strong influence on mill hold-up and interact with grate design variables.
Keywords
Grate discharge mills, Autogenous, Semi-autogenous, Grate, Hold-up.
INTRODUCTION
Typically in wet overflow grinding mills the product is allowed to exit the mill by overflowing the discharge trunnion. The driving force for flow of slurry from the feed to discharge end of the mill is the flow gradient due to the discharge trunnion being larger than the feed trunnion. However, grate discharge mills have a more complex mechanism.
The different components of a mill relevant to material transport in a trunnion supported grate discharge mill are described below and schematically shown in Figure 1.
- 1. Feed trunnion: assembly through which solids and water enters into the mill.
- 2. Mill Shell: main chamber where ore particles are broken due to tumbling action of the mill.
- 3. Grate: screen which allows the ground ore particles and water to pass through in the form of slurry.
- 4. Pulp lifter: lifts the slurry which passes through grate into the discharge trunnion.
- 5. Discharge trunnion: assembly through which mill product discharges.
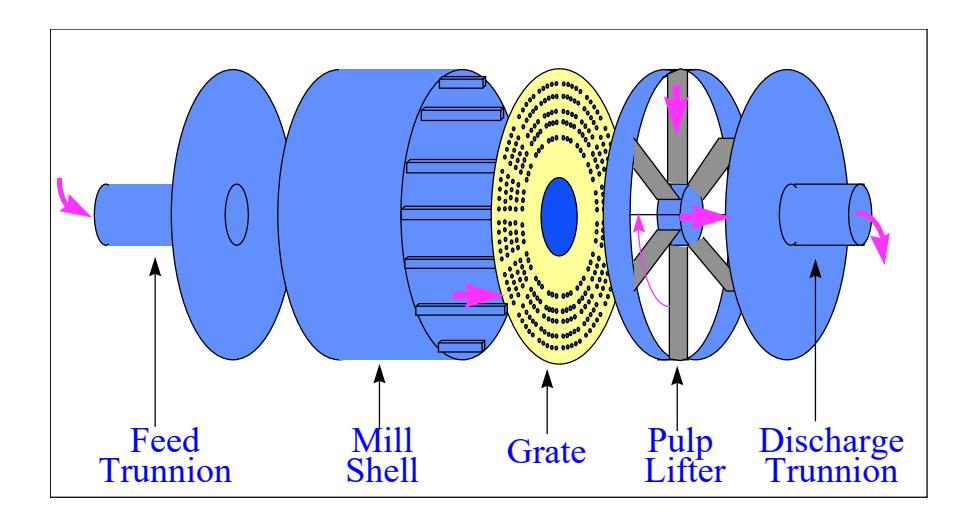
Once slurry has made its way via the grinding media charge its first stage of discharge is via the grates. Hence in the absence of any subsequent restriction the maximum flow capacity that can be obtained for a given mill is determined by the grate design in terms of open area and position of holes. The driving force for slurry transport from the mill shell through the grate holes is the difference in pressure head across the grate.
If the grate provides a high resistance to flow of slurry, then the mill will fill with an excessive amount of slurry to a level past where efficient grinding occurs, and the mill will "go off the grind" (Austin et.al., 1984). Moys (1986) supported this view and stated that an excessive build-up of slurry would seriously affect autogenous mills as a large volume of dense slurry would reduce the effective density of the media submerged in it to very low values, thereby reducing the inter-media forces which are responsible for grinding finer particles.
Even though grate design has such a significant role in grate discharge mills, little can be found in the published literature where grate design is related to hold-up and flowrate. The exceptions are the work done by Moys (1986) and Morrell and Stephenson (1996). Considerable work has been reported in the area of hold-up studies which either deal with overflow mills (Hogg and Rogovin, 1982; Abouzeid and Fuerstenau, 1980; Klimpel et.al., 1989; Nasi-El-Din et.al., 1992, Songfack and Rajamani, 1999) or ignore the effect of grate design (Gupta et.al., 1981).
Moys (1986) used a 0.54 x 0.83 m pilot mill to investigate the effect of grate design and reported that the grate design, solids concentration and feed rate have a significant influence on hold-up. However, it was not clear whether the open area or the hole position influenced the hold-up as they were changed simultaneously in his experiments.
More recent work on the effect of grate design was carried out by Morrell and Stephenson (1996) in a 0.30 x 0.15 m laboratory mill with a vertical transparent grate. Based on the results obtained, they observed that the hold-up was a strong function of percent open area and the position of holes in the grate. They reported a linear relation between open area and flowrate. However, the range of open area they covered was from 0.5 to 2 per cent of the total grate area, which is much smaller compared to the normal operating range (Napier-Munn et al., 1996).
All AG and SAG mills use steel or rubber grates to hold back the grinding media, whilst allowing the product slurry to flow through and out of the mill. The total open area, size, shape and position of the holes varies considerably from installation to installation (Napier-Munn et al., 1996), as given in Table 1.
Table 1 : The range of the important operating parameters
Open area - 2-12% of the mill cross-sectional area
Size - 10-40mm for grates
40-100mm for pebble ports
Shape - Square, round or slotted, usually with reverse taper to reduce the incidence of near size material becoming lodged in the holes
Position - At various radial distances in a diaphragm-like structure approximately parallel to the end of mill
To provode data which better cover the range of grate designs which are found in industry an extensive series of experiments were condcuted to determine the influence of charge and grate design explicitly on hold-up-flowrate relation in grate discharge mills.
EXPERIMENTAL SET-UP
A schematic diagram of the experimental set-up used in laboratory test work is shown in Figure 2.
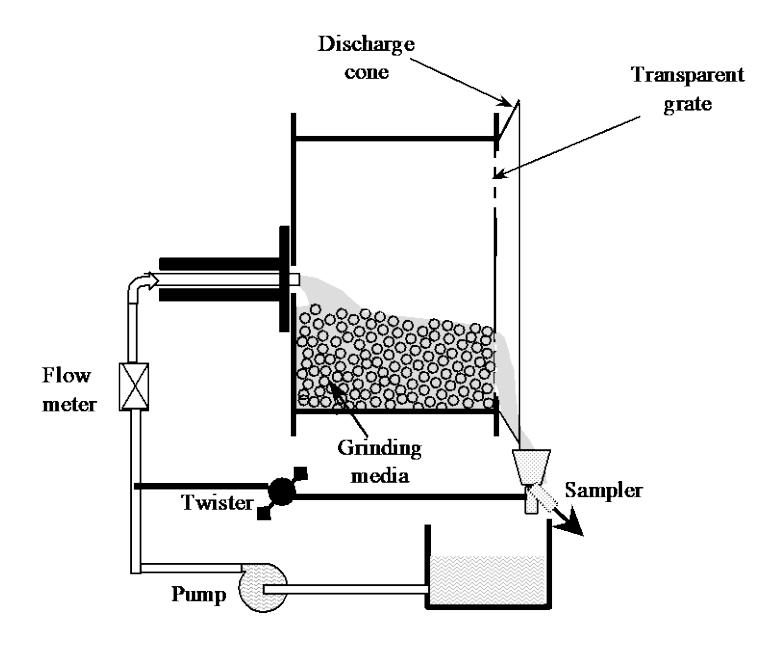
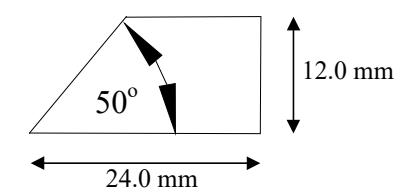
A laboratory mill was used for the experiments which had an internal diameter of 0.3 m, a length of 0.15 m and was fitted with 9 shell lifters. The design of these lifters is shown in Figure 3. The charge in the mill consisted of 6 mm steel balls. The feed end of the mill had a 40 mm hole drilled through the driving shaft to allow a non-rotating pipe of 30 mm (inside diameter) to be inserted into the mill. A rubber seal was attached over the inlet pipe to prevent any leakage.
The discharge end of the mill was fixed with a grate made of 3 mm thick clear acrylic sheet. A rotating discharge funnel was attached to the flange of the mill and passed into a fixed collection chute, from which the mill discharge was collected. A flexible sampler was fixed below the collection chute to divert the mill discharge either into the sump or into a sample bucket.
The mill was driven by a variable speed motor to vary the mill rotational speed up to the maximum of 100 rpm. A 20 litre capacity sump and a pump arrangement were employed to feed the mill continuously whose flowrate was controlled by a rotameter.
Discharge grate
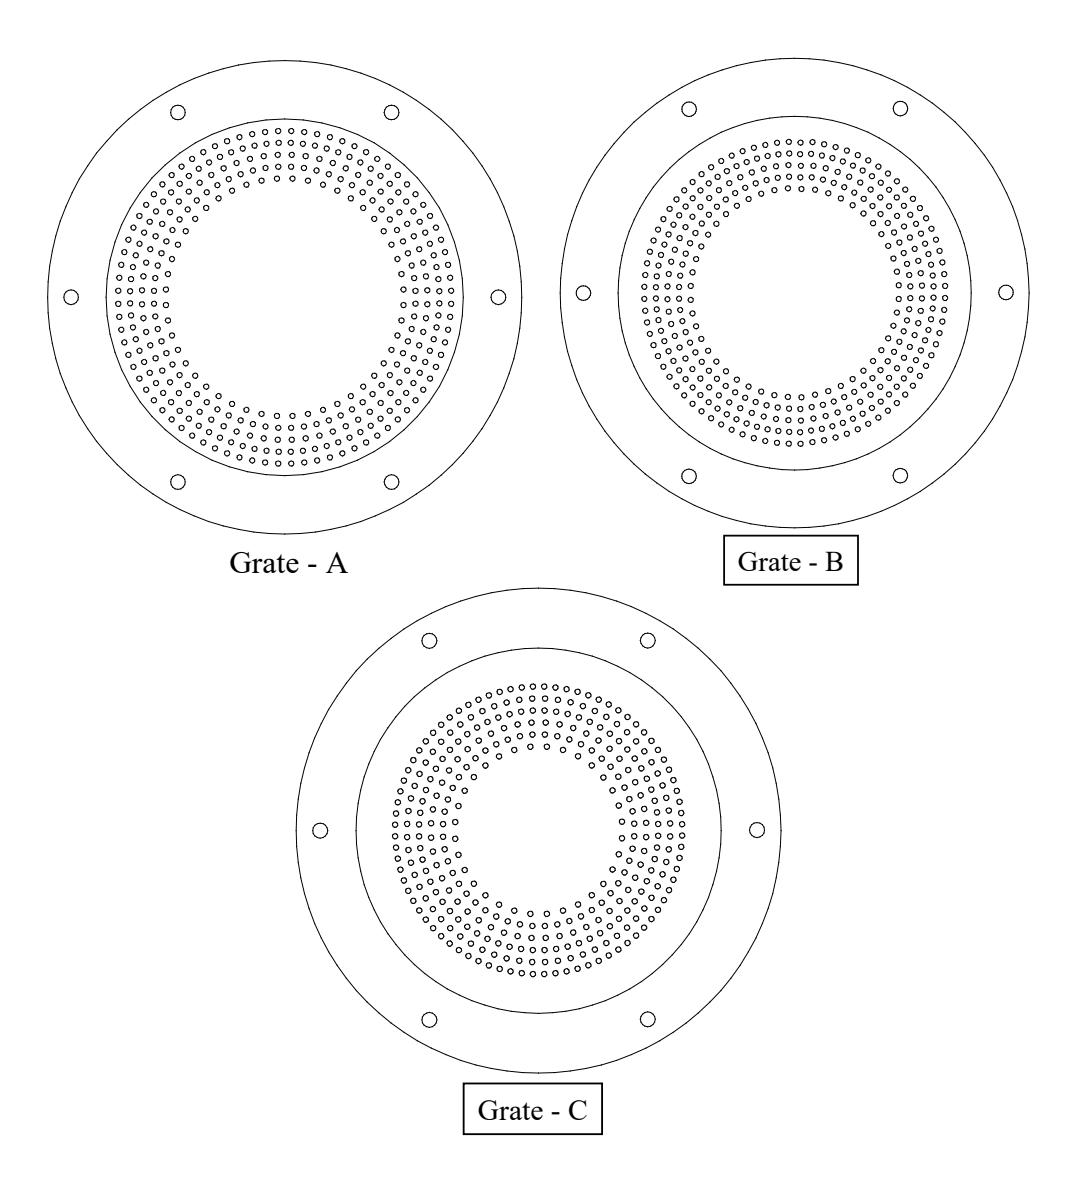
The radial position of the holes was kept constant and the size of the holes was changed to obtain different open areas. The grate was divided into 16 panels. Changes in grate design were made independently to study the effect of the radial position of holes. This was done by shifting the radial position towards the centre of the mill and keeping the number and size of the holes the same. Three grates with different mean radial position of holes were tested. Details are given in Table 2 and are shown pictorially in Figure 4.
| Grate -A | Grate -B | Grate -C | ||||
|---|---|---|---|---|---|---|
| Row | Relative Radial | No of | Relative Radial | No of | Relative Radial | No of |
| No. | Position | Holes | Position | Holes | Position | Holes |
| 1 | 0.933 | 80 | 0.867 | 80 | 0.800 | 80 |
| 2 | 0.867 | 80 | 0.800 | 80 | 0.733 | 64 |
| 3 | 0.800 | 64 | 0.733 | 64 | 0.667 | 64 |
| 4 | 0.733 | 64 | 0.667 | 64 | 0.600 | 48 |
| 5 | 0.667 | 48 | 0.600 | 48 | 0.533 | 48 |
| 6 | - | - | - | - | 0.467 | 32 |
| Total | 336 | 336 | 336 | |||
The details of both process and design variables that were investigated in the experiments are listed in Table 3.
| Process variable | ||||||
|---|---|---|---|---|---|---|
| Charge volume (% of mill volume) | 15, 30 and 45 | |||||
| Mill speed (% of critical speed) | 52, 70 and 89 | |||||
| Flowrate (l/min) | 2 to 22 | |||||
| Design variables | ||||||
| Grate open area (% of mill cross-sectional area) | 3.68, 7.05 and 10.1 | |||||
| Position of holes (Mean relative radius of holes) | 0.682, 0.77 and 0.838 | |||||
Experimental procedure
To conduct an experiment the desired grate was fixed to the mill discharge end, then the mill was filled with the required charge volume and the rotational speed set. Water was then fed into the mill at a predetermined flowrate. Once the mill reached steady state conditions, the feed and rotation were simultaneously stopped and the water that subsequently surged out of the grate was diverted into a measuring container.
Not all of the water in the mill would drain while the mill was stationary. The remaining water inside the mill was therefore drained out thoroughly through a hole drilled in the shell of the mill. The drain hole was sealed with a plug while the mill was in operation. The total amount of water was weighed and was reported as the instantaneous hold-up inside the mill. This hold-up is represented as the fraction of total mill volume.
RESULTS AND DISCUSSIONS
The flow capacity of a grate discharge mill is controlled both by the grate design and and the mill operating conditions. The effect of each design and operating variable is therefore discussed independently in the following sections.
Flowrate - mill hold-up relationship
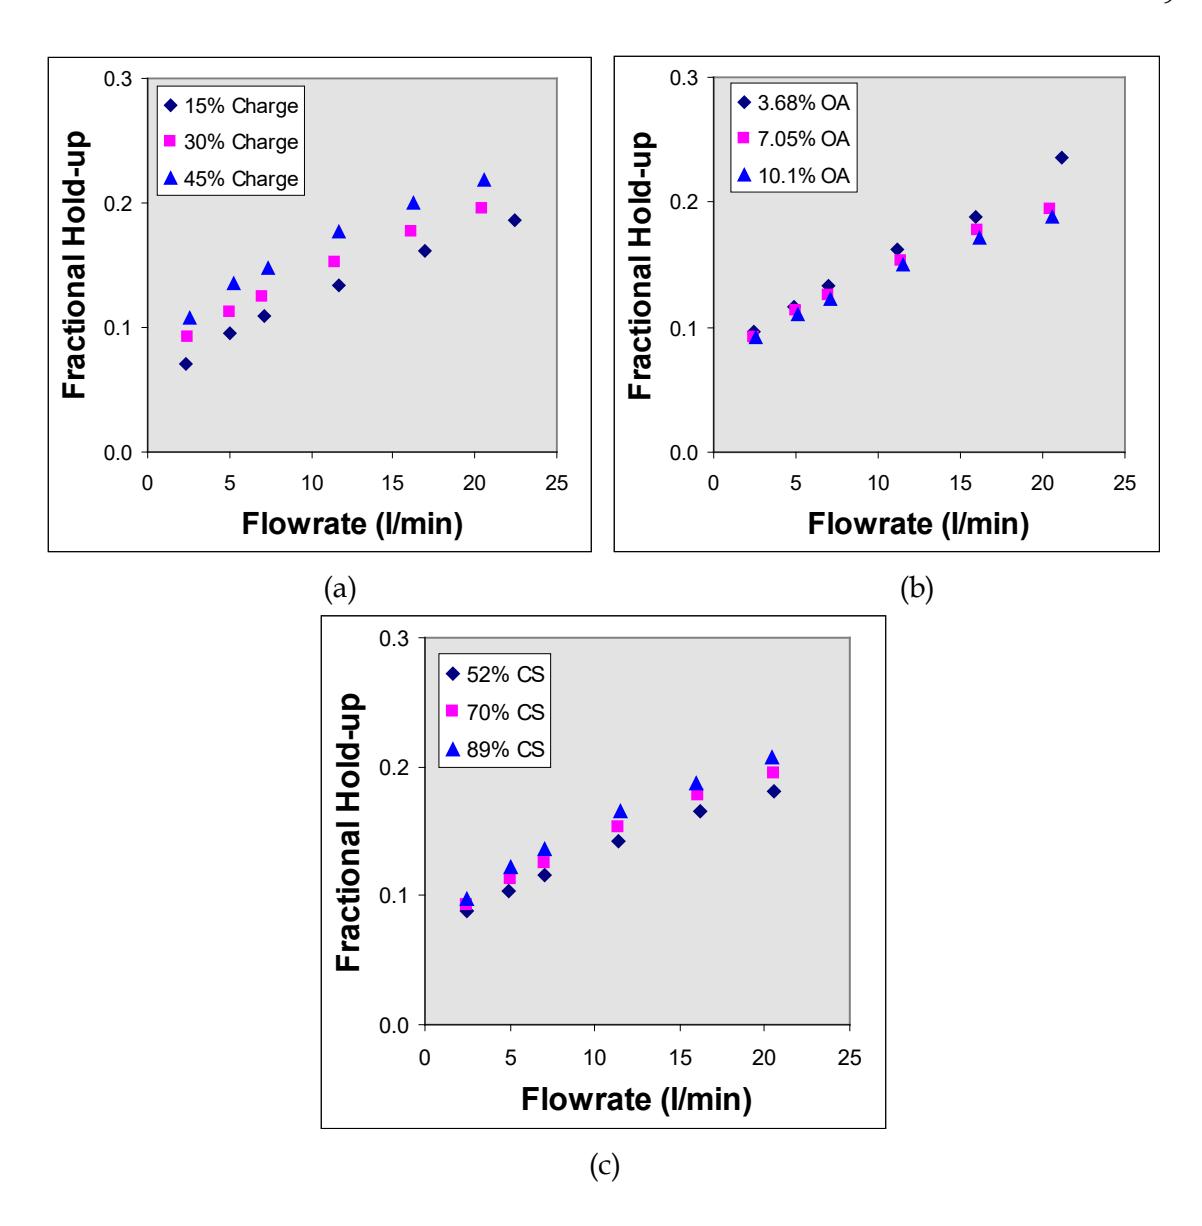
As expected, the results obtained from all the test conditions showed a progressive increase in hold-up with increasing flowrate as illustrated in Figure 5.
One of the important observations made during the experimentation was that the discharge through grates at low flowrates was observed only to occur in the vicinity of the shoulder position of the rotating charge. With increase in flowrate, the area of grate through which discharge occurred also increased in the direction of the toe position of the charge. A schematic describing this phenomenon is illustrated in Figure 6. This suggests that the build-up of slurry inside the mill first starts from the shoulder position of the charge, while the toe position of the slurry depends on the number of grate holes that are required to discharge the flow at the particular operating condition. The slurry toe position progressively moves towards the charge toe as flowrate increases. Once the interstices of the charge are saturated, accumulation of slurry near the toe position of the charge occurs which leads to the formation of a pool (Figure 6(d)), as observed by Morrell & Stephenson (1996).
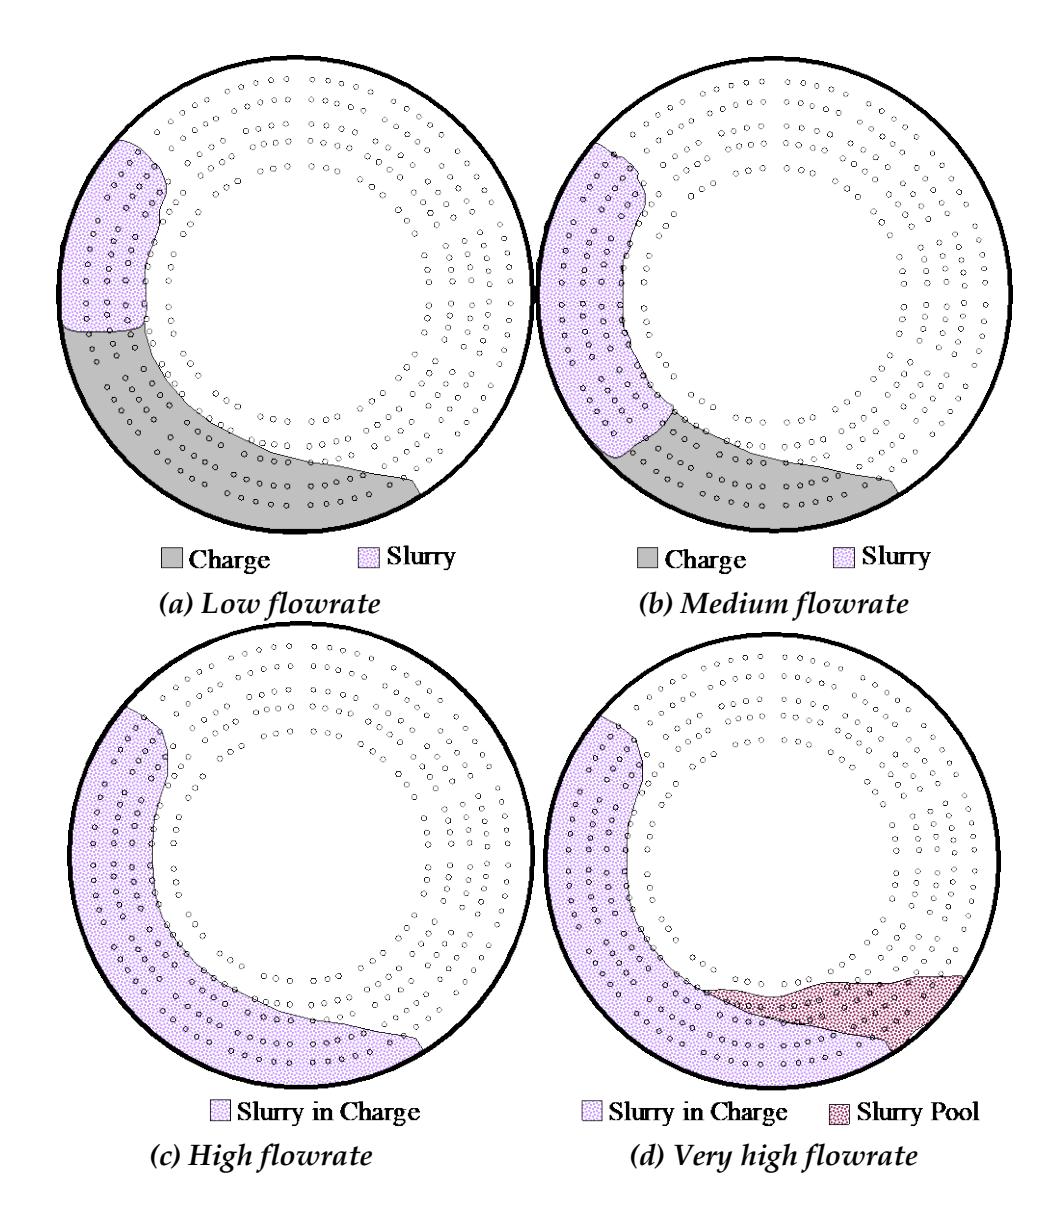
The slurry position results from the combined action of entrainment caused by the moving grinding media and gravity. These forces act in opposite directions. Gravity tends to drag the fluid back to the bottom of the mill. The effect of entrainment dominates and causes the slurry to move to the shoulder position.
Effect of Mill Speed on Hold-up
The variation of fractional hold-up with mill speed at different charge volumes is shown in Figure 8 and similar trends were observed at other test conditions. The results are similar to those obtained by Morrell and Stephenson (1996) ie hold-up increases as mill speed increases, all else being equal. This trend may be attributed to the increase in dynamic porosity of the tumbling charge.
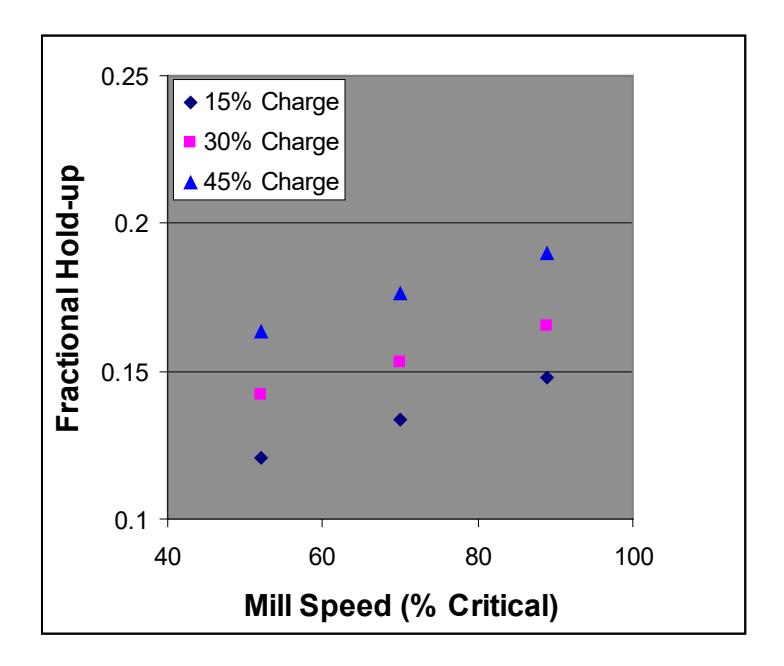
Songfack and Rajamani (1999) in their studies in overflow ball mill have also observed increased hold-up at higher mill speeds and attributed it to the increased voidage as the shoulder position of the charge moved up whilst that of the toe dropped.
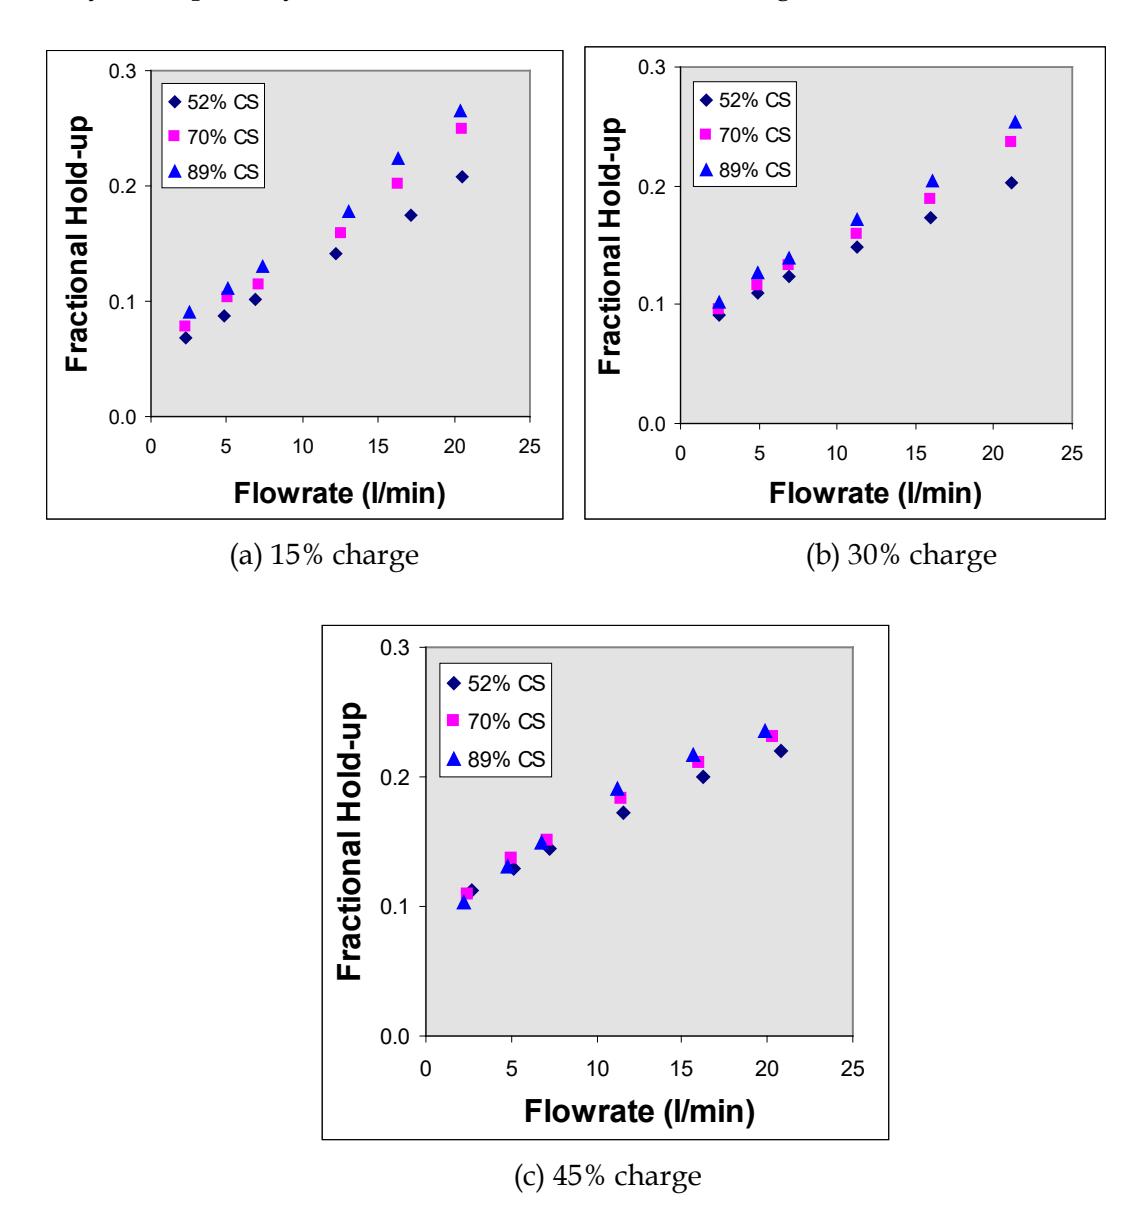
The extent of the influence of mill speed was also found to vary with charge volume. This observation can be seen in Figure 9 where the relation between flowrate and holdup are shown for different mill speeds at different charge volumes. A more pronounced effect was observed with lower charge volumes. This can also be attributed to changes in dynamic porosity which was found to increase as charge volume decresed.
Effect of charge volume on hold-up
The influence of charge volume on the flowrate – hold-up relationship is shown in Figure 10.
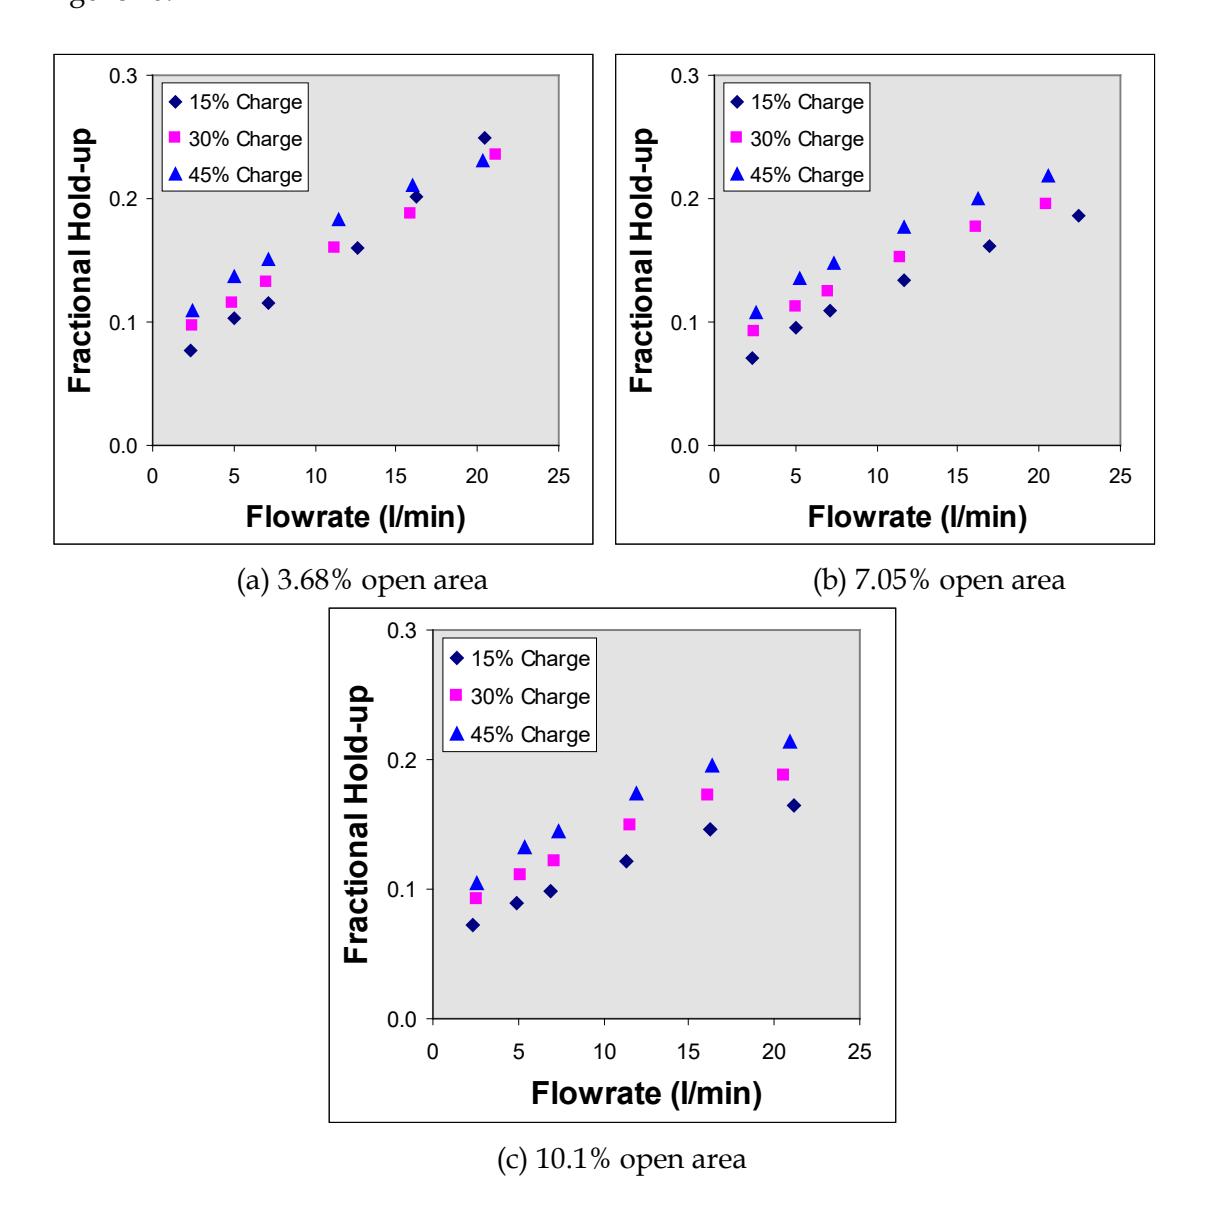
The general trend is for the hold-up to increase with increasing charge volume. However, the magnitude of the increase is influenced by grate open area. This can be seen clearly from the 3.68% open area data of Figure 10. The flow-rate-hold-up lines for 30 and 45% charge volumes cross over the line of 15% charge volume line at high flowrates. This is attributed to the early formation of a slurry pool above the toe of charge at 15% charge volume, leading to a higher hold-up. Whereas, for the same flowrate, higher slurry levels occur in higher volume charges, the proportion of voids occupied by slurry is lower. The onset of slurry pooling therefore occurs at a higher flowrate with a higher charge volume.
If the flow through the grate is assumed to be a simple flow through a number of orifices, then at a given hold-up inside the mill, which provides the pressure head, the discharge through the grate should be the same for all charge volumes. However, it is quite evident from the results that at a given mill hold-up, the discharge rate through the grate reduces with increasing charge volume. This can be explained with the aid of Figure 11, where the profiles of the hold-up both at low and high charge volumes are schematically illustrated.
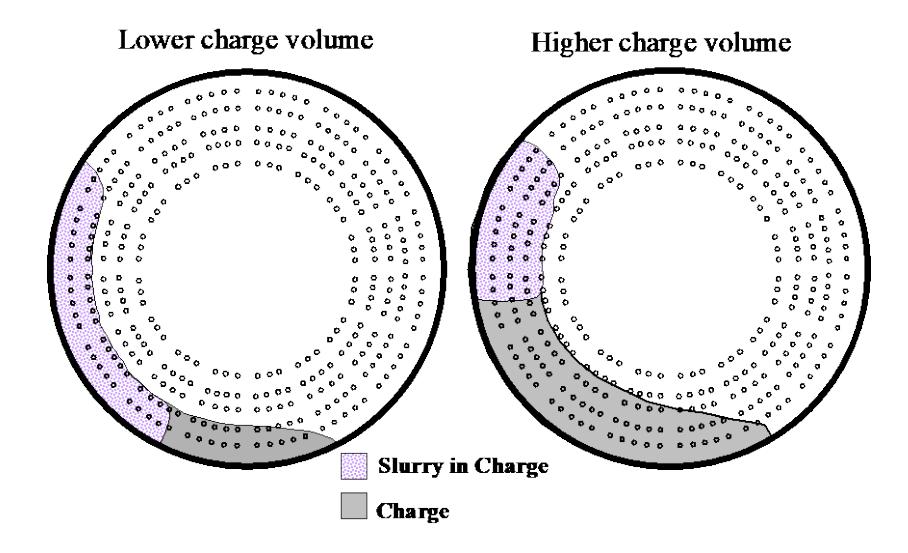
In a stationary tank with apertures at different heights, the discharge rate through the orifice increases from top to bottom simply because of increasing pressure head. Similarly, in a rotating frame, the discharge rate through outermost row of holes would be higher than the discharge through holes in inner rows at any angular direction. But, it should be noted here that in a rotating frame, the pressure head is influenced by the centrifugal force in addition to gravity, which varies with radial position. It is quite evident from Figure 11 that for the same volume of hold-up, most of the grate holes through which discharge occurs with the lower charge volume, are in the outermost row and hence have a relatively higher flow. However, with a higher charge volume, the holes through which discharge occurs are spread evenly across the inner rows and hence the net discharge rate is expected to be less.
Effect of grate open area on hold-up
In rotating tumbling mills, initially the resistance to the flow of slurry is exerted by the charge (grinding media). The discharge grate offers further resistance to flow of slurry in grate discharge mills, the most important factors being open area and the radial position of holes. While the influence of open area on hold-up is discussed in this section, the influence of hole/slot configuration will be discussed in the next section.
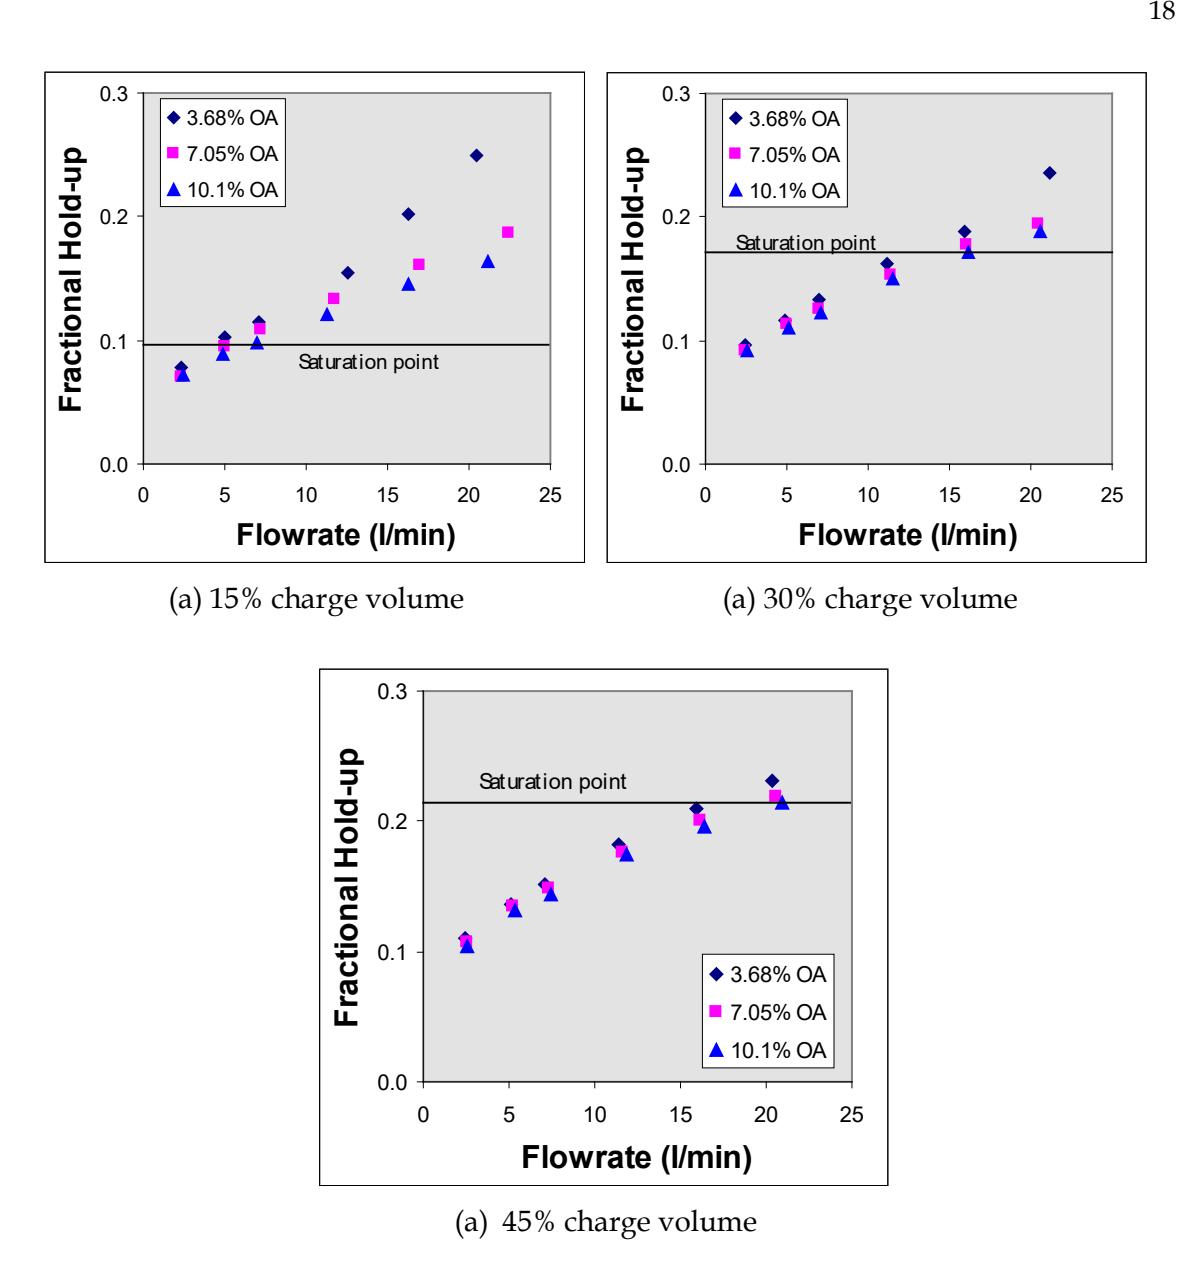
In orifice flow, the discharge rate is directly proportional to the area of the orifice. Similarly, the discharge rate through the grate is expected to be higher with increasing open area. This should lead to lower hold-up values inside the mill. This has been observed in all the experimental results as shown in Figure 12.
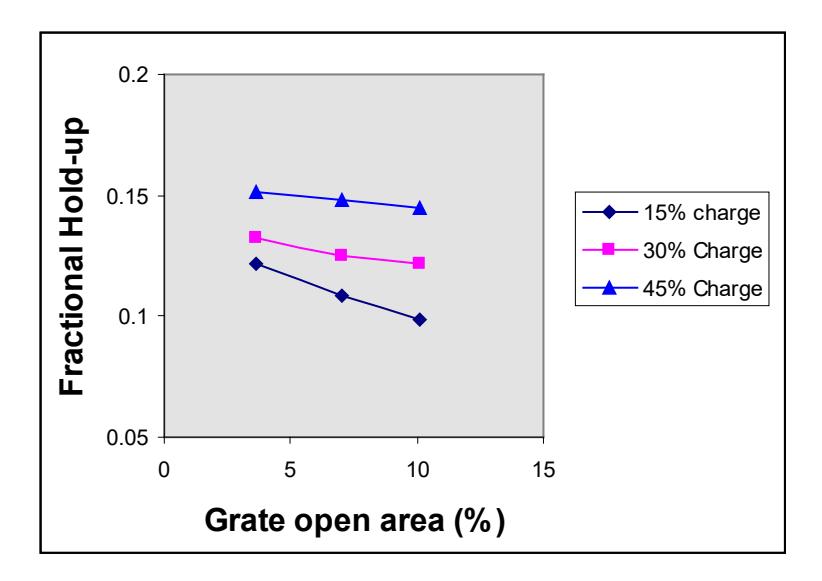
It is quite clear from Figure 12 that the influence of open area on hold-up varies with charge volume inside the mill - higher at lower charge volumes and lower at higher charge volumes. This is because of the fact that when 15% charge volume is inside the mill, flow occurs from the holes or apertures in outer most rows where the discharge rate is higher than from the holes in inner rows as explained before and illustrated in Figure 11.
It appears from Figure 12 that the open area does not have a very large effect, especially at higher charge volumes. This may be contradictory to most expectations. However, a greater influence of open area on hold-up would only be expected if flow and the holdup depend on the resistance offered by the grate only. However, the flow is also influenced by the resistance of the porous charge. To demonstrate this aspect a set of measurements were taken using a range of grate open areas, both with and without a charge inside the mill. The results obtained are given in Table 4 and graphically shown in Figure 13. A distinct difference in the influence of open area in the presence and absence of a charge inside the mill is clearly seen .
|
Flowrte
(l/min) |
With Charge
Open area (%) |
Without Charge
Open area (%) |
||||
|---|---|---|---|---|---|---|
| 3.68 | 7.05 | 10.01 | 3.68 | 7.05 | 10.01 | |
| 2.35 | 0.043 | 0.034 | 0.026 | 0.027 | 0.024 | 0.025 |
| 5.10 | 0.072 | 0.053 | 0.044 | 0.048 | 0.045 | 0.042 |
| 7.27 | 0.092 | 0.065 | 0.054 | 0.067 | 0.058 | 0.053 |
| 11.69 | 0.134 | 0.092 | 0.071 | 0.095 | 0.086 | 0.083 |
| 16.27 | 0.173 | 0.122 | 0.092 | 0.122 | 0.110 | 0.104 |
| 20.77 | 0.210 | 0.144 | 0.109 | 0.143 | 0.128 | 0.117 |
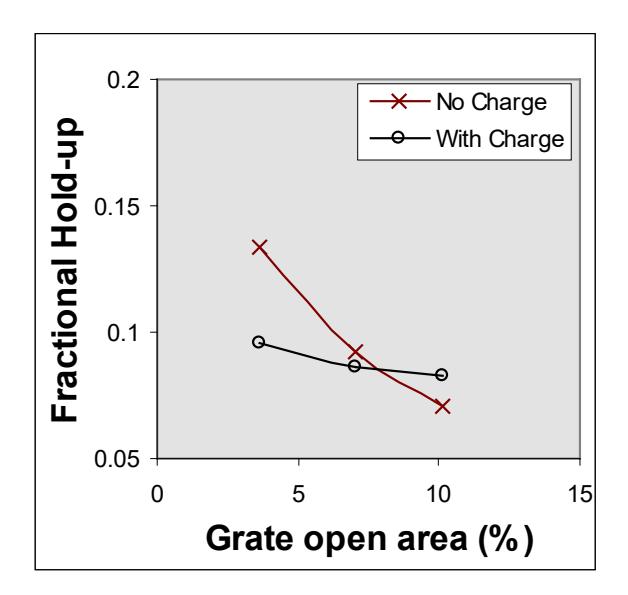
Both types of flow are observed in the data in Figure 14, where the discharge through the charge only as well as through both charge and pool are illustrated.
The conditions where a pool formed are indicated by a so-called "saturation line" which has been drawn at the hold-up value that just fills the interstices. It is paticularly noticeable with the lower charge volume tests that up to the saturation point where the slurry sits in the charge interstices only, grate open area has minimal effect on a holdup at a given flowrate. Above the saturation line, where a slurry pool forms, open area has a much greater effect.
Effect of aperture position on hold-up
When the grate open area was kept constant and the radial position of the apertures was changed, the hold-up was found to vary with radial position. This effect is illustrated in Figure 15 where the hold-up is plotted against flowrate for three different hole configurations designated as Grate-A (G-A), Grate-B (G-B) and Grate-C (G-C) whose details are described in experimental section. All the holes in the grate were moved gradually towards the mill centre from Grate-A to Grate-C (Figure 4).
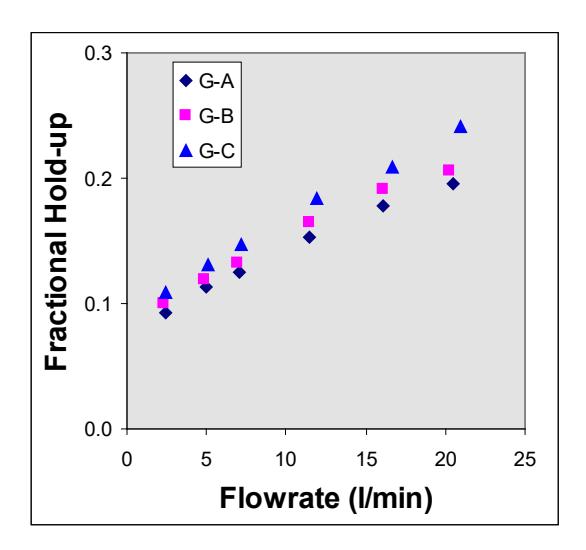
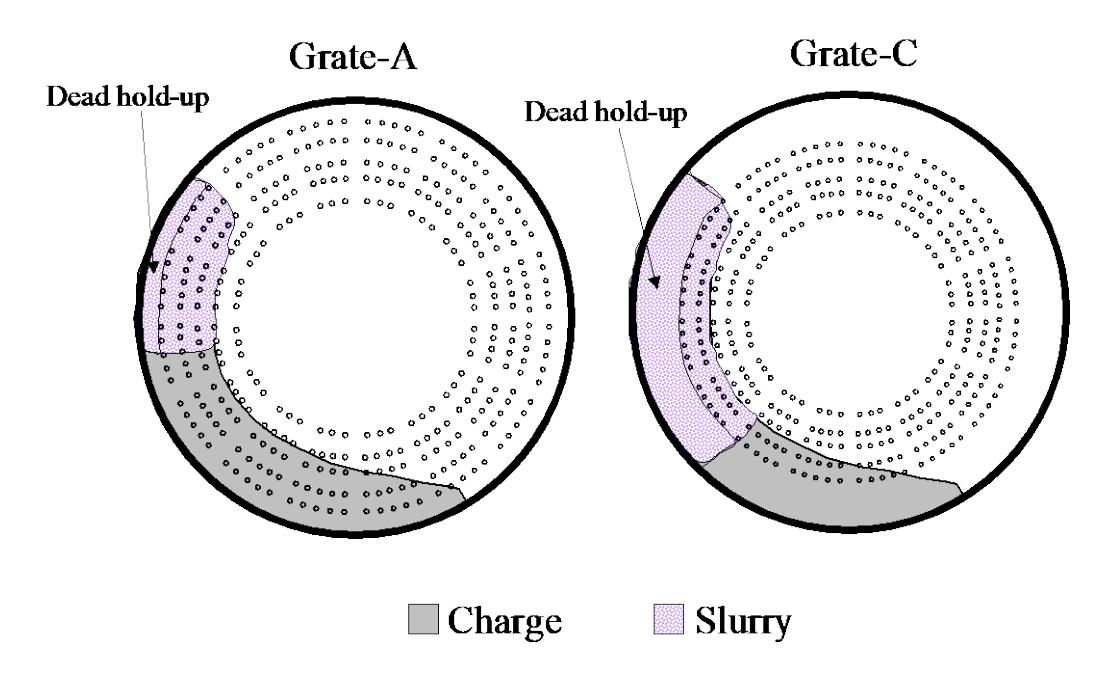
It can be seen from Figure 15 that the hold-up increases with decreasing radial position of holes (Grate-A to Grate-C). This is due to the fact that there is a greater amount of hold-up that needs to be filled in the section which sits between the outermost row of holes and the mill shell. Since this part of the hold-up does not directly contribute to flow it is called "dead" hold-up (Figure 16).
SUMMARY AND CONCLUSIONS
The build-up of slurry (hold-up) inside the mill, first starts from the shoulder of the charge, while the toe position of the slurry progressively moves towards the toe of the charge as flowrate increases. Once the interstices of the charge are saturated, accumulation of slurry near the toe position of the charge occurs which leads to the formation of a pool.
The grinding media/ charge plays an important role on mill hold-up which is essentially held in its interstices, and is found to be influenced by mill speed and charge volume. The influence of mill speed, on variation in voidage of charge, is found to be highly dependent on the volume of charge – minimum at high charge volumes and maximum at lower charge volumes due to variation in bulk density which effects the dilation of the tumbling charge. Estimation of this variation in dynamic porosity of the tumbling charge would provide the maximum slurry hold-up that can be held in grinding media without a slurry pool - the condition required for the best grinding efficiency.
Both open area and position of holes on discharge grate are experiential to have a strong influence on hold-up. It is apparent from the results that the hold-up is more controlled by the grinding media/charge rather than the grate open area, especially when the flow is through the porous charge. The results suggest that the position of holes on the grate should be as close as possible towards the mill shell to have maximum gradient for flow of slurry.
ACKNOWLEDGEMENTS
The fellowship provided by AusAID and the financial support of the sponsors of the AMIRA P9L project are gratefully acknowledged.
REFERENCES
- 1. Austin, L.G., Klimpel, R.R. and Luckie, P.T., 1984. Process engineering of size reduction: ball milling. SME-AIME, New York.
- 2. Abouzeid, A.-ZM., and Fuerstenau, D.W., 1980. Scale-up of particulate hold-up in rotatry drums. Powder Technology, 25 : 65.
- 3. Gupta, V.K., Hodouin, D and Everell, M.D., 1981. The influence of pulp composition and feed rate on hold-up weight and mean residence time of solids in a grate discharge ball mill grinding. Int. J. Miner. Process, 8 : 345.
- 4. Hogg, R., and Rogovin, Z., 1982. Mass transport in wet overflow ball mills. XIV International Mineral Processing Congress, CIM., Paper no. I-7, Toronto, Canada.
- 5. Klimpel, R.C., Austin, L.G. and Hogg, R., 1989. The mass transport of slurry and solids in a laboratory overflow ball mill. Minerals and metallurgical Processing, 6 : 73.
- 6. Moys, M.H., 1986. The effect of grate design on the behaviour of grate discharge mills, Int. J. Miner Process, 18 : 85.
- 7. Morrell, S and Stephenson, I., 1996. Slurry discharge capacity of autogenous and semi- autogenous mills and the effect of grate design. Int. J. Miner. Process, 46(1-2) : 53.
- 8. Napier-Munn, T.J., Morrell S., Morrison, R.D., Kojovic, T. 1996. Mineral Comminution Circuits – Their operation and optimisation, JKMRC Monograph Series Mining and Mineral Processing 2, Eds: Nappier-Munn
- 9. Nasr-El-Din, H.A., Afcan, A., Masliyah, J.H. and Foster, J., 1992. Slurry transport in horizontal rotary drums with an end-constriction. Powder Technology, 71 : 251.
- 10. Songfack, P and Rajamani R., 1999. Hold-up studies in a pilot scale continuous ball mill: dynamic variations due to changes in operating variables. Int. J. Miner. Process, 57 : 105.