



The content on this page was automatically generated from the PDF publication document and may contain errors or inaccuracies. Please refer to the original PDF for the most accurate information.
THE APPROPRIATENESS OF THE TRANSFER SIZE IN AG AND SAG MILL CIRCUIT DESIGN
S. Morrell
SMCC Pty Ltd Pty Ltd 220 Tinarra Crescent Brisbane, Australia
ABSTRACT
The AG/SAG circuit discharge P80 is now increasingly referred to as the "Transfer Size" or T80 for short. From the literature it is apparent that in circuit design some approaches to the sizing of AG/SAG mills as well as the ball mills that they feed use this parameter. This paper reviews whether the use of the T80 is appropriate in this context. In the course of the review examples of AG/SAG discharge size distributions measured from range of operating circuits are used to illustrate the arguments made.
KEYWORDS
Design, Transfer Size
INTRODUCTION
So-called "power-based" equations, despite the advances made in simulation, still remain the principle method for designers to size mills and estimate the power requirement for comminution circuits. In principle the technique is very simple, relying on the designer to specify a feed and product size plus a hardness index. From these inputs the equation produces a specific energy value (kWh/t). The power requirement is then the product of the throughput desired for the circuit multiplied by this specific energy. Once this value is known a mill size is then selected which will draw this power. The simplicity of this approach makes it very attractive, but there are a number of significant problems with it. Specifically, before the approach can be used the designer has to provide the feed size, product size and hardness parameters. In addition he/she has to ensure that the equations in question will provide accurate answers. This paper concentrates on one of the problems as it relates to AG/SAG circuits followed by ball mills, viz. what size should be used for the AG/SAG mill product? In recent years this product size has become known as the "Transfer Size" and is normally specified as an 80th percent passing value or "T80" for short.
POWER BASED EQUATIONS
The best known and probably most widely used power-based equation is that proposed by Bond (1961) and is given in equation 1 and was originally developed for use with crusher/rod mill/ball mill circuits.
$$ W = 10 \times Wi \times (P^{-0.5} - F^{-0.5}) $$ (1)
where
W = Specific energy
Wi = Work (hardness) index
P = 80% passing size for the product (P80) F = 80% passing size for the feed (F80)
More recently Morrell (2004) proposed an alternative equation as described in equation 2 and was developed for use with crusher/HPGR/AG/SAG/Ball mill circuits The general size reduction equation is as follows :
$$ W = 4 x Mi x (P^{f(P)} - F^{f(F)}) $$ (2)
where
W = Specific energy
Mi = Work (hardness) index
P = 80% passing size for the product (P80)
F = 80% passing size for the feed (F80)
f(xj) = -(0.295 + xj
                      /1000000) (Morrell, 2006)
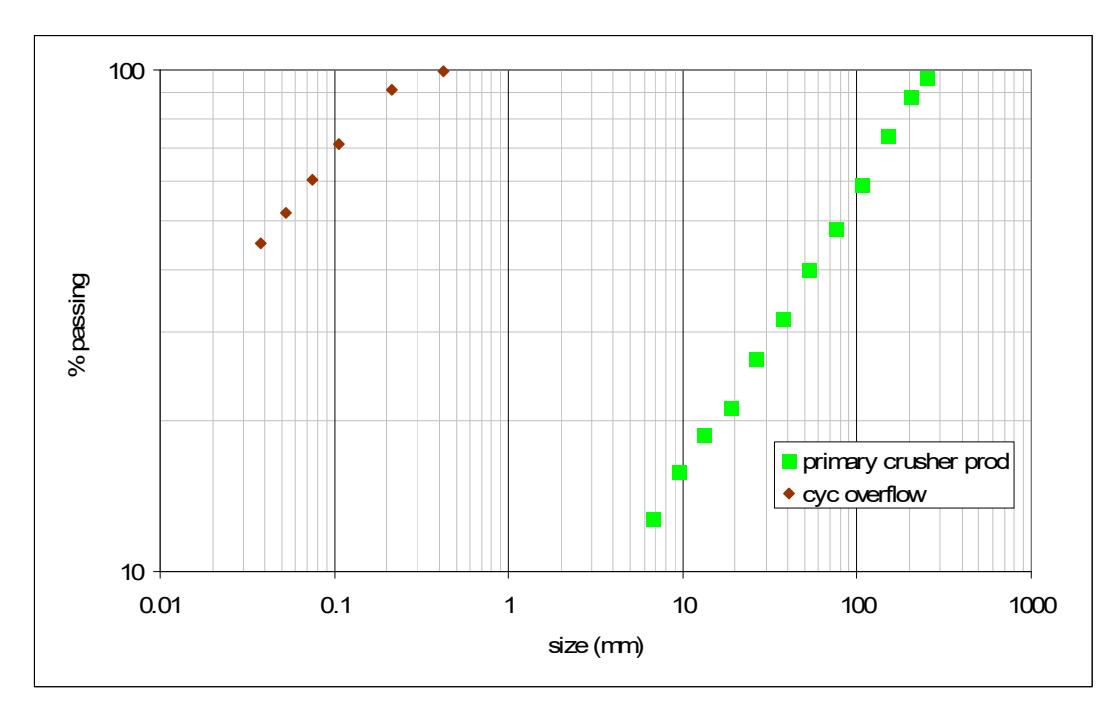
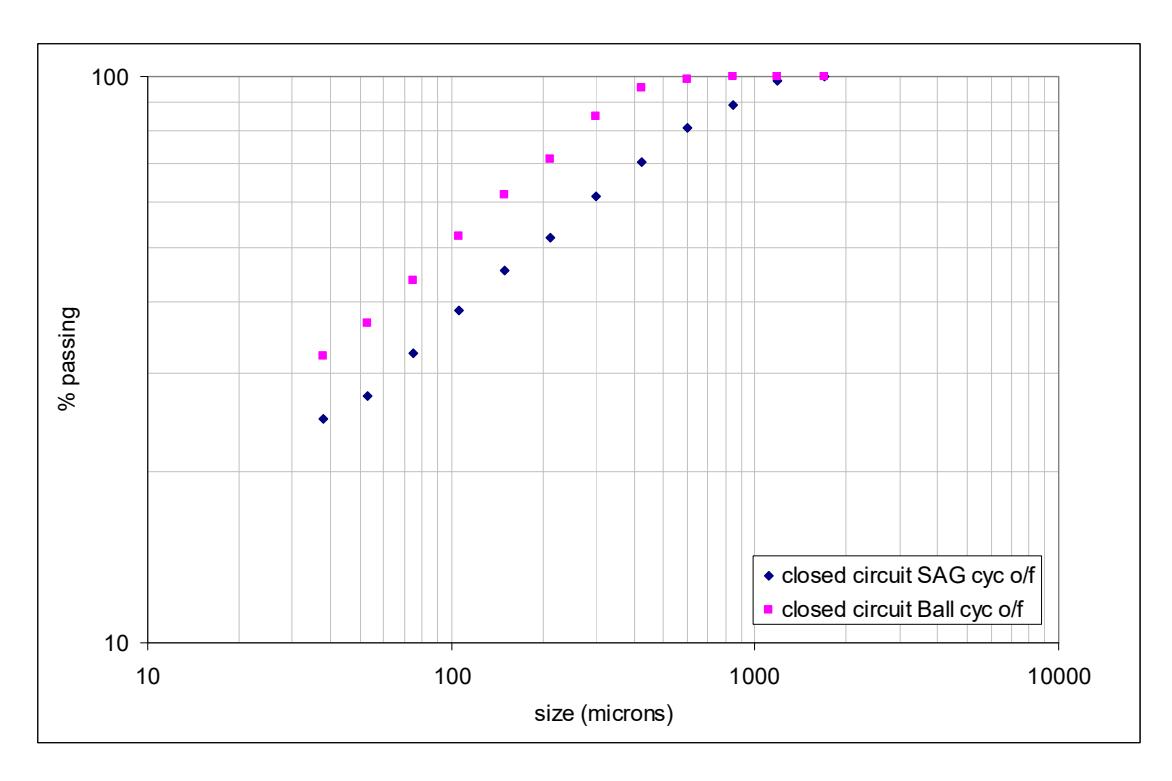
The general form of both equations is similar, their principle difference being in the exponents used for the P80 and the F80. Regardless of these differences they both rely on the size distributions of the feed and product to be described by a single point (the 80th percent passing value). For this to be effective and hence for the equations to be valid the feed and product size distributions need to be parallel to one another on a log-log plot over most of the distribution (at least up to the 80th percentile point). A good examples of this condition, and hence where power-based equations would be applicable, are illustrated in Figures 1 and 2 which show a primary crusher product and cyclone overflow distribution measured from an operating SABC circuit and a SAG mill closed with large diameter cyclones feeding a closed circuit ball mill respectively. By and large it is found that the primary crusher product size distribution is reasonable parallel to the ball mill cyclone overflow. With some extremely friable ores crusher product size distributions may depart from this condition but such cases are not very common. It is also normally found that the gradient of the ball mill cyclone overflow is similar from plant to plant and is of the order of 0.5, a phenomenon observed by Bond (1961). Similarly most plant data show that where the AG/SAG mill is in closed circuit with cyclones (or very fine screens such as DSM screens) its product is also similar in shape to a typical ball mill cyclone overflow.
Problems (inaccuracies), however, arise when applying power-based equations when the feed and/or product size distributions depart from this condition, and the more they depart the more inaccurate will become the predictions. In the case of SAB/SABC circuits the transfer size is the product of the SAG mill circuit and the feed of the ball mill circuit. Hence if power-based equations such as eq. 1 and eq. 2 are to be used to predict the SAG mill circuit and ball mill circuit specific energies it is important to ascertain:
- 1. whether the transfer distributions obey the parallel conditions
- 2. what the appropriate T80 value should be for a given ore type, circuit configuration, mill geometry and operating condition
TRANSFER SIZE DISTRIBUTIONS
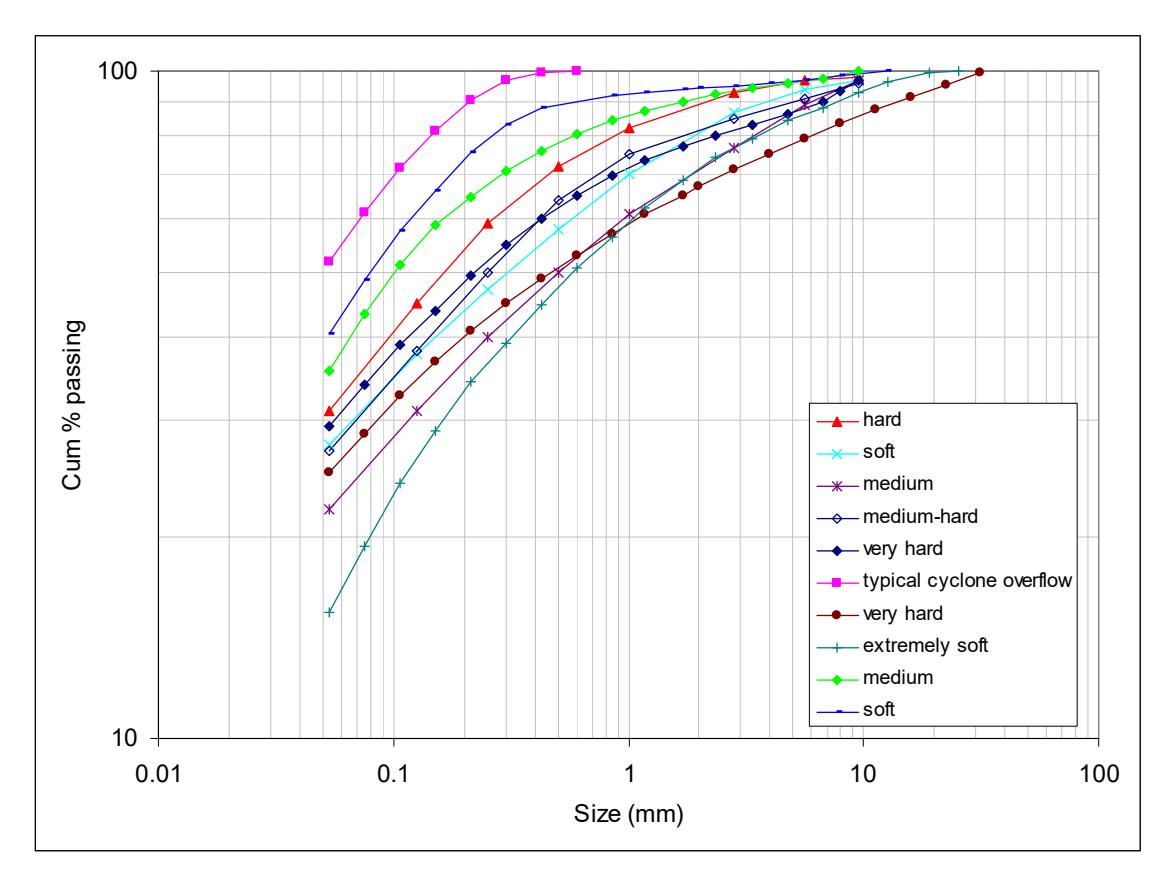
In answer to the first question posed in the previous section – "Are AG/SAG mill transfer distributions parallel to the ball mill cyclone overflow", the answer is mostly "No" unless they are being operated in closed circuit with cyclones/fine screens. Figure 3 shows a number of transfer distributions collected during surveys of operating AG/SAG circuits to support this view. A typical cyclone overflow distribution is also shown for comparison purposes. The distributions can be seen to vary widely in terms of their shape and T80 and that the majority are not parallel to the cyclone overflow. The reason for this is that in most AG/SAG circuits they are operated in closed circuit with relatively large aperture trommels/screens. Recirculating loads as a result are very low (usually less than 25%), particularly when compared to closed circuit ball mills (250%). This means that such AG/SAG mills are effectively in open circuit.
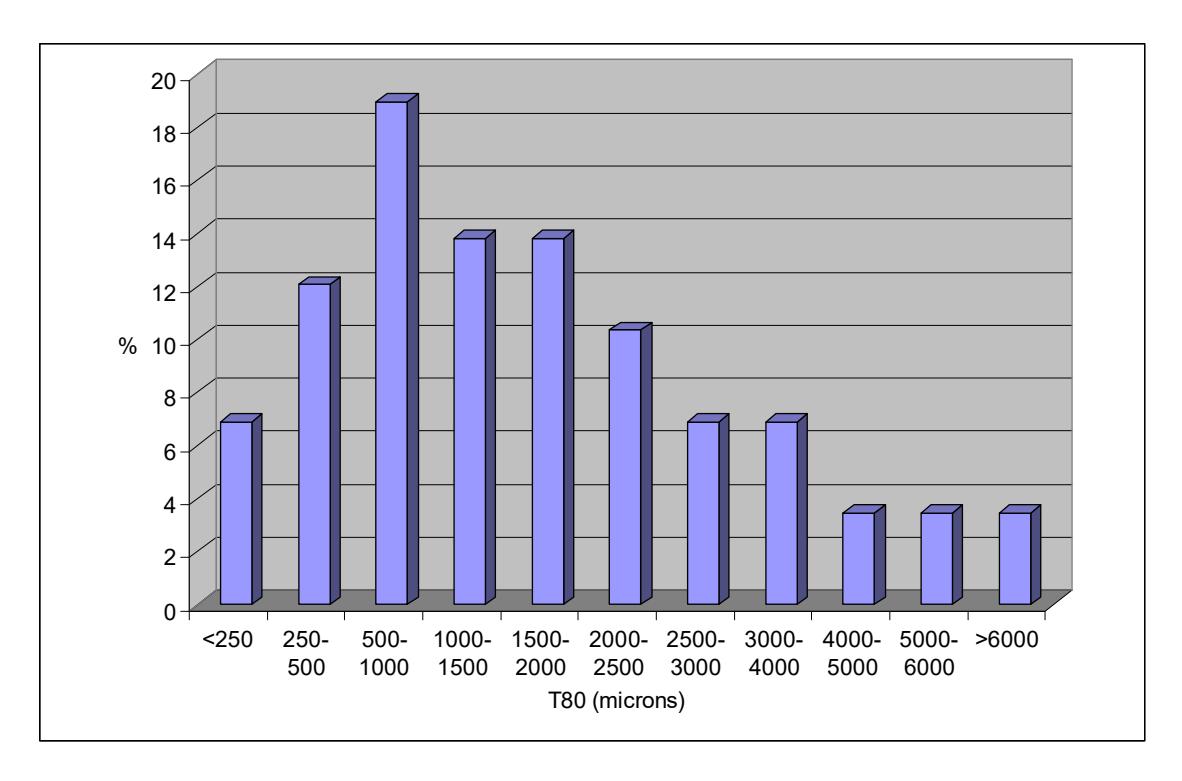
SMCC has a large data base of transfer size distributions and Figure 4 is presented as a summary of this data base. The data relate only to AG and SAG mills which are operated in closed circuit with trommels or relatively coarse screens (typically with apertures >10mm). As can be seen the distribution is very broad and varies from a minimum of <250 microns and a maximum of over 6000 microns. The modal class is 500-1000 microns and the mean is 1900 microns.
A first look at the data in Figures 3 and 4, therefore indicates that not only is there a very wide range of T80 values, but in most cases they do not conform to the conditions required for power-based equations to be applied.
Even if the parallel distribution criterion was met, the question remains for the plant designer – "What T80 should I use?". Clearly the data in Figure 4 indicate there is a wide range to choose from, though it is possible that there are some clear trends within the data that might provide rules as to what T80 values should be applied in a particular circumstance. Close inspection of the data reveals that there are some trends but they are far from distinct enough to allow relationship or rules to be developed. For example a number of the very fine transfer sizes come from mills with very low aspect ratios (mill length long in relation to diameter). However, similar T80's have been produced by high aspect ratio mills running in AG mode. At the other end of the spectrum some of the very coarse T80 values have been measured at sites with very large trommel apertures (35mm for example). However, similar T80's have been produced at sites with very fine feeds and trommel apertures of 12-15mm. It may have been surmised that hardness would have an impact on the T80, but once again the evidence for this is conflicting. This is very clear from the data in Figure 3, each of the plots having a hardness indicator attached to them. As can be seen it is difficult if not impossible to see any correlation between ore hardness and transfer size.
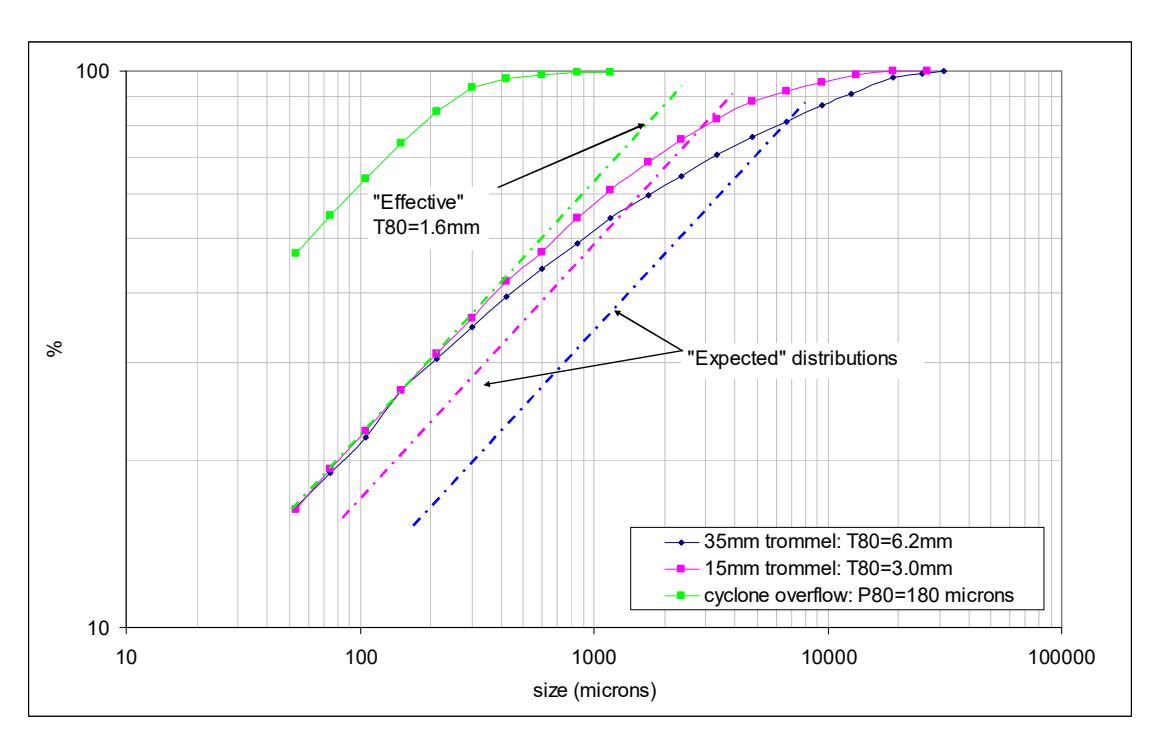
Even if it were possible to predict what the T80 would be for a particular ore, mill geometry and circuit configuration, the issue of non-conformity of distribution shape remains to be dealt with. The implications of this are illustrated in Figure 5. Two trommel undersize distributions are shown, one being from an aperture of 15mm and the other from 35mm. The effective (ie conforming to the expectation of a power-based equation) T80 of both is 1.6mm as found by extrapolating the distributions above about 300 microns using a line parallel to the ball mill cyclone overflow. The actual T80 values as read off the distributions are 3mm and 6.2mm – considerably different to 1.6mm. Also shown are the expected distributions, from the perspective of a power-based equation, of T80 values of 3mm and 6.2mm. As can be seen they are completely different to the measured distributions.
The conclusions from this analysis are:
- x The lack of clear correlations between the T80 of AG/SAG mills and other factors such as equipment geometry, ore hardness and operating conditions makes it very difficult for a designer to choose a T80 that is likely to be matched by the true value of the circuit being designed.
- x Even if it were possible to accurately predict the T80, the measured distributions from existing circuits indicate considerable non-conformity to the requirement that they are parallel to the ball mill cyclone overflow, therefore rendering the use of power-based equations in the design process inappropriate.
SIGNIFICANCE of T80 VALUE IN CALCULATING SPECIFIC ENERGY
Although the data in Figure 5 clearly show problems with the shape of the transfer distributions being incorrect for the application of power-based calculations, it is possible that despite this, significant differences in the assumed T80 values might have relatively little effect on the resultant circuit specific energies. In which case it could be argued that it does not really matter what T80 is chosen. To test this view the data in Table 1 were generated. A very simple approach was taken for purposes of illustration only and it is not suggested nor recommended that the same approach is adopted by designers to design AG/SAG ball mill circuits. A hypothetical case is considered where the Bond ball work index is 15 kWh/t. Design "lore" has it that the specific energy of a SAB/SABC circuit can be estimated by applying the Bond equation (eq. 1) using the SAG mill feed (F80) and ball mill circuit product (P80). An "inefficiency" factor (sometimes referred to as the fsag) is then applied to this value to arrive at the overall circuit specific energy. In the case considered this factor is 1.17 giving rise to the value of 12.5 kWh/t as the overall circuit specific energy. The so-called "power split", which is the amount of this total value which is required to be delivered by the SAG mill and the ball mill, is then determined by applying Bond's equation once again. This time the T80 and P80 values are used. This gives the ball mill specific energy, the SAG mill specific energy being the difference between the ball mill and total specific energy. 3 cases are considered in Table 1, the T80 values being the same as those shown in Figure 5. As can be seen, the difference between choosing a T80 of 1.6mm and 6.2mm is a sizeable 25% in ball mill power and a huge 55% in the case of the SAG mill. The conclusion from this is that it clearly matters a great deal as to what T80 is chosen if the mill circuit is to be designed correctly.
| BWi | kWh/t | 15 | 15 | 15 | |
| F80 | microns | 100000 | 100000 | 100000 | |
| T80 | microns | 6200 | 3000 | 1600 | |
| P80 | microns | 180 | 180 | 180 | |
| Predictions | |||||
| SAG mill specific energy | kWh/t | 3.3 | 4.1 | 5.1 | |
| Ball mill specific energy | kWh/t | 9.3 | 8.4 | 7.4 | |
| Total mill specific energy | kWh/t | 12.5 | 12.5 | 12.5 | |
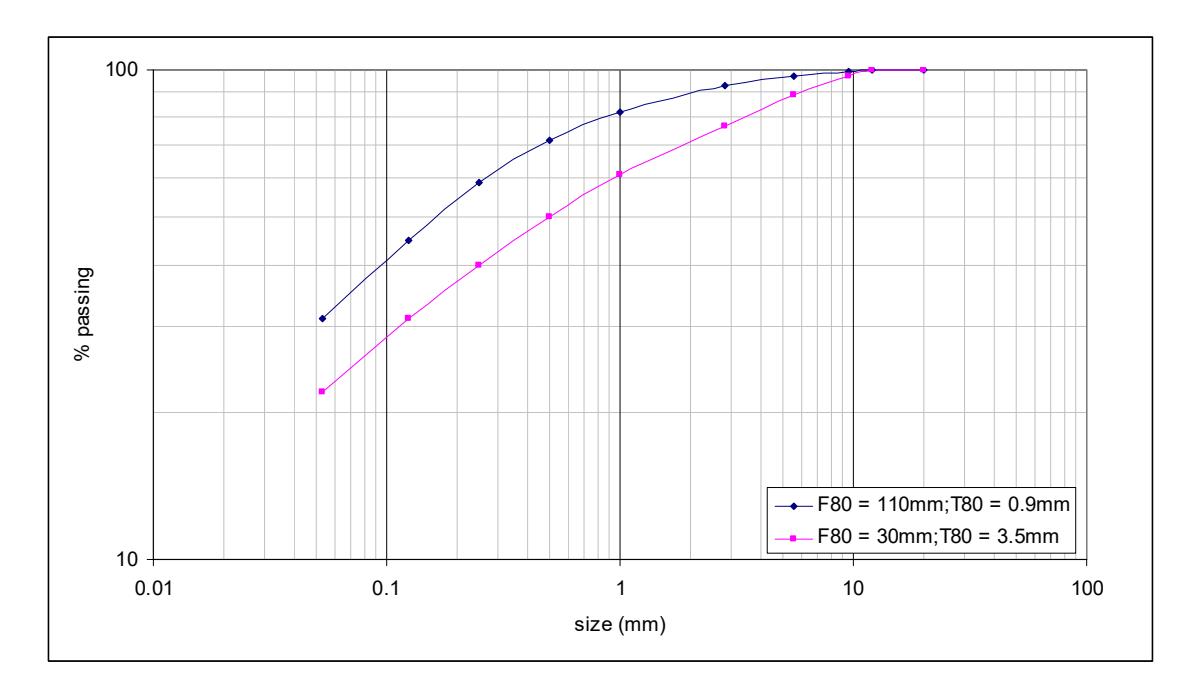
Despite the evidence against the use of the T80 in AG/SAG/ball mill circuit design, the author has been involved in projects where it has been claimed that it does not matter if the incorrect T80 is chosen at the design stage as it can be changed to suit once the circuit is in operation. Alternatively it is argued that throughput via the SAG mill can be simply increased by selecting a larger transfer size. These arguments pre-suppose that there is, what amounts to, a T80 controller in operating circuits that can be adjusted by operational staff and that the AG/SAG mill specific energy (throughput) would then be increased or decreased by this action. As AG/SAG mills are mostly operated in very near to open circuit conditions (very low recycle loads) the transfer size is a product of the feedrate, the operation of the AG/SAG mill and its geometry and not the other way around. To borrow an expression from the medical world, the T80 is a symptom of AG/SAG mill performance (throughput) not the cause. This is not to say that there are not correlations between throughput and transfer size. One of the strongest is seen when secondary crushing is installed in SAG circuits. Secondary crushing SAG mill feed can result in very large increases in throughput and it is associated with a very marked shift in the T80. Figure 6 shows data from such a circuit which demonstrates this very clearly, the T80 increasing from 0.9mm to 3.5mm as the feed was crushed from its original value of 110mm to 30mm. The SAG mill throughput in this plant increased by over 50% as a result of this. It is emphasised that the T80 increase did not cause the throughput increase, the crushing of the SAG mill feed did.
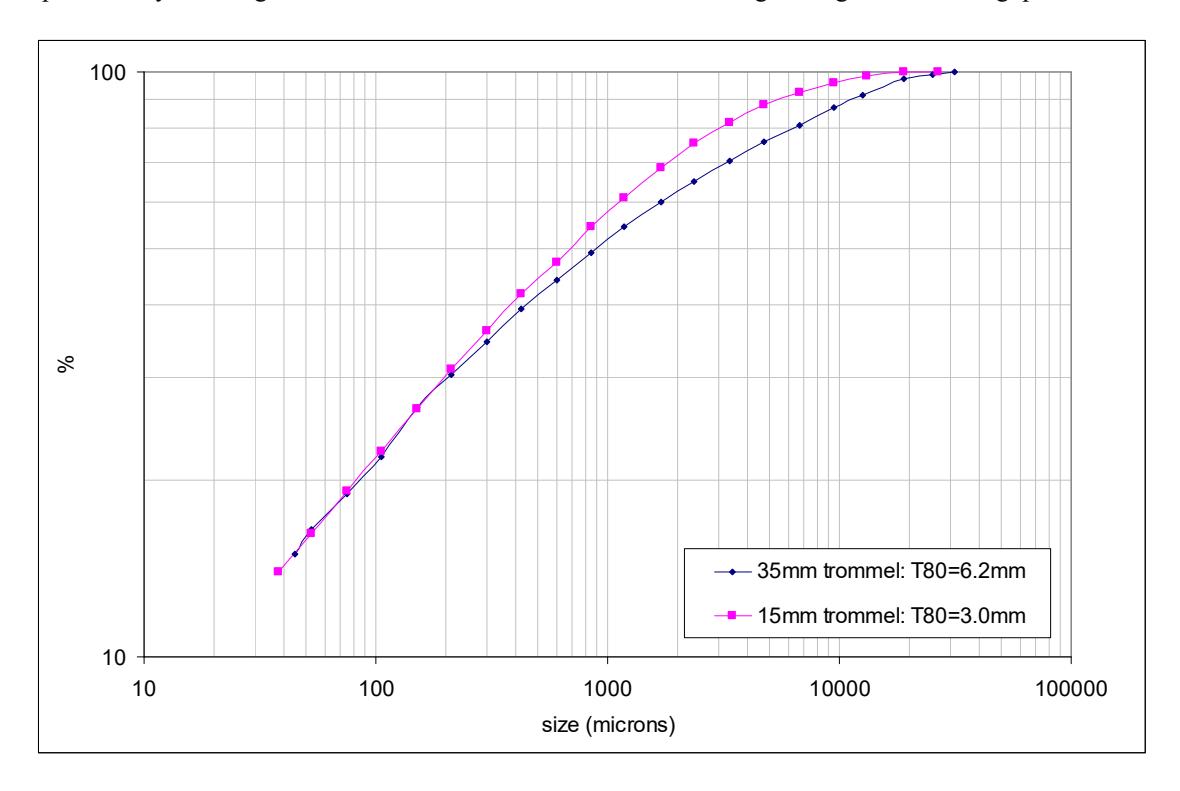
One way of changing the T80 with relative ease in a circuit is to adjust the trommel aperture. Figure 7 shows the influence that this had in a SAG circuit when this as done. The T80 increased from 3mm to 6.2mm as a result. What is clear from Figure 7, however, is that the change in T80 is not reflected in changes to the finer end of the distribution. The increase in trommel aperture has simply caused there to be a shift in the coarse "tail" of the distribution. As a result the effect in the plant was an increase in SAG mill throughput of less than 5%. From power-based calculations using these T80 values (see Table 1) the predicted increase should have been 25%. It is concluded, therefore, that even though changing trommel aperture may cause significant shifts in the T80 it will not result in large changes in the throughput.
SIMULATIONS and the "PHANTOM" CYCLONE
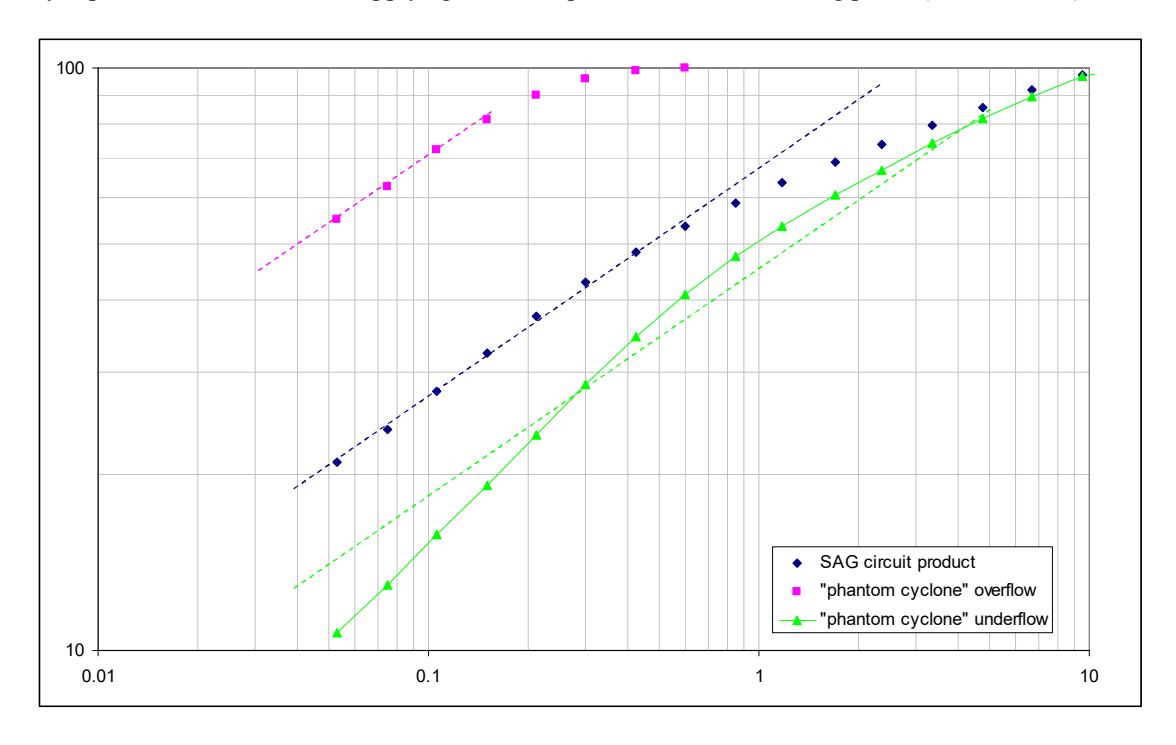
One way of predicting the transfer size is to use simulations. To do so the simulation model has to be very accurate and the model has to be used in an appropriate manner. Even if there is confidence that the simulation has predicted the correct transfer size distribution there is still the issue of how to correct for the fact that the distribution will still be the wrong shape to apply power-based equations to size the ball mill circuit. The so-called "phantom cyclone" approach is often mentioned in this context. This approach uses simulations to feed the predicted SAG mill transfer distribution to a cyclone which classifies it so as to generate an overflow distribution with the same size as the one targeted for the ball mill cyclone overflow. It is argued by proponents of this approach that the predicted cyclone underflow size distribution and throughput can then be used in conjunction with power-based equations to predict the specific energy of the ball mill circuit. The argument is that this "phantom" cyclone gives an underflow distribution which satisfies the power-based equation criteria for shape, ie it is parallel to the ball mill cyclone overflow.
Figure 8 shows the distributions from conducting such an exercise and it can be seen that the underflow distribution does not satisfy the criterion that it was meant to, ie it is not parallel to the ball mill cyclone overflow. The added problem with this approach is that in practice ore bodies are not homogenous with respect to hardness. Hence the feed ore will normally have harder and softer components in it. The softer components will naturally tend to congregate in the finer fractions of the SAG mill product whilst the reverse will be true for the harder ones. As a result the cyclone underflow material will tend to be harder than the overflow. In the context of the phantom cyclone this means that if the cyclone underflow stream is used for design it will also have to have a Bond work index value which is higher than that from the head feed. It is not possible to determine what this value should be at the design stage. This fact plus the size distribution non-conformity also renders this approach inappropriate. This conclusion is supported by experimental evidence from applying the technique in a number of existing plants (Morrell, 2001).
ALTERNATIVE TO USING THE T80
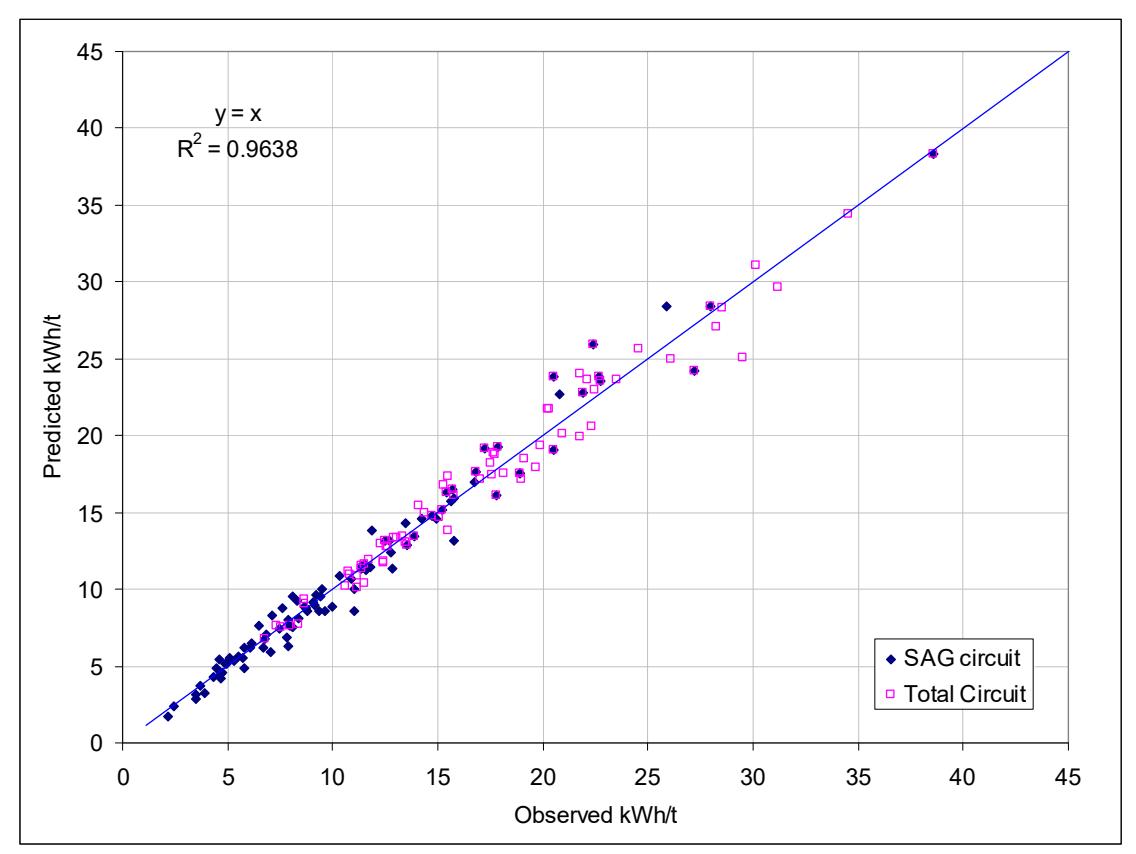
So far this paper has provided evidence that the use of the T80 in power-based equations for SABC circuit design is not appropriate. The question for the designer remains as to "What approach should be used?". SMCC has adopted an approach in which the total specific energy of the entire circuit is firstly predicted using the SAG mill feed F80 and the ball mill cyclone overflow P80. Details of the equation for this purpose is described in detail in the literature (Morrell, 2008, 2009, 2010). The AG/SAG mill circuit specific energy is then predicted using an equation (model) which does not rely on the T80 but relates the feed, mill geometry and operating conditions to the specific energy. The form of this equation is as shown in equation 3 (Morrell, 2004). The ball mill specific energy is then found by subtracting the AG/SAG mill specific energy from the total circuit specific energy. The approach has been validated using 100 full scale circuits, the accuracy being as shown in Figure 9.
S =
$$ K.F_{80}^{a}.DW_{i}^{b}.(1+c(1-e^{-dJ}))^{-1}\phi^{e}.f(A_{r}).g(x) $$
where
S = specific energy at the pinion
\( F_{80} \)
= 80% passing size of the feed
\( DW_i \) = drop-weight index (from the SMC Test®)
\( \begin{array}{ll} J & = volume \ of \ balls \ (\%) \\ \varphi & = mill \ speed \ (\% \ of \ critical) \\ f(A_r) & = function \ of \ mill \ aspect \ ratio \\ g(x) & = function \ of \ trommel \ aperture \end{array} \)
a,b,c,d,e,f,g = constants
K = function whose value is dependent upon whether a pebble crusher is in-circuit
CONCLUSIONS
Evidence has been provided that the use of the T80 in power-based equations for AG/SAG circuit design is not appropriate. This is due to the fact that the transfer size distribution is not normally parallel to the cyclone overflow – an essential condition for the application of power-based equations. In addition there exists a very wide range of transfer sizes, as measured in existing plants, and these do not appear to be related in any clear way to factors such as the feed, mill geometry and operating conditions. This presents considerable problems for the designer in choosing an appropriate value for a given design situation. Mistakes in choosing the correct value can result in circuits being between 25-55% over/undersized.
An alternative approach to using the transfer size is described which on the basis of 100 existing circuits appears to provide a high degree of accuracy in predicting AG/SAG circuit specific energy without the use of transfer sizes.
REFERENCES
Morrell, S.,( 2001). Large diameter sag mills need large diameter ball mills What are the issues? SAG 2001, Vancouver, B.C. Canada, pp 179-193
Morrell, S.(2008). A method for predicting the specific energy requirement of comminution circuits and assessing their energy utilisation efficiency , Minerals Engineering, Volume 21, Issue 3, February, Pages 224-233
Morrell, S., (2004). An Alternative Energy-Size Relationship To That Proposed By Bond For The Design and Optimisation Of Grinding Circuits. International Journal of Mineral Processing, Volume 74, Issues 1- 4, 19 November, Pages 133-141.
Morrell, S.(2004). Predicting the Specific Energy of Autogenous and Semi-autogenous Mills from Small Diameter Drill Core Samples. Minerals Engineering, Volume 17, Issue 3, March, Pages 447-451
Morrell, S.(2009).Predicting the overall specific energy requirement of crushing, high pressure grinding roll and tumbling mill circuits, Minerals Engineering, Volume 22, Issue 6, May, Pages 544-549
Morrell, S.(2010). Predicting the specific energy required for size reduction of relatively coarse feeds in conventional crushers and high pressure grinding rolls, minerals engineering Volume 23, Issue 2, January, Pages 151-153
Bond, F.C., (1961) (revised 1962). Crushing and Grinding Calculations. Allis-Chalmers publication O7R9235B