



The content on this page was automatically generated from the PDF publication document and may contain errors or inaccuracies. Please refer to the original PDF for the most accurate information.
THE DECISION TO OPT FOR HIGH PRESSURE GRINDING ROLLS FOR THE BODDINGTON EXPANSION
Βv
1Brendan Parker, 2Peter Rowe, 3Greg Lane, 4Steve Morrell 1Process Superintendent, Boddington Gold – Boddington Expansion 2General Manager, Boddington Gold Min e 3Principal Process Engineer, GRD Minproc Limited 4Consultant, SMCC Pty Ltd, Australia
INTRODUCTION
This paper presents a summary of the decision making process that resulted in the selection of high pressure grinding roll (HPGR) technology instead of the more conventional semi-autogenous milling and pebble crushing (SABC circuit) for the 25 Mt/a Boddington Expansion project.
The Boddington Expansion relates to the large -tonnage, low-grade, gold-copper resource situated beneath the oxide cap of the Boddin gton Gold Mine (BGM). BGM is jointly owned by Normandy Boddington Pty Ltd (44.44%), AngloGold Australasia Limited (33.33%) and Newcrest Operations Limited (22.22%). The mine is situated 12 kilometres north -west of the town of Boddington and 100 kilometres south of Perth in Western Australia. The current resource estimate stands at 726 million tonnes at 0.84 g/t of gold and 0.11 per cent copper. The resource contains 19.7 million ounces of gold and 790,000 tonnes of copper in the North and South mining areas. The North mining area incorporates resources from the area previously owned by Hedges Gold which was acquired at the end of 1998. Figure 1 shows the mine and plant area.
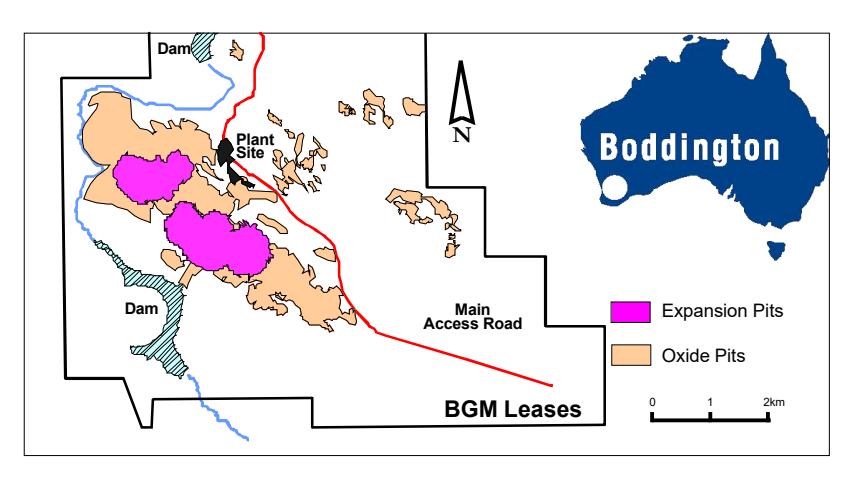
The proposed treatment plant will process 25 Mt/a of ore from a mine reserve of 405 Mt with an average grade of 0.91 g/t Au, 0.12% Cu and 0.23% S.
The ore is a combination of competent diorite and andesite, with typical ball mill work indices of 14 to 17 kWh/t, rod mill work indices of 21 to 26 kWh/t and unconfined compressive strengths of 150 to 200 MPa.
Production of gold from oxide ores at BGM began in August 1987 and is planned to continue into the last quarter of 2001 when the oxide ore will be depleted. Metallurgical testwork on basement resources commenced as early as 1989. A trial pit was developed in 1996, allowing access to the main diorite stock for generation of bulk samples. A number of mining and processing options were examined during 1996, culminating in a pre-feasibility study report being presented in March 1997.
A feasibility study commenced in 1999 and was completed in November 2000. The study is currently under review.
MINERALOGY AND ORE CHARACTERISTICS
Mineralogy
Mineralogical investigations have provided a detailed account of the nature and location of gold and copper minerals in the ore. The median gold particle size is 11 microns, therefore gold association and liberation are of paramount importance in maximising recovery. The association of gold with silicate is the most significant cause of non -recovery of gold by flotation and cyanidation of flotation tailings. Gold in the major ore types is often associated with silver as an electrum and is also closely associated with native bismuth and some bismu thinite. Copper occurs primarily as chalcopyrite with cubanite, bornite and chalcocite also present in small quantities (the latter primarily contained within the upper levels or transition zone). Of the remaining sulphide minerals, pyrrhotite and pyrite are the most common. Molybdenite is also present as a minor accessory.
A process of comminution, copper concentrate production by flotation, pyrite concentrate flotation and leaching of the pyrite concentrate and flotation tailings was selected after det ailed consideration of the mineralogy and metallurgical testwork.
A grind of 80 per cent minus 75 micron was selected. Coarser grinds result in overall revenue loss. It is unlikely that process enhancements (other than grinding to uneconomically fine leve ls) will reduce gold losses in the silicate fraction of flotation tailings and this places a maximum ceiling on gold recovery of approximately 90 per cent. Copper recovery is typically 75 per cent.
Ore Characteristics
Bench scale comminution tests have be en conducted on both drill core and rock samples representing the ore types to be processed. The ore characteristics for the various ore types are summarised in Table 1.
Diorite and andesite rocks comprise about 90 per cent of the resource. The remaining 10 per cent is comprised of strongly pervasive altered rocks, intrusions of dolerite and dacitic volcanics.
The major ore types are comprised of rocks of high to extreme competency. The high differential between the rod mill bond work index and ball mill bond work index, the low JK Axb and Ta values and the high UCS data are indicators of resistance to breakage in a SAG mill.
Crushing work indices greater than 30 kWh/t are typical. On the basis of the benchscale data, a traditional SABC circuit was expected to consume approximately 30 per cent more power than typical "Bond" grinding power calculations indicate. This was validated in the pilot plant testwork.
| Ore Type |
% in
Mill Feed |
UCS
MPa |
Ai |
RWI
kWh/t |
BWI
kWh/t |
JK
Axb |
JK
Ta |
|---|---|---|---|---|---|---|---|
| Diorite | 38.0 | 151 | 0.49 | 21.3 | 15.2 | 30.1 | 0.20 |
| Northern Volcanics | 5.7 | 175 | 0.54 | 24.5 | 15.6 | 28.5 | 0.23 |
| Southern Volcanics | 15.7 | 180 | 0.45 | 23.1 | 14.5 | 27.0 | 0.26 |
| Pipeline | 6.0 | 114 | 0.49 | 25.7 | 14.5 | - | - |
| Southern Diorite Deeps | 6.8 | - | 0.27 | 21.4 | 14.9 | - | - |
| Mine North | 27.8 | 110 | 0.51 | 22.8 | 16.0 | - | - |
| Weighted Average | 100 | 161 | 0.48 | 22.4 | 15.3 | 29.1 | 0.22 |
Comminution Testwork
The comminution process evaluation commenced in 1995 and has included extensive testwork programs, including over 100 laboratory comminution tests, four separate SAG mill pilot plant trials and three HPGR pilot plant trials. The comminution testwork has allowed the development of detailed design criteria for the selection and sizing of suitable crushers and mills.
Three successive pilot plant tri als were conducted using a 1.8 metre diameter pilot SAG mill at Amdel in 1995 and 1996. These pilot trials used aphyritic diorite samples from three levels in the South trial pit and a sample of andesite from the Blackbutt pit. The three trials were conducted to answer concerns regarding the representativeness of the samples (impact of oxidation on ore hardness), to validate results and to assess the impact of feed size distribution.
In 1999, a fourth SAG mill pilot plant trial was conducted that included:
· a test using a standard SABC circuit configuration to validate sample selection (compared with previous SABC pilot trials);
- the preparation of approximately 120 tonnes of HPGR product in both open (all -25 mm material) and closed (12 mm screen) circuit using CSIRO's 0.8 metre diameter HPGR;
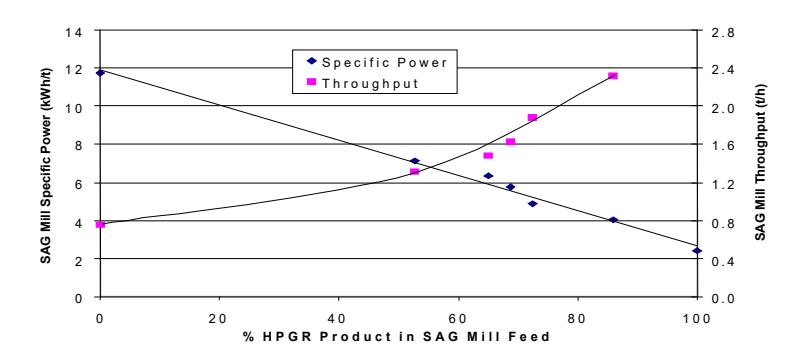
- processing of blends of HPGR product, secondary crushed and primary crushed ore in a SAG/pebble crushing circuit (results shown in 0); and
- milling of HPGR product in a ball mill circ uit.
In 1996, a total of 33 000 tonnes of aphyric diorite ore from the South trial pit was processed through a 0.9 metre diameter studded HPGR and a 1000 kW ball mill at the Boddington Supergene Plant. At that stage, studded-roll technology was in its infancy and concerns about availability and costs of maintaining the wear surfaces of the rolls led to HPGR technology not being considered for the process at that time . However, it was also concluded that HPGR technology provided a power efficient comminution process for the ore.
In 2000, a further evaluation of the impact of screening prior to HPGR crushing on circuit throughput and energy efficiency, feed size distribution, moisture and HPGR specific grinding force (pressure) was conducted using approximately 15 tonnes of aphyric diorite sample processed through the CSIRO's 0.8 metre diameter HPGR unit. This testwork was conducted specifically to allow the construction of an improved model for HPGR operation under the proposed process plant configurations. In addition, the effect of roll speed, feed size distribution and specific grinding force were evaluated to increase the confidence in plant simulations.
The following observations were made based on the HPGR pilot plant trials and parallel vendor testwork:
- the specific throughput decreases linearly with increasing specific grinding force (pressure) when the HPGR feed contains fines (untruncated feed) and has a negligible effect on truncated feed;
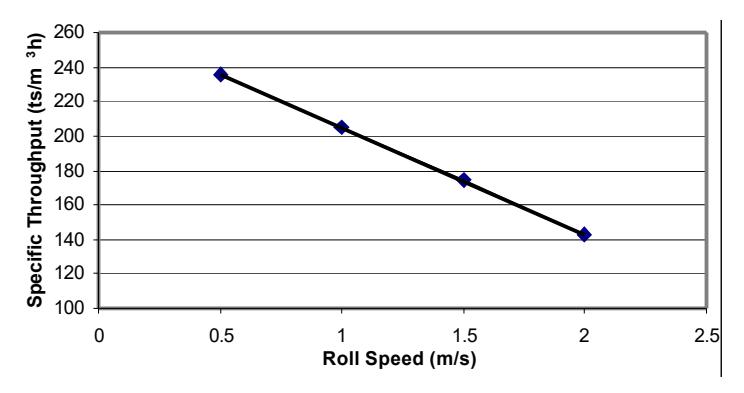
- specific throughput decreases with increasing roll speed, validating previous observations of Morrell et al, 1997 (Figure 3);
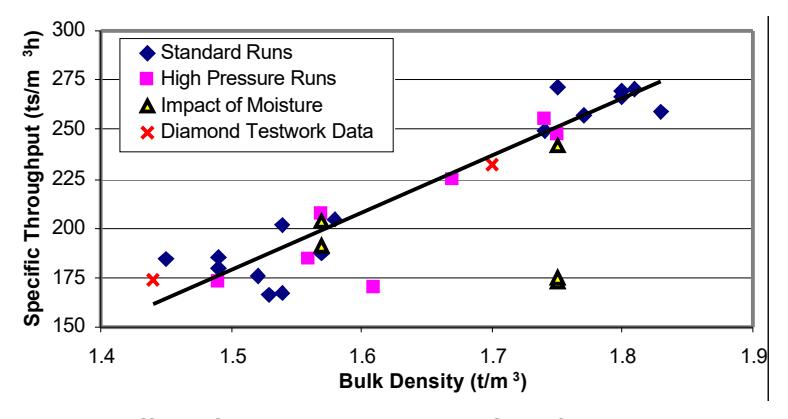
- specific throughput decreases as the bulk density of the feed decreases for all samples tested (Figure 4); and
- the power efficiency of the crushing circuit (kWh/t of screen undersize) increases if finished product is pre-screened from the HPGR feed (truncated feed).
PROCESS EVALUATION AND SELECTION
The viability of the large-tonnage, low grade resource is dependent on economies of scale, both in mining and in processing. Both the unit cost of power and the power utili sation per tonne of ore processed are critical to project viability. In addition, large equipment must be selected. This large equipment tends to be at the leading edge of technology development and a full understanding of the risks associated with selection of this equipment is essential. Comprehensive risk evaluation is required and risk mitigation strategies must be in place.
Three of the process flowsheets considered for the Boddington Expansion comminution circuit are discussed below, where the data from the pilot plant trials were modelled and various flowsheet options were simulated. The power requirements and throughputs for the three circuits are illustrated in Figure 5 and Figure 7 and are summarised in Table 2.
| Item | Case | ||||
|---|---|---|---|---|---|
| SABC | Pre-crush/SABC | HPGR/Ball | |||
| Throughput (t/h) | 1440 | 2600 | 3000 | ||
| Primary crusher | 60 x 110 | 60 x 110 | 60 x 110 | ||
| Secondary crusher | - | MP1000 | 2 MP1000s | ||
| HPGR 1 power (MW) | - | 2.0 to 3.3 | 8.0 | ||
| SAG mill |
12.2m Ø x 6.1m
EGL – 20 MW |
12.2m Ø x 7.3m
EGL – 24 MW |
- | ||
| Pebble crusher | 2 MP1000s | 2 MP1000s | - | ||
| Ball mills - number | Two | Two | Three | ||
| Ball mills - size | 10 MW | 7.9m Ø x 14.4m l | EGL - 16 MW | ||
| Operating power (approx MW) | 33.3 | 51 to 55 | 43 to 53 | ||
| Circuit specific power 2 (approx. motor output) kWh/t | 23.1 | 20.2 to 21.2 | 18 | ||
2 Major equipment only, cyclone feed pumps and sundry drives excluded
The SABC Option
The initial selection of the "traditional" SABC circuit for the early phases of the project was based, primarily, on the following:
- the ability of the SABC circuit to treat the required tonnage in a single train, and
- concerns over HPGR wear surface cost and availability for hard rock applications.
Approval was given in April 1997 to proceed with a full feasibility study based on a "traditional" SABC comminution circuit, incorporating a 20 MW, 40 foot diameter SAG mill followed by two 10 MW ball mills ( Figure 1).
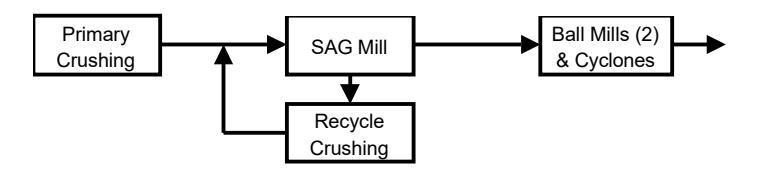
In the course of this feasibility study, it was recognised that project viability would benefit from increases in both throughput rate and the size of the resource. The study team recommended that the owners should continue their resource drilling programme, acquire tenement rights over the neighbouring Hedges Gold mining area (Hedges) and consider a 24 MW SAG mill and 12 MW ball mills. These changes would allow throughput to be increased from 11.2 Mt/a to 13.5 Mt/a. It was also recommended that the owners continue to consider two grinding lines as well as evaluating alternatives to enhance single grinding line performance.
Acquisition of Hedges was completed by the end of 1998 and an intensive drilling programme over 1998 and 1999 led to a 441 million tonne resource estimate being published in August 1999.
The BGM joint venturers granted approval to commence a new feasibility study in 1999. It was initially planned to conclude this feasibility study by the end of 1999. However, an opportunity to significantly enhance single grinding line throughput by introducing HPGR technology was identified early in the study. 1 All units 2.4 m diameter by 1.5 m wide rolls
The high competency of the ore favoured secondary and HPGR crushing of the ore prior to SAG milling to maximise power efficiency and SAG mill throughput. Thus, HPGRs were reconsidered for this application in association with MP1000 secondary crushers in 1999/2000.
Pre-Crush/SABC Option
A pre-crush/SABC circuit with a portion of SAG mill feed pre-crushed through a secondary crusher and HPGR (Figure 2) was evaluated as a low cost option to substantially increase plant throughput by reducin g the combined SAG mill feed stream size distribution. The advantage of this configuration is that the milling circuit may continue to operate (at a reduced tonnage) when the pre-crush circuit is inactive. In addition, an HPGR bypass facility allows the p re-crush circuit to operate with only the secondary crusher active, further reducing the risk associated with the HPGR.
The flowsheet used a single MP 1000 secondary crusher followed by an HPGR crusher to pre-crush approximately half of the primary crushed product before feeding it to the SAG mill.
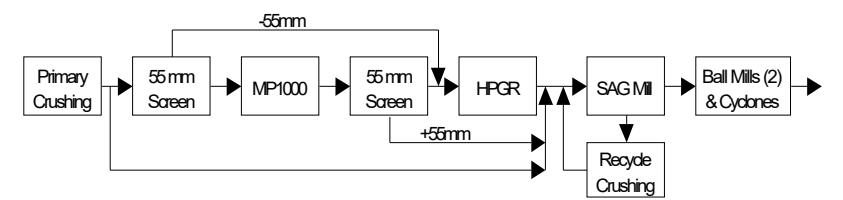
Initial simulation indicated that the circuit would require approximately 50 per cent of the SAG mill feed to be pre-crushed. Below this rate, the SAG mill became the constraint, while above 50 per cent, the ball mills were limiting. This raised the question as to whether the capacity of the pre-crush and ball mill circuits should be increased and the SAG mill capacity decreased, to gain additional throughput an d/or energy efficiency benefits from the HPGR process.
This approach placed a progressively increasing emphasis on the HPGR, resulting in a corresponding decrease in the SAG mill load. The SAG mill specific energy consumption reduced from 11.7 kWh/t for primary crushed product to 2.4 kWh/t for HPGR product. The logical conclusion of this was either:
- the pre-crush/SABC circuit be recommended using the largest available SAG mill and ball mills and optimised for the proportion of pre-crushed ore in the SAG mill feed; or
- the SAG mill should be omitted and a circuit designed using HPGR technology upstream of ball mills.
Modelling of the results of the pilot plant programme indicated that the proposed pre-crush/SABC circuit should achieve 20.8 Mt/a p rovided the SAG mill feed comprised approximately 65 per cent ore from the secondary/HPGR pre-crush circuit. Under these conditions, pilot plant trials indicated that the SAG mill throughput was sensitive to the size distribution of the HPGR product and the feed to pebble crushing increased significantly. Segregation in intermediate stockpiles was likely to cause significant variation in SAG mill throughput.
The pre-crush/SABC circuit contained the complexity of dry screening, had a high reliance on HPGR performance to achieve design throughput, a 24 MW SAG mill, a 5 metre by 10 metre mill discharge screen and 650 millimetre mill discharge pumps. Notwithstanding this, the addition of the HPGR to the SAG mill circuit improved the project economics considerably.
HPGR/Ball Mill Option
Parallel assessment of an HPGR/ball milling circuit indicated significant operating cost savings due to lower specific power consumption. A pilot plant programme was conducted in July 1999 to validate both circuit configurations.
Evaluation of these pilot plant results also indicated that there could be capital cost, operating cost and throughput benefits in considering an HPGR/ball mill circuit. Initial circuit evaluation indicated a nominal throughput of 25 Mt/a.
Subsequent evaluation of the use of HPGR technology led to the consideration of a variety of circuits based on secondary crushing, HPGR crushing and ball milling. This evaluation led to the crushing circuit being closed by double deck banana screens to provide minu s 10 millimetre ball mill feed. Conventional HPGR applications see all fine material presented to the HPGR to maximise HPGR throughput. Prescreening the feed (as is practiced in conventional crushing circuits) decreases the specific throughput of the HP GR, but increases the circuit production rate of minus 10 millimetre material (at a slightly coarser P80).
Dynamic simulation of this circuit ( Figure 3) indicated that crushing circuit utilisation approaching 80 per c ent could be achieved at tonnage throughputs up to 3700 t/h. Combined with ball mills operating at 3000 t/h and 95 per cent utilisation, an overall throughput of 25 Mt/a should be achievable. The 1999 feasibility study (completed in 2000) was based on this flowsheet and the circuit designed for these throughput rates.
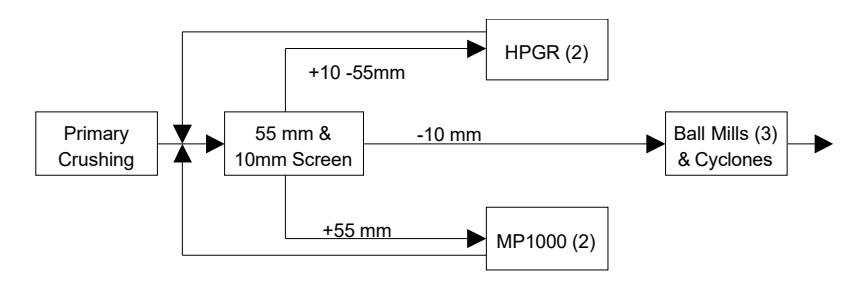
Several other advantages of the HPGR/ball mill circuit were identified including the modular nature of the circ uit, reduced mill discharge pump size and elimination of the 24 MW SAG mill and gearless drive. However, several significant risks were identified during the simulation and circuit design phase including reliance on HPGR technology, the large dry screening plant and the high capacity and complex arrangement of conveyors, trippers and feeders. The risks were evaluated during several risk assessment workshops that compared the pre-crush/SABC and HPGR/ball mill circuits risks, resulting in the decision to adopt the HPGR/ball mill circuit for the feasibility study.
Risk Assessment
During the 2000 feasibility study, risk evaluation workshops and a number of value engineering studies were conducted to evaluate specific processing risks. A process unit constrain t analysis evaluated the risks associated with each of the 25 unit processes in the pre -crush/SAG and HPGR/ball mill flowsheets being considered.
The major comminution circuit risks identified related to the use of HPGR technology and the potenti al for the large diameter ball mills not to meet design throughput and product size.
The HPGR technology risks identified relate to the achievement of the design throughput, availability, roll wear life and product size. A comprehensive analysis of the cu rrent state of HPGR technology and practices was undertaken. HPGR technology was thoroughly reviewed, benchmarked and tested against several operating sites including Argyle, Empire, Cyprus Sierrita, Los Colorados, Premier and Ekati mines. Risk exposure areas are now well understood and have been systematically addressed. Fourteen separate HPGR risk mitigation strategies have been identified and included in the design including the ability to recycle up to 1000 t/h of fines to the HPGRs should truncated feed prove sub-optimal.
The ball mill risks relate to the mills not achieving the designed throughput, availability or product size. A "Ball Mill Risk Analysis" study covered the risk factors in engineering design, manufacturing, supply, erection, commissioning, process operating performance and maintainability of the proposed ball mills. Further studies into mill design, supply, installation and operation from the mill suppliers and both in-house and external consultants were commissioned. In addition, SMCC Pty Ltd was requested to review scale -up and performance of large diameter ball mills. The study presented a collation of existing knowledge, experience and understanding of large mill technology. The main conclusions were that the mill suppliers are confident of their ability to design and supply up to 7.93 metre (26 foot) diameter mills for the project, that there are no particular mechanical design risks for a mill of this size, and what risks there are can be managed. There are no identified proc ess concerns regarding the grinding or slurry transport characteristics of the proposed mills, with all salient parameters falling within the ranges of successfully operating mills.
A risk mitigation strategy adopted during the feasibility study was to opt for an additional HPGR combined with an increase in the top deck screen size (55 mm to 65 mm) and four 13.5 MW ball mills instead of three larger ball mills which were initially proposed. The objective of this strategy was to reduce the size of the HPGRs to match existing operational machines and increase HPGR circuit capacity. The smaller ball mills were also adopted to reduce the component size to within existing design and operational ranges.
Capital Costs and Operating Costs
The indicative comminution circuit capital and operating costs for the conventional SABC, the Pre -crush/SABC and the HPGR/ball mill circuits are summarised in Table 3.
| Parameter | Units | SABC | Pre-crush/SABC | HPGR/Ball Mill |
|---|---|---|---|---|
| Annual Throughput | Mt/a | 11.2 | 20.8 | 25.0 |
| Capital Cost Estimate3 | A$/tpa 12.34 | 7.43 | 5.75 | |
| Operating Cost Estimate | A$/t | 4.18 | 3.32 | 2.95 |
CONCLUSION
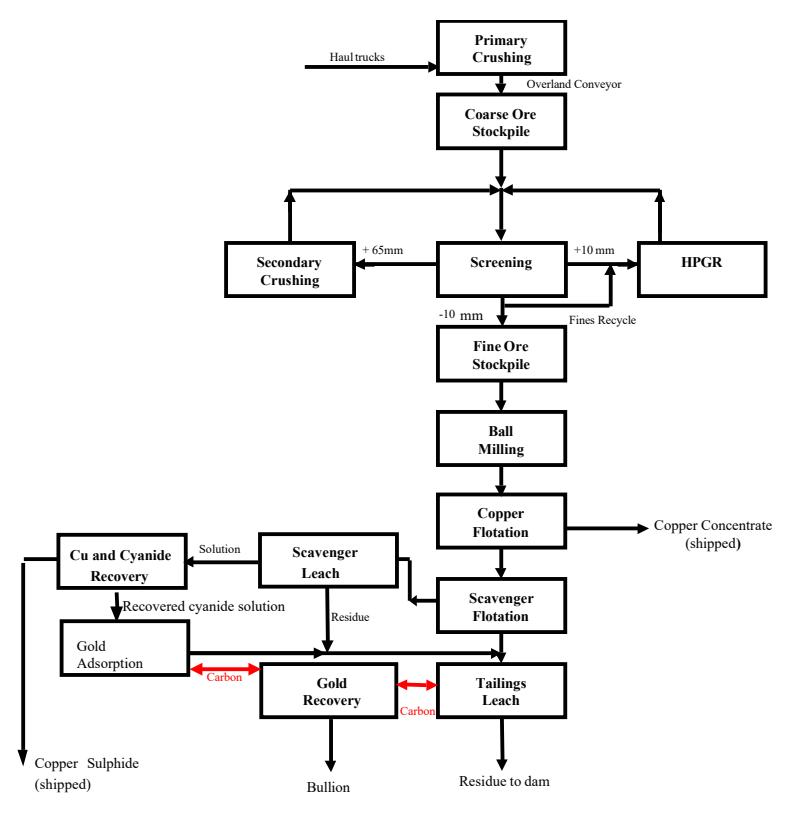
Built on the foundation of a comprehensive and extensive testwork programme, the process flowsheet as shown in Figure 4 was selected. The properties of the ore body make the use of HPGR technology particularly advantageous. The lack of variability in the ore, consistent hardness and competency were key aspects in assessing the risk of HPGR technology. In addition, the low grade requires a high throughput, highly energy efficient flowsheet with low capital and operating costs. Inclusion of HPGRs (making use of the developments in studded roll technology) has resulted in throughput increasing from 11 Mt/a to 25 Mt/a with comminution power utilisation reducing from 23.1 kWh/t to 18 kWh/t. Large equipment has been selected to take advantages of economies of scale. As a result, it was necessary to gain a f ull understanding of the risks associated with selection of this equipment. A comprehensive, ongoing process of risk evaluation, risk mitigation and risk management will be essential to ensure the success of the project.
Acknowledgments
The authors would like to acknowledge the assistance and support of the owners of Boddington Gold Mine in the publishing of this paper. In addition, the input of Fluor Daniel (Australia) Pty Ltd, GRD Minproc Limited and SMCC Pty Ltd in engineering, testwork management, and circuit simulation is acknowledged.
References
Morrell, S., Lim, W., Shi, F., Tondo, L., Modelling of the HPGR Crusher, SME Comminution Practices Symposium, Ch 17, Denver, 1997.
3 Capital cost estimate reported as the capital cost divided by annual circuit throughput for comparison only.