



The content on this page was automatically generated from the PDF publication document and may contain errors or inaccuracies. Please refer to the original PDF for the most accurate information.
The Effect of Aspect Ratio on the Grinding Efficiency of Open and Closed Circuit AG/SAG Mills
S Morrell 1
ABSTRACT
The aspect ratio (mill diameter/mill length) of autogenous and semi autogenous mills varies widely and can be as high as three or as low as 0.5. The literature on the subject of what effect aspect ratio has on grinding mill performance or energy efficiency is almost non-existent. However, at the design stage of many grinding circuits the subject is often vigorously debated amongst metallurgists. In this paper the performance characteristics of mills with different aspect ratios are examined to determine whether process performance characteristics are a function of aspect ratio and whether high aspect ratio mills are any more or less energy efficient than low aspect ratio units. Data from both pilot and full-scale mills are used for this purpose in open and closed circuit configurations.
INTRODUCTION
Autogenous (AG) and semi-autogenous (SAG) milling most likely had their origins in the first decade of the 20th century with the literature suggesting that simultaneous parallel developments probably took place on two continents. Digre (1969) cites experiments in 1905 that lead Jackson to pioneer pebble milling of gold ores in South Africa whilst Harlowe Hardinge (1955) references work by his father in 1908 in which he experimented with autogenous milling of magnetite in North America. What subsequently sprang from these experiments was not only the rise of AG/SAG milling to its current dominance in circuit design but also the development of two schools of thought concerning aspect ratio. The early developments in South Africa spawned the low aspect ratio evolutionary branch, whilst in North America design took the high aspect ratio route. Interestingly, despite the fact that 100 years have passed since the beginnings of AG/SAG milling, there is almost no relevant literature on the subject of aspect ratio, particularly with reference to throughput capacity, specific energy and energy utilisation efficiency. This is despite the fact that the issue of aspect ratio is one of the most hotly debated subjects during the design stage of many comminution circuit engineering studies. This paper attempts to make sense of what the differences are between high and low aspect ratio mills from a purely capacity /energy efficiency standpoint.
LITERATURE
Arguably the single most important study on the subject of aspect ratio was carried out by Adam and Hirte (1973). The study involved the use of a 5.5 ft diameter pilot mill with a minimum length of 2.2 ft extendable to 4 ft. This effectively enabled tests to be carried out with aspect ratios (D/L) of 2.5 and 1.36 respectively. The mill was operated in closed circuit with a pebble crusher and screen and was used in autogenous mode to grind magnetite. The test results are summarised in Figures 1 and 2, which show plots of kWh/t and P80 against aspect ratio. Tests were run with closing screen sizes of 3 mm and 6 mm and hence the data for each screen are shown separately. Apart from the change in aspect ratio nothing else was altered in the design or operation of the mill. The results clearly show that as aspect ratio decreases the specific energy increases (Figure 1). In terms of capacity this means that the throughput does not increase in
1. Director, SMCC Pty Ltd, 29 Camborne Place, Chapel Hill Qld 4069. Email:
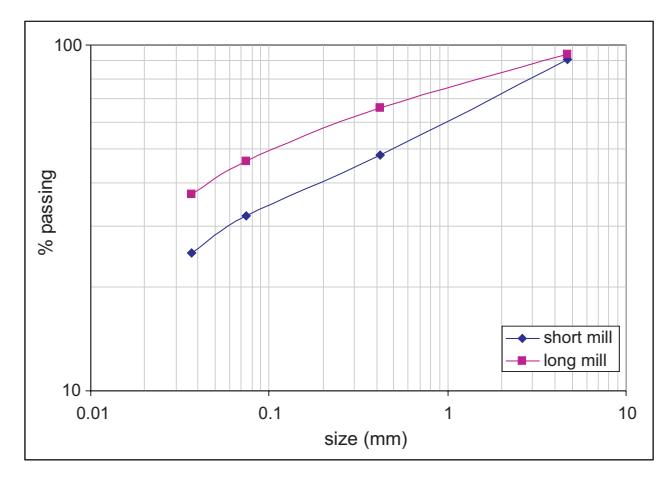
proportion to length, eg if the mill length is doubled throughput does not double – it increases by a much smaller amount. However, as a consequence of the specific energy increasing, the lower aspect ratio provides a finer product as Figure 2 shows. The shapes of the distributions from each aspect ratio do not appear to differ appreciably from one another as Figure 3 indicates.
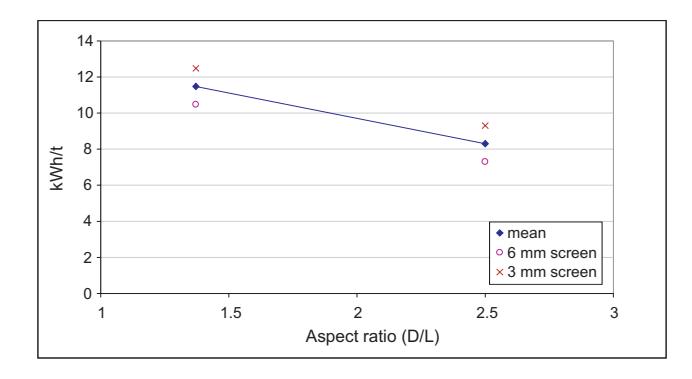
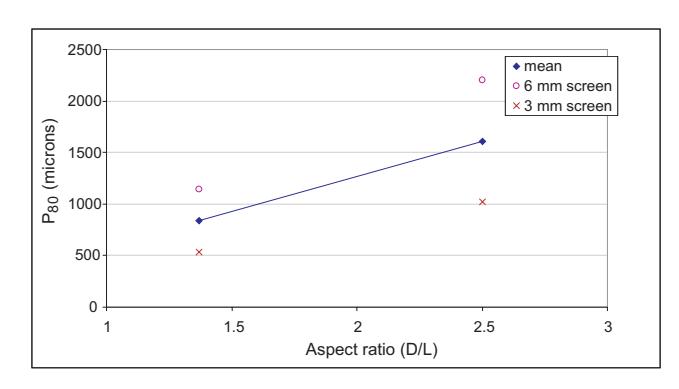
The lower aspect ratio pilot mill therefore appears to trade throughput for grind size. Hence, if full-scale mills behave in a similar manner it can be inferred from these results that for a given ore a high aspect ratio mill will provide a higher throughput at a coarser grind than a low aspect ratio mill operating with the same power draw, per cent ball load, per cent filling, per cent of critical speed, grate configuration and open area fraction. The data further indicate that from an energy utilisation efficiency viewpoint there is no significant difference between aspect ratios, as the operating work indices were the same for both the high and low aspect ratio tests. Adam and Hirte did not look at operating work indices but chose to analyse their data in terms of the fines produced. They reached the same conclusion, giving the following quote in their paper:
... (the) kWh per ton of minus 200 mesh material produced is essentially the same in the long mill as the short mill.
FULL-SCALE MILL DATA
The value of pilot tests such as those described in the previous section is that aspect ratio can be studied whilst keeping all other variables constant, therefore obtaining unequivocal results concerning its influence. In particular, feed ore characteristics are kept constant. With full-scale mills such control is not usually possible and hence comparisons are made difficult by having to use data from different sites with widely different operating conditions on top of differing aspect ratios. The solution to this problem revolves around finding a data reduction process that is able to remove the influences of all relevant variables so that the impact of aspect ratio can be studied in isolation. Such a data reduction technique can be found in Equations 1, 2 and 3. These equations are used by SMCC Pty Ltd to estimate the specific energy of AG/SAG mills under all normal operating conditions, eg ball load, mill speed, feed size and ore hardness and for all normal aspect ratios and mill sizes (Morrell, 2006). The equations are semi-empirical and are based on data from 43 different circuits and 70 different ore types. The range of design/operating parameters covered by these data is shown in Table 1.
| Max | Min | ||
|---|---|---|---|
| sg | 4.63 | 2.5 | |
| \( DW_i \) | kWh/m 3 | 14.2 | 1.7 |
| Bond Wi | kWh/t | 26 | 9.05 |
| F 80 | microns | 176 000 | 19 400 |
| P 80 | microns | 427 | 20 |
| Diameter | m | 12.02 | 3.94 |
| Length | m | 9.5 | 1.65 |
| Ball load | % | 25 | 0 |
| Speed | % | 90 | 58 |
| Aspect ratio (D/L) | 3.0 | 0.5 |
$$ S = K.F_{80}^{a}.DW_{i}^{b}.(1 + c(1 - e^{-dJ}))^{-1}.\phi^{e}.f(A_{r}) $$ (1)
where:
S = specific energy at the pinion
\( F_{80} \) = 80 per cent passing size of the feed
\( T_{80} \) = 80 per cent passing size of AG/SAG mill circuit
\( DW_i = drop\text{-weight index} \)
= volume of balls (per cent)
φ = mill speed (per cent of critical)
\( f(A_r) \) = function of mill aspect ratio
a,b,c,d,e,f,g = constants
K = function whose value is dependent upon whether a pebble crusher is in circuit
where:
W = specific energy (kWh/t)
K = constant chosen to balance the units of the equation
\( M_i \) = index related to the breakage property of an ore (kWh/t)
\( x_2 = 80 \) per cent passing size for the product
\( x_1 = 80 \) per cent passing size for the feed
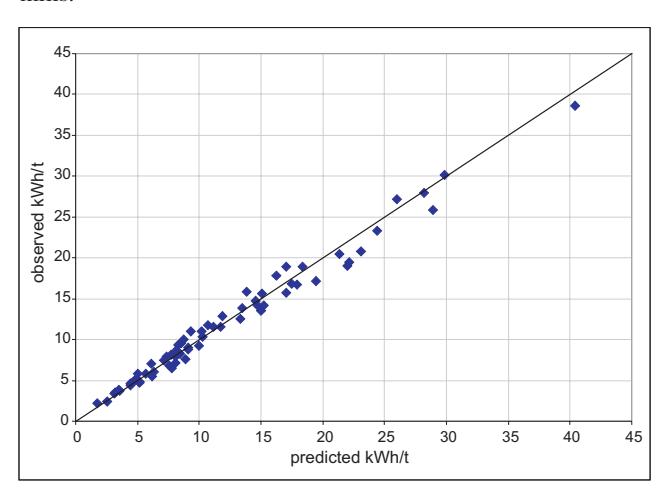
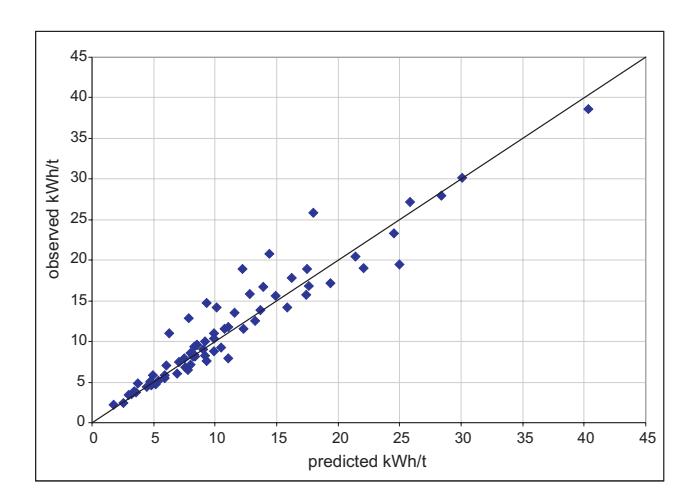
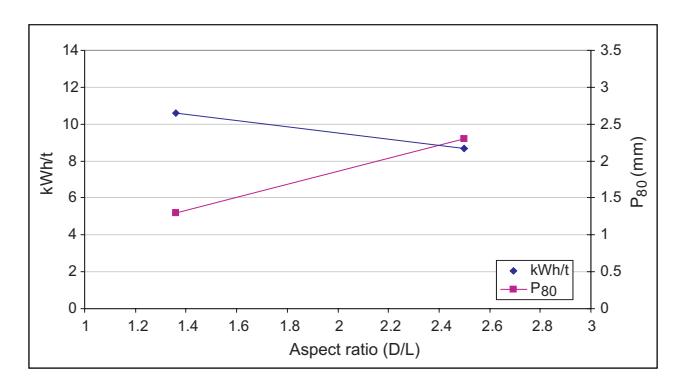
The predicted specific energies shown in Figure 4 were calculated using Equations 1 - 3, in which there is a function related to aspect ratio, though there are no parameters which represent different energy efficiencies for particular mill designs or operating conditions, ie it is assumed that the energy efficiency is the same for all mills/circuits. The correlation is very good, error analysis showing that there are no underlying biases. In contrast to this result Figure 5 shows the correlation using a similar equation to Equation 1 but with no allowance for aspect ratio. The results are very different; the scatter being quite pronounced in places, illustrating that aspect ratio has a significant influence with respect to the specific energies of the mills in the database. The typical response of this relationship is shown in Figure 5 and can be seen to work in a similar manner to the way that the Adam and Hirte data indicate occurs in pilot mills.
The data in Figure 5 also indicate that without an aspect ratio relationship the equation still works well in some cases. This is due to two reasons. The first is that the majority of mills in the database have an aspect ratio of about two – a reflection of how popular this mill design is. As so many mills in the database have the same aspect ratio, an equation with no allowance for variation in aspect is obviously likely to work equally well in these cases as an equation that does have an aspect ratio term.
The second reason is that some of the mills in the database are single stage. The aspect ratio relationship is only relevant to open circuit mills where throughput and grind size vary in association with one another. In single stage mills grind size is independent of aspect ratio as it is controlled by the action of the classifier. Specific energy is also controlled in one sense by the classifier, in that the P80 it produces dictates the energy requirement, in conjunction with the throughput. Looked at another way, in a single stage high aspect ratio mill its initial tendency (ie when feed is first introduced into the mill circuit) will be for it to give a higher throughput and coarser discharge. However, due to the action of the classifier the coarser part of the discharge will be returned to the mill causing the throughput to be reduced slightly to accommodate the recycle load. Eventually the throughput will stabilise once these actions come to equilibrium. If the mill were low aspect ratio the initial tendency would be for a lower throughput but finer discharge. This time the classifier would cause less material to be recycled back to the mill and hence corrective action in reducing the new feed would be less than in the high aspect situation. Equilibrium would eventually be reached at exactly the same throughput and power draw, providing the final grind was the same as that obtained in the high aspect ratio case. However, in the low aspect ratio case it can be expected that the recycle load would be lower. Overall energy efficiency would be the same, as the Adam and Hirte data indicate should be the case. The only situation where this similarity in overall performance may not occur is where a very low aspect ratio mill was chosen in single stage mode to grind to a relatively coarse grind. It is possible that by the time the feed were discharged from the mill it would have been overground to the point where the relatively coarse target P80 could not be achieved by the classifier (it would only be able to obtain a \( P_{80} \) finer than the target). The overall energy efficiency would be no different; the mill would simply be unable to obtain its desired target grind and have a higher specific energy than the high aspect ratio alternative.
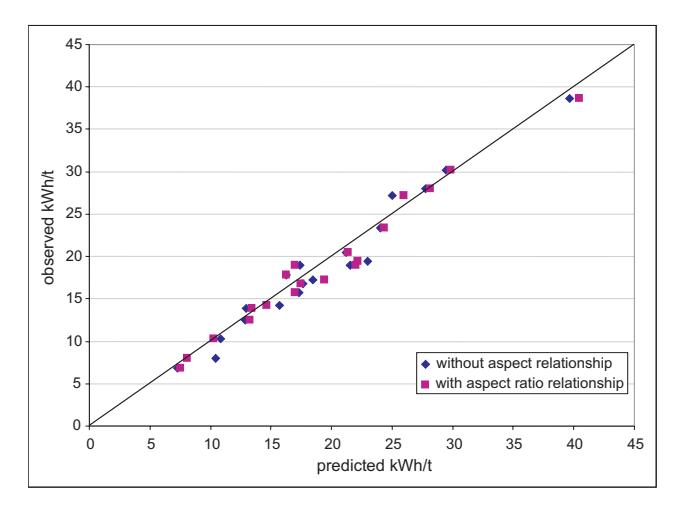
To illustrate the single stage situation further, the single stage mill data were separated from the other data in the database. A wide range of aspect ratios are included in this data set (from 0.5 - 2). Equations 1 - 3 were then used both with and without an aspect ratio relationship to predict the specific energies of each of the mills. These were then compared to the observed values (Figure 7). As can be seen there is no significant difference between the two approaches, further supporting the assertion that the energy efficiency is not a function of aspect ratio
PILOT DATA
Although the Adam and Hirte (1973) test work used a variable length pilot mill, such installations are very rare and in most cases a standard 6 ft \( \times \) 2 ft (D \( \times \) L) mill is used for pilot studies. Due to our much improved understanding of how AG/SAG mills work and in particular how to characterise feed ore, pilot test programs are not as common as they used to be and hence data are becoming increasingly scarce. However, over the last six years the author has collected data from nine pilot studies where subsequently a full-scale plant has been built. Data were then collected from these plants and compared with the pilot data. In the context of this paper, the value of doing so is that the pilot tests were carried out using 6 ft \( \times \) 2 ft mills which have an aspect ratio of three. Most full-scale mills tend to have aspect ratios of two or lower and hence it is possible that in comparing the pilot and full-scale data aspect ratio effects may become apparent.
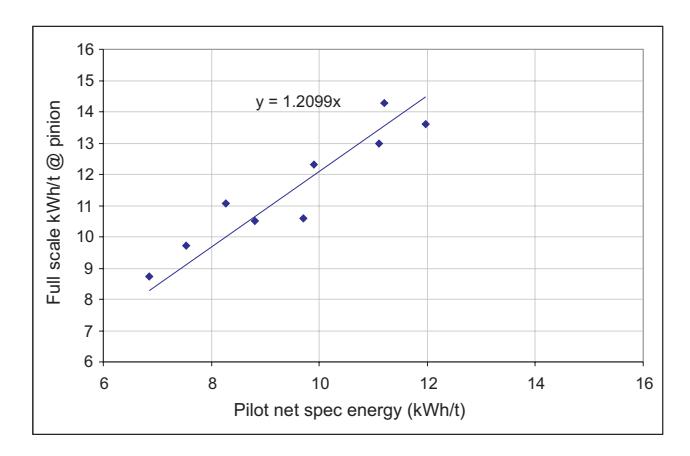
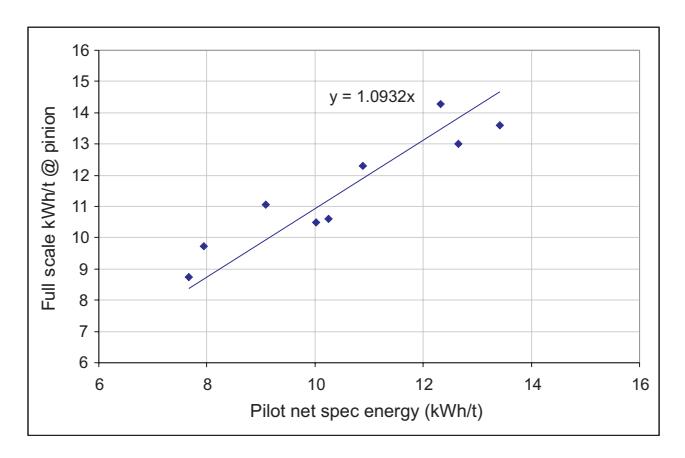
As a first approach the raw pilot net kWh/t was plotted against the raw full-scale kWh/t at the pinion (Figure 8). To arrive at this latter figure power at the pinion was assumed to be 93.5 per cent of the motor input power. The data indicate a definite correlation though with the full-scale values being on average 21 per cent larger than the pilot ones. Scatter in the data is also apparent and is attributed to the following causes:
the full-scale plant data did not always reflect exactly the same ore as treated during the pilot study, though as far as possible full-scale plant data were collected during periods where the ore was as similar as possible;
- conditions such as screen/trommel apertures, mill speed and ball load were not always identical; and
- feed sizes differed.
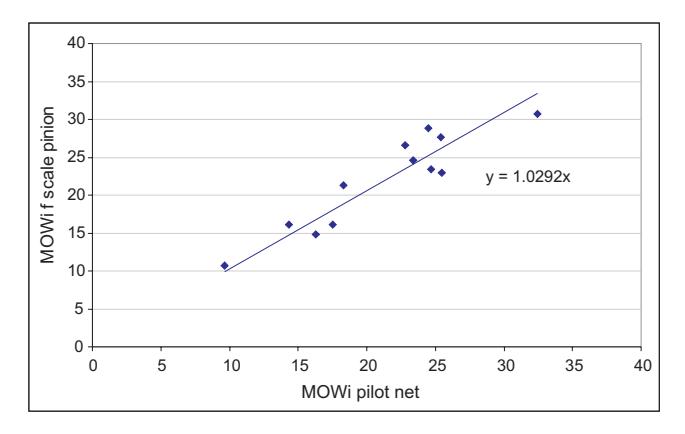
The pilot data were then modified using the same aspect ratio adjustment that is contained in Equation 1. The resultant plot is shown in Figure 9 and indicates that the offset between the pilot and full-scale results has reduced considerably to nine per cent. It should be remembered that the pilot data relate to net conditions and hence reflect the power used to grind the ore only, ie it is the motor input power less motor, gearbox, drive train and bearing losses. In contrast, the full-scale data relate to the estimated power at the pinion drive and hence include the losses at the pinion and due to bearing friction. These losses could conceivably account for two to three per cent of total power, leaving six to seven per cent as the true difference between the pilot (corrected for aspect ratio) and full-scale specific energies. Given that pilot tests are conducted under near-perfect conditions with respect to control and feed consistency and the full-scale data include the usual effects of variability, the six to seven per cent difference is quite plausibly attributable to the influence of control. This is not to say that the differences reflect higher energy efficiency in the pilot mill, only that the kWh/t is lower and hence the throughput is proportionately higher than at full scale. The expectation is that the full-scale mill would have a higher kWh/t than the pilot mill but would produce a slightly finer grind. This is supported by the data in Figure 10, which shows the operating work indices (as described by Morrell, 2006) of the pilot and full-scale mills. As can be seen the full-scale operating work indices are about three per cent higher than the pilot ones. This difference is in line with earlier estimates of the difference between the full-scale power at pinion and the pilot net values, ie the difference is attributable to the differences in what the power measurements in the pilot and full-scale mills relate to. The implication of this conclusion are significant in that it suggests that it is not appropriate when designing a full-scale mill using pilot data to assume that the full-scale mill will have the same specific energy as the pilot unit, or that it will be a simple multiple of it regardless of the dimensions of the fullscale mill. In particular, if a low aspect ratio mill is to be used and the pilot tests were carried out in the usual high aspect ratio 6 ft × 2 ft mill the pilot specific energy may need to be inflated by a considerable amount to account for the affects of geometry.
CONCLUSIONS
According to controlled pilot tests by Adam and Hirte (1973), as mill length increases and aspect ratio therefore decreases the specific energy of AG/SAG mills increases, all else being equal. At the same time the product size becomes finer. The overall energy efficiency, however, remains constant.
Analysis of a large database of industrial mills indicates that these phenomena are also apparent with open circuit mills at full scale. Hence a low aspect ratio mill operating with the same power and operating conditions as a high aspect ratio machine will have a lower throughput and produce a finer grind, consistent with a similar energy utilisation efficient.
In single stage closed circuit operation, high and low aspect ratio mills can be expected to have the same energy efficiency and, providing they are operated under similar conditions of power draw, ball load, speed, etc and grind to the same P80, will have similar throughputs and specific energies. Recycle loads in the high aspect ratio mill circuit are likely to be marginally higher.
Comparisons between pilot data using 6 ft × 2 ft mills and full-scale mills with lower aspect ratios treating similar ores also show signs of aspect ratio effects. These are apparent from the differences between the specific energies of the pilot and full-scale mills. By applying an aspect ratio adjustment to the pilot data the resultant specific energies are similar to those observed in associated full-scale mill circuits.
REFERENCES
Adam, H W and Hirte, D F, 1973. Autogenous grinding, the long and the short of it, AIME Annual Meeting, Chicago, Illinois, SME of AIME.
Digre, M, 1969. Autogenous grinding in relation to abrasion conditions and mineralogical factors, in Proceedings Auto Grinding Seminar , Trondheim, A1.
Hardinge, H, 1955. Making rock grind itself, Eng and Min J , 156:84-90.
Morrell, S, 2006. Design of AG/SAG mill circuits using the SMC test, in Proceedings International Conference Autogenous and Semi Autogenous Grinding Technology, Vancouver, UBC.