



The content on this page was automatically generated from the PDF publication document and may contain errors or inaccuracies. Please refer to the original PDF for the most accurate information.
THE INFLUENCE OF FEED SIZE ON AUTOGENOUS AND SEMI-AUTOGENOUS GRINDING AND THE ROLE OF BLASTING IN ITS MANIPULATION
S.Morrell
ABSTRACT
The introduction and subsequent ascendancy of autogenous and semi-autogenous milling for comminution circuits has undoubtedly lead to many economic advantages. From a process viewpoint, however, at least one downside has been the sensitivity of these machines to process input variations. Foremost among these is ore competence, though feed size comes a close second. This sensitivity is due to the reliance of ag/sag mills on the feed ore for their grinding media competence and size. Autogenous (ag) mills are the most sensitive in this respect with semi-autogenous (sag) mills being increasingly less so as the ball charge is increased. Increasingly designers and operators are recognising the importance of feed size and the benefits of manipulating it to improve performance. This has been achieved by installing additional crushing/screening capacity ahead of the ag/sag, better operation of the primary crusher, better control of segregation cased by stockpiles and bins and by changing blast design/practices to modify the ROM size distribution. This paper describes the influence of feed size distribution on ag/sag mill performance with reference to a range of plant data. It particularly concentrates on how changing blasting practice to modify ag/sag feed size can have a considerable overall benefit.
Keywords: Blasting, Feedsize, Milling, Semi-autogenous
INTRODUCTION
Although the introduction of autogenous and semi-autogenous milling for comminution circuits has lead to a number of economic advantages, from a process viewpoint at least one downside has been their sensitivity to process input variations. This sensitivity is due to the reliance of ag/sag mills on the feed ore for their grinding media competence and size. AG mills are the most sensitive in this respect with SAG mills being increasingly less so as the ball charge is increased. This contrasts with ball mills whose grinding media are generally constant with respect to competence and size distribution and whose size reduction performance is relatively independent of feed size distribution.
Although often considered to be a curse by some, the performance dependence of ag/sag mills on feed size can be turned to advantage through its manipulation. This can be effected by changing the operation of the primary crusher, by installing additional crushing capacity in the form of secondary crushers or modifying the Run-of-Mine (RoM) size distribution through changes in blasting practice.
RELATIONSHIP BETWEEN FEED SIZE AND PERFORMANCE
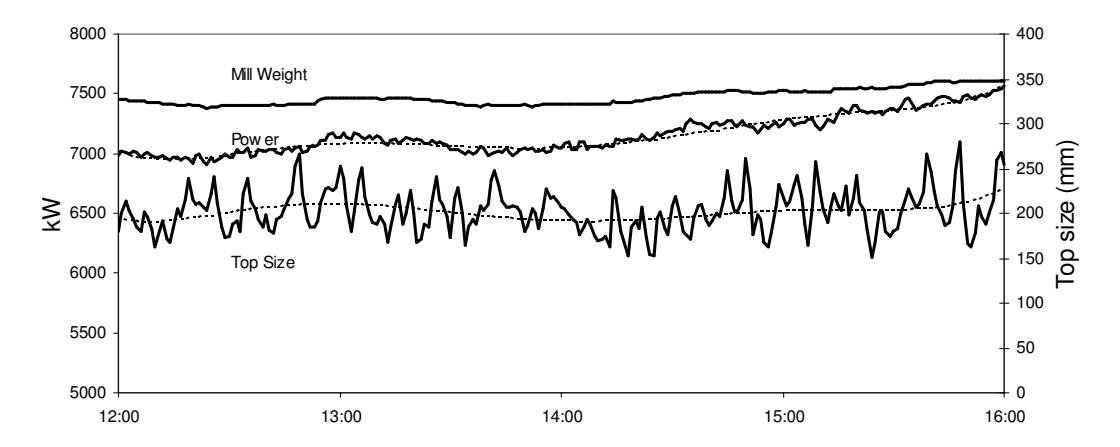
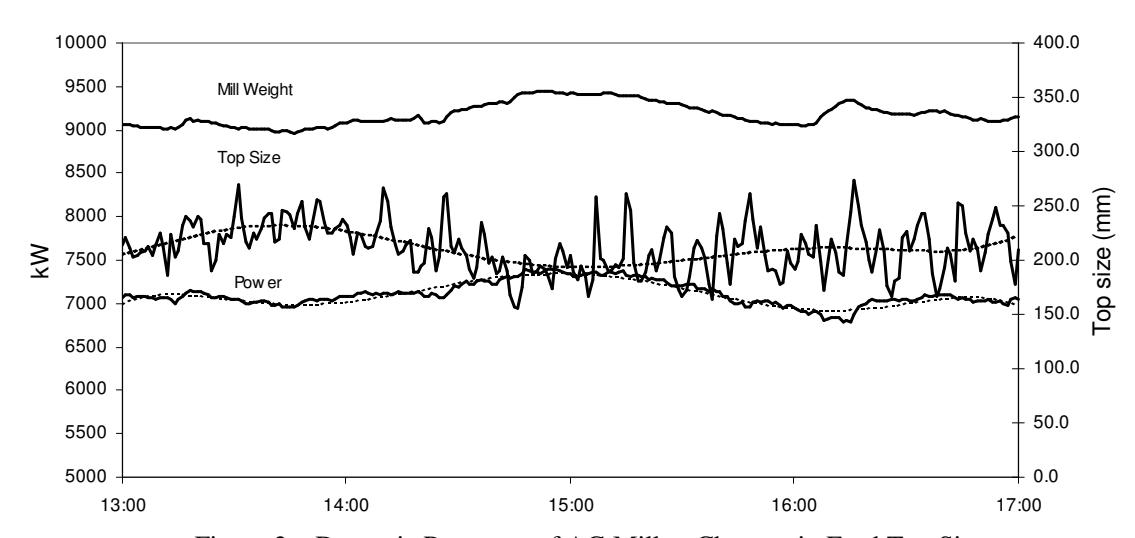
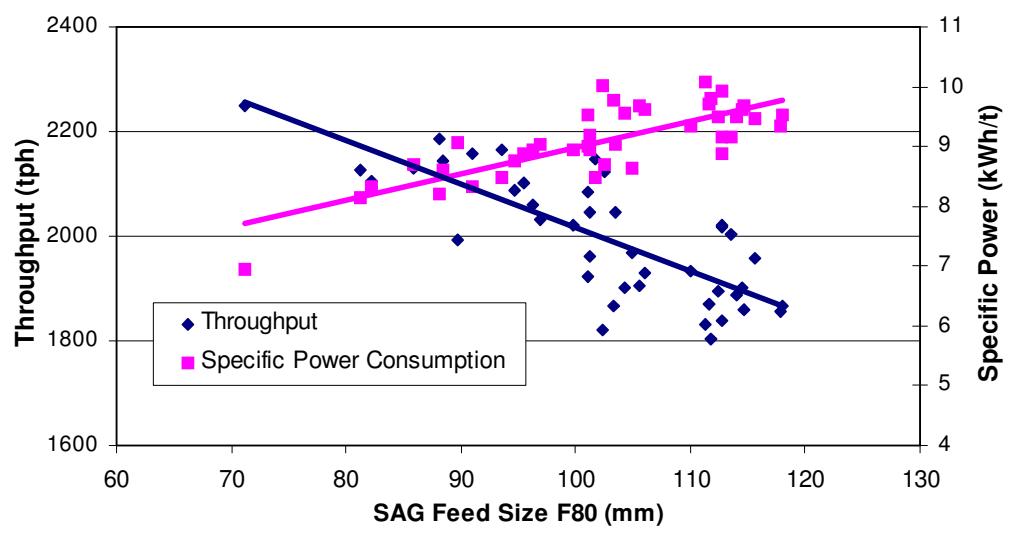
The influence of feed size on AG/SAG mill performance is well documented, though there is no universal rule that quantitatively describes this relationship. However, the often-used rule of thumb is that for SAG mills a decrease in feed size will be advantageous whilst for AG mills the opposite is true. This is illustrated in Figures 1 and 2, which show dynamic trends from the same mill operating in AG and SAG modes. In the SAG mill case the data show that as top size increases the mill weight increases as the mill finds it increasingly difficult to break down the bigger rocks. Power responds to the increased mill weight by also increasing. With a constant mill weight/power draw control strategy this would result in a decrease in throughput. A very different picture is seen from the AG mill data. In this case, over the range of feed top sizes covered, it was found that as top size increased the mill weight decreased ie the mill found the feed size distribution represented by this condition easier to grind. Response of the power draw was to fall, providing the opportunity to increase feed rate. The SAG mill response is further supported by the data shown in Figure 3, which plots measurements of throughput, power, and F80 taken over several months for a very large diameter mill.
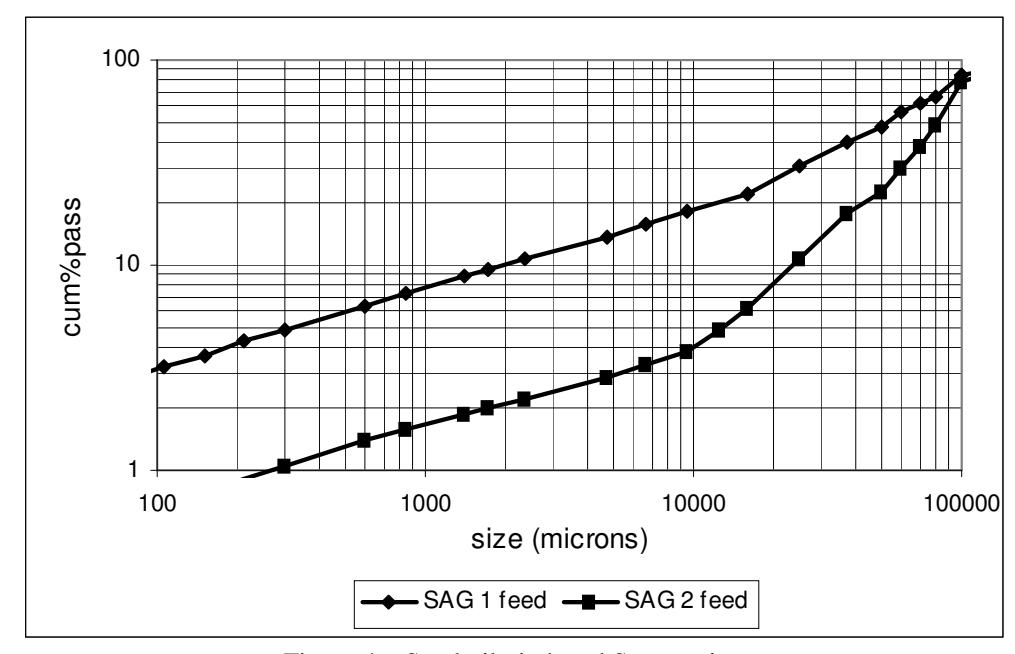
As with many rules of thumb the one described earlier is a gross generality and cases are often seen where this relationship does not appear to hold. This is partly due to the use of single-point descriptors such as the 80% passing point to describe size distributions. In practice it is found that many different distributions may exist for the same 80% passing value. This is clearly illustrated in Figure 4, which shows the different distributions that were obtained from the same stockpile. The differences were caused in this case by segregation.
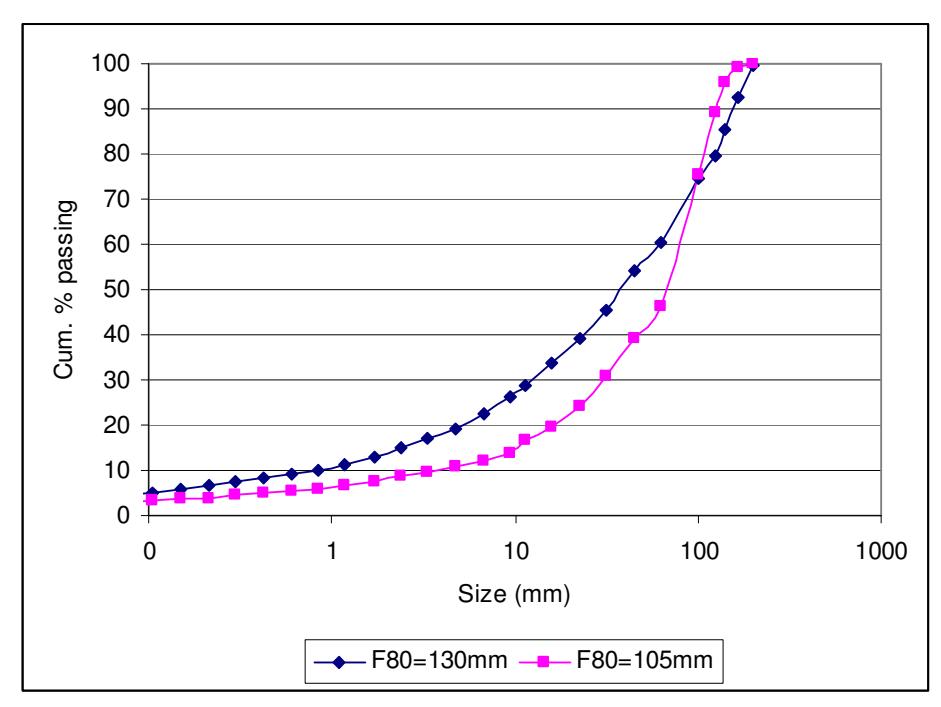
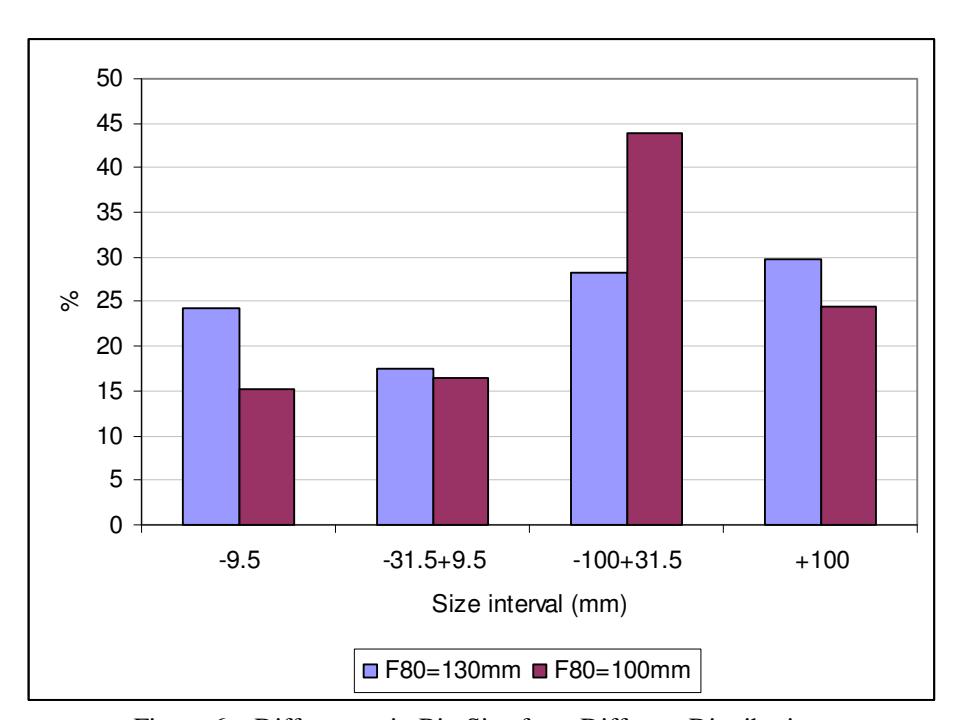
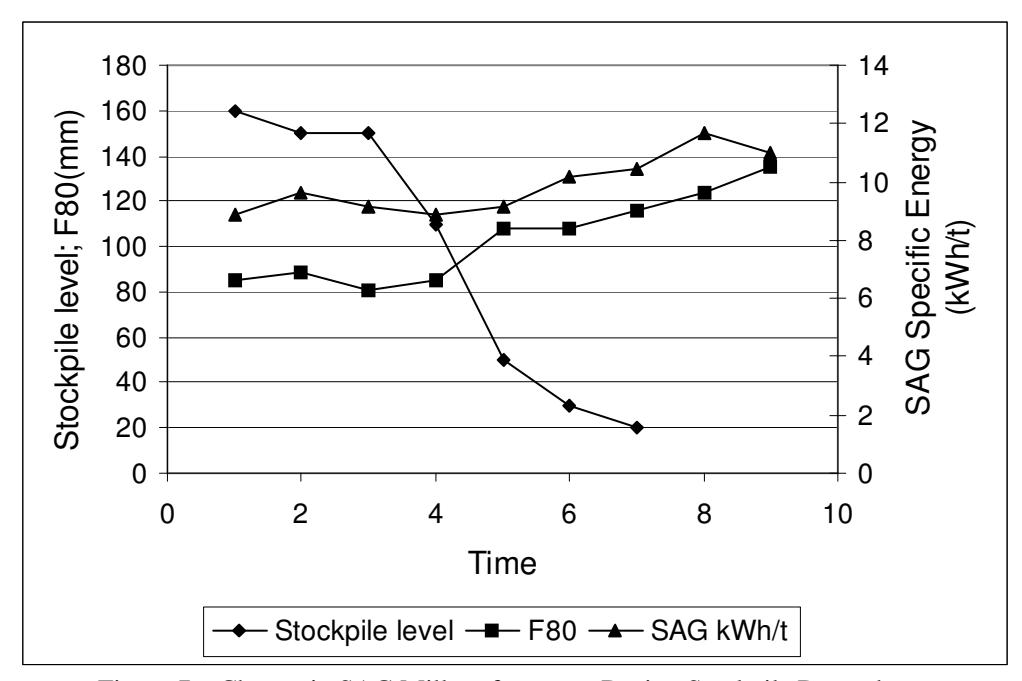
Such differences in AG/SAG mill feed distributions may cause large swings in performance. This was the situation with the SAG feed size distributions shown in Figure 5. In this case the one with the lower F80 was found to cause the SAG mill throughput to drop significantly whilst the higher F80 distribution performed much better. The distributions are seen to be of different shapes. This is illustrated more clearly in Figure 6, where the distributions are divided into four size classes. It is now apparent that the lower F80 distribution has significantly more intermediate-sized material (-100+31.5mm) and much less finer material (-9.5mm) than the higher F80 distribution. It is generally found that lower throughputs are obtained for both AG and SAG mills when the intermediate size class is increased and the fines class is decreased. These trends are often seen during drawdown of stockpiles (Figure 7) resulting in quite considerable drops in throughput (Morrell and Valery, 2001).
BLASTING
Blasting is the first step in the comminution process, though for many years it was regarded purely as a means for extracting ore from the ground and enabling it to be transported to the processing plant. Its distribution was not therefore considered in the context of its influence on the crushing and grinding circuits. The so-called "Mine to Mill" approach has changed this attitude at a number of operations though in others the old view unfortunately still prevails.
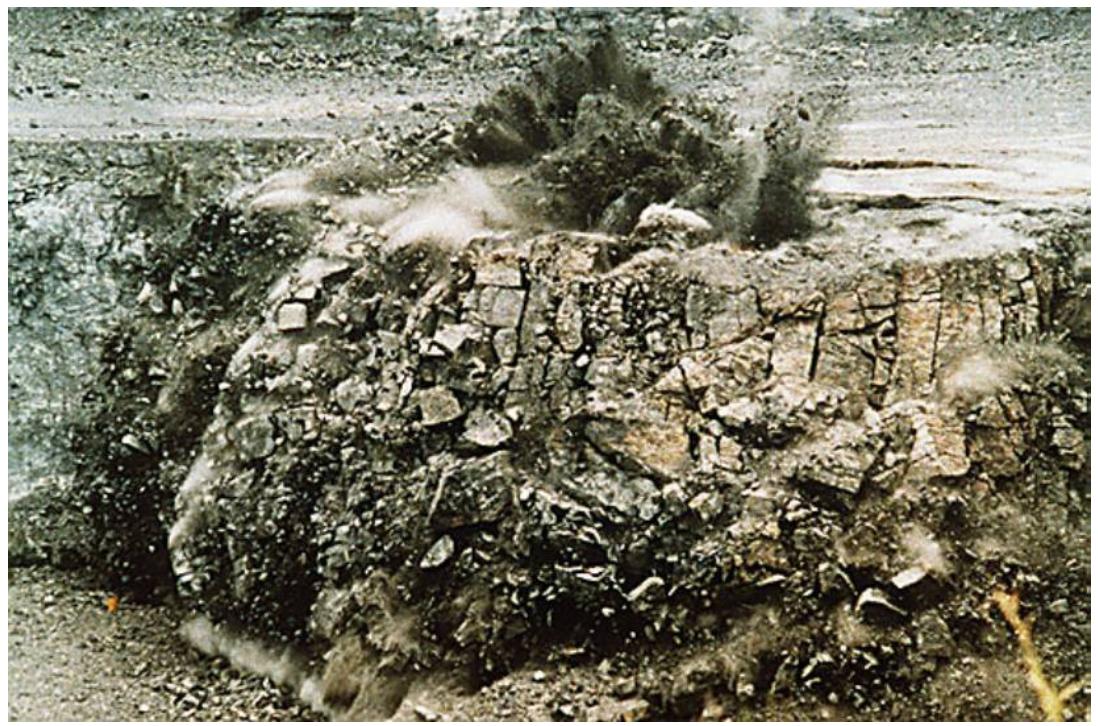
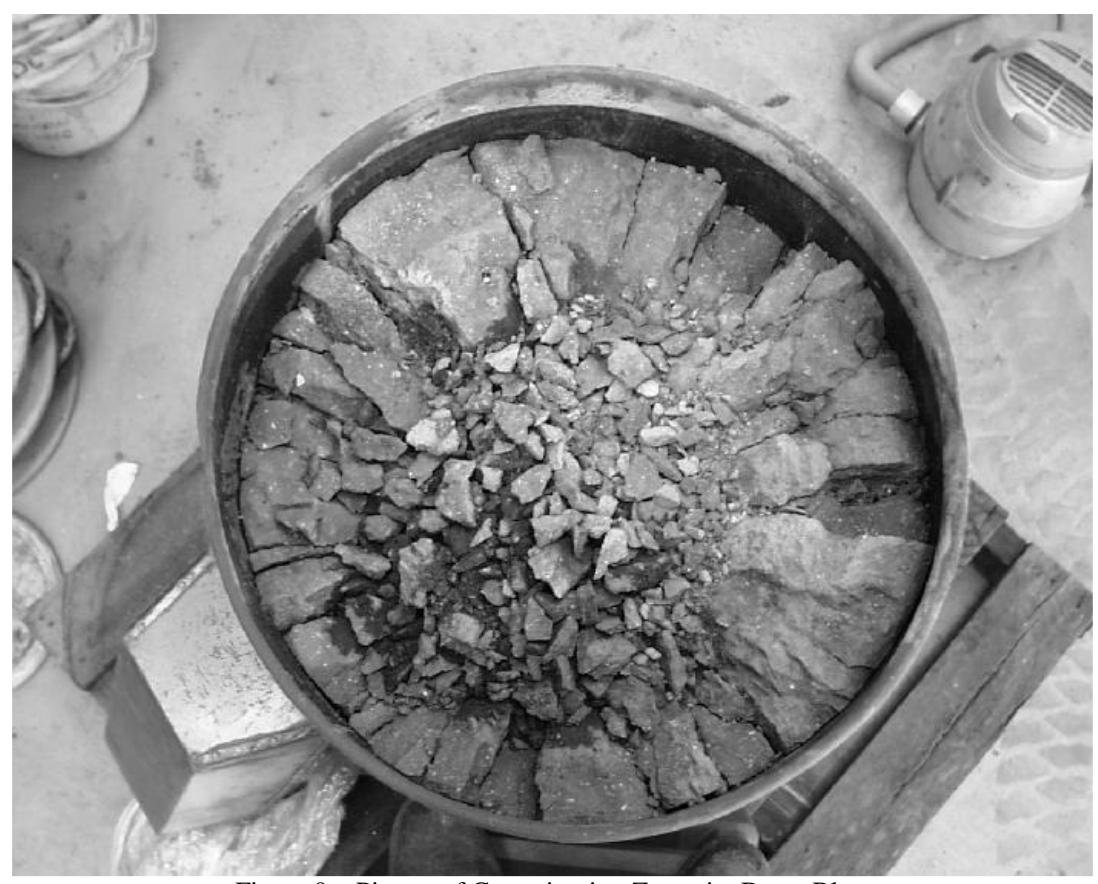
The RoM distribution that blasting generates is principally the product of two processes. viz the liberation of in-situ blocks and the intense breakage of material near to the explosive column. Figure 8 illustrates this well. The in-situ blocks can be seen at the top of the bench face, being freed from the rock mass as it parts along natural planes of weakness. This action results in the formation of the coarse part of the RoM distribution and is therefore strongly influenced by the in-situ structure of the deposit. Further into the bench, where the explosive column is situated, fine material can be seen being ejected into the air. This material is therefore the main contributor to the finer end of the distribution. Further pictorial evidence of these two zones is given in Figure 9 where the result of a single-hole drum blast is shown. Near to the centre of the drum where the explosive was situated, the rock has been blasted into relatively fine pieces. Away from the explosive the broken pieces are relatively large.
CHANGING BLAST DESIGN
It is clear from data such as that shown in Figure 6 that distributions favoured from an AG/SAG milling viewpoint have a large amount of sub-grate material (which passes through the mill rapidly), coupled with reduced levels of intermediate-sized material, which they find difficult to break. As all ex-primary crusher AG/SAG mill feed size distributions are the result of how in-situ rock has been blasted and subsequently treated by the primary crusher, it is reasonable to expect that by changing how blasting is carried out and how the primary crusher is operated, significant changes can be made to the distribution. This is the philosophy adopted in the "Mine to Mill" approach which has been successfully implemented at sites such as Highland Valley Copper, Porgera, Mt. Keith and KCGM.
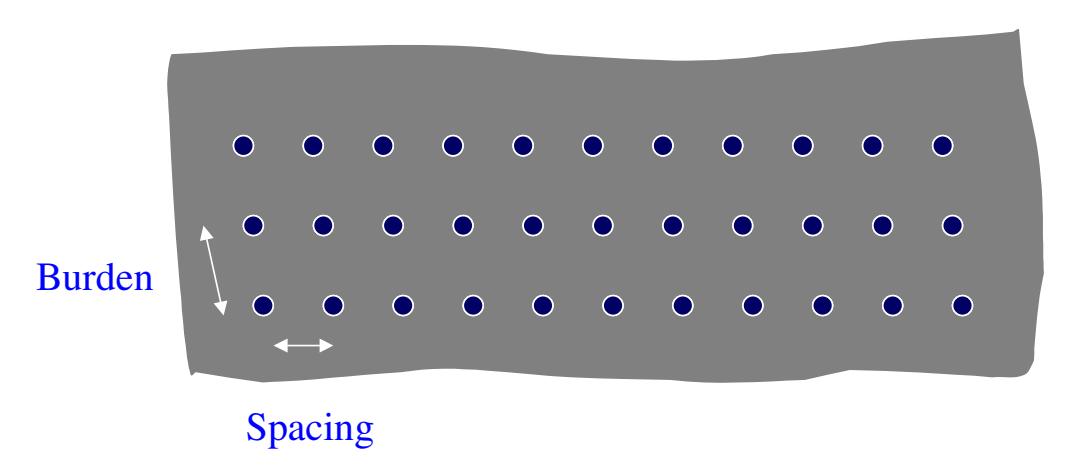
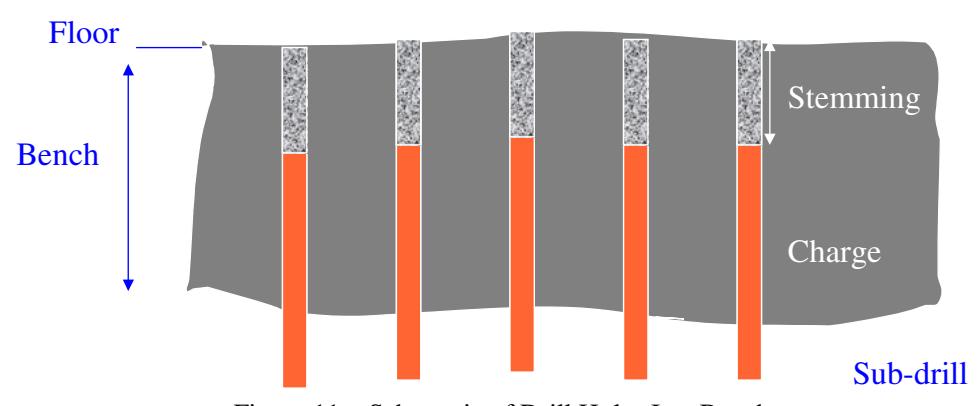
Broadly speaking the approach entails increasing powder factor, often accompanied by changes to blast pattern ie changing the burden and spacing (Figure 10) as well changing the stemming, charge and sub-drill length and drill hole diameter (Figure 11), to produce a ROM which has a reduced (or better controlled) top size and more fine material (particularly sub-grate) (Scott et al, 1999). This may be coupled with reducing primary crusher gap (and sometimes liner profile) as the finer ROM enables this change to be made without compromising crusher throughput. Where possible the primary crusher is also choke fed as this produces additional fines in the mill feed (Simkus and Dance, 1998).
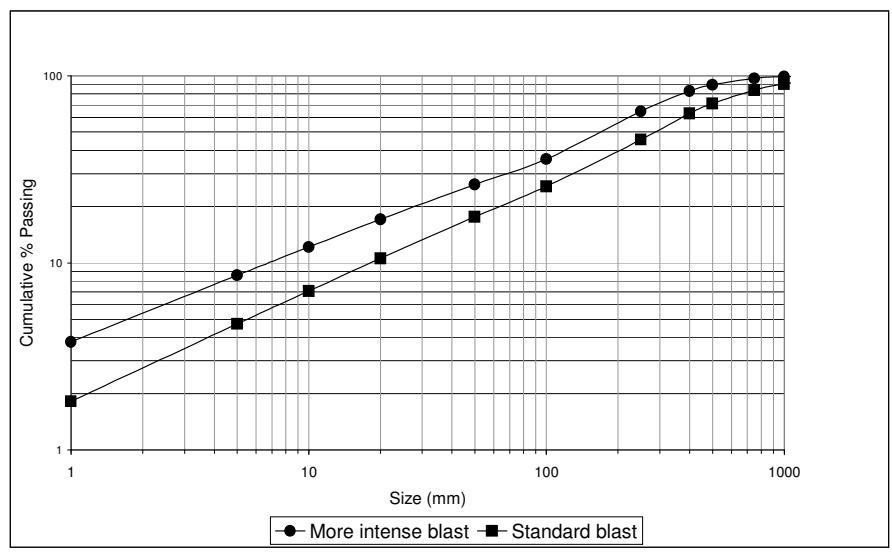
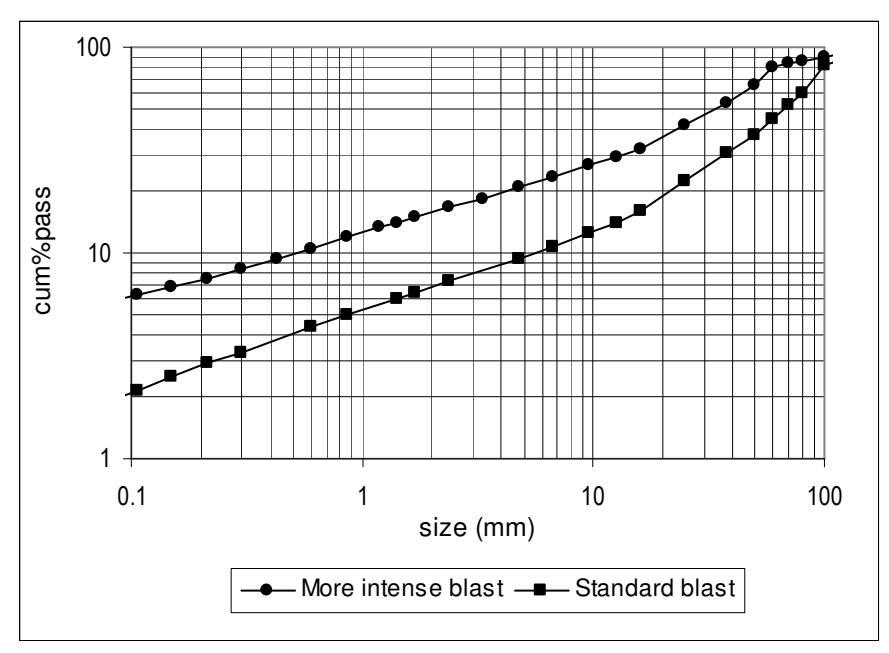
To illustrate what can be achieved, Figure 12 shows the RoM size distribution from a more intense blast compared with a normal one. After passing through the primary crusher the size distributions shown in Figure 13 were obtained. These were fed to the SAG mill, which was running with 12% balls. The finer distribution resulted in the mill throughput increasing by 20%.
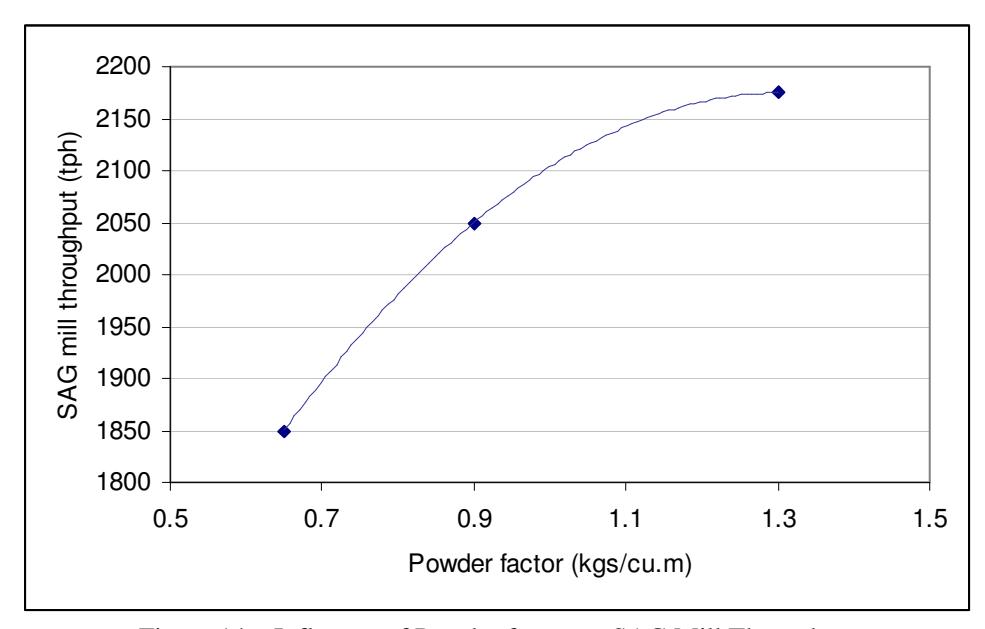
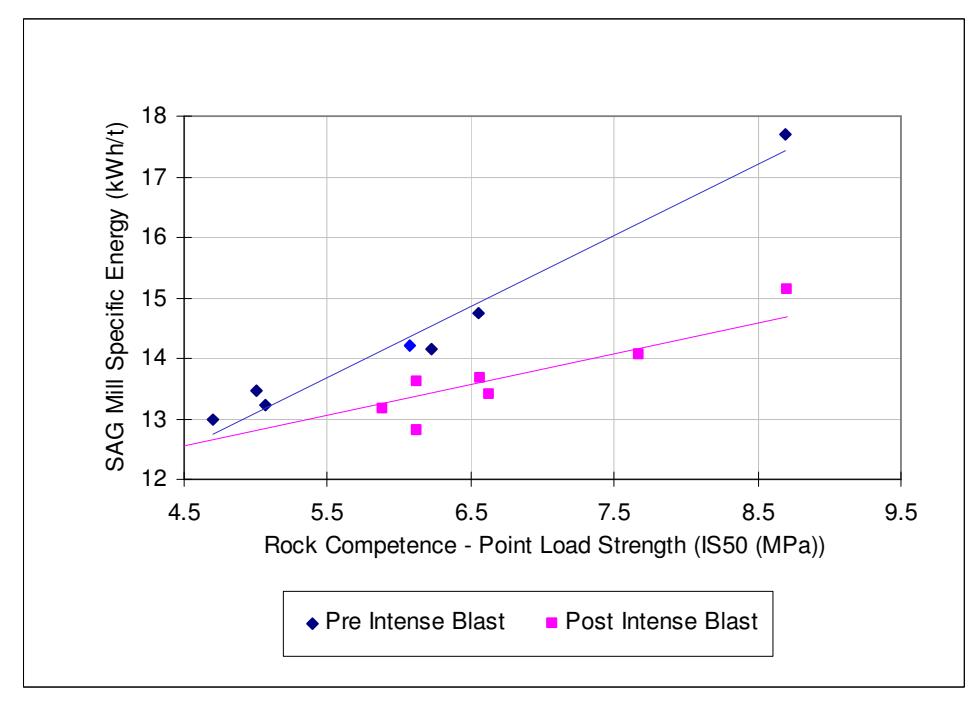
Generally speaking the single biggest driver in generating a more favourable feed size distribution is the powder factor. However, the relationship appears not to be linear as illustrated in Figure 14, which shows that the initial rate of throughput increase is not supported at more elevated powder factors. These data indicate that from a throughput viewpoint there is limiting powder factor, which itself may be different to that determined from an overall profitability viewpoint. It is this latter point that is of most importance and is determined by the balance between the higher cost of explosives, drilling etc and the additional revenue from increased throughput (assuming that this is translated into the recovery of additional final product). Interestingly in many cases the cost of additional explosives, drilling etc is more than offset by improved load and haul productivity in the mine ie it is cost neutral, leading to very favourable economics. However, implementation and maintenance of a successful Mine-to-Mill strategy has not always been found easy, largely due to non-technical problems. However, when conducted properly consistent improvements in performance can be obtained as shown in Figure 15. These data were generated over an 18-month period covering a pre- and post Mine-to-Mill audit. The data points each relate to ore campaigns, each campaigned being of a particular hardness as indicated by its point load strength. The SAG mill specific energy was found to have decreased significantly during the post Mine-to-Mill period for the same ore hardness indicating that the finer distribution that was fed to the SAG mill was treated with the use of less energy.
CONCLUSIONS
Whereas the sensitivity of AG/SAG mills to feed size changes may often cause problems, this phenomenon can be turned to good use by manipulating feed size through blasting. This has been found to result in significant increases in throughput and improvements in profitability.
REFERENCES
Morrell, S and Valery, W. 2001 "Influence of Feed Size on AG/SAG Mill Performance". SAG 2001, Vancouver, Canada, pp203-214
Scott, A., Kanchibotla, S.A., and Morrell, S. 1999. "Blasting for mine to mill optimization". Explo '99, Kalgoorlie, WA, pp3-8.
Simkus, R and Dance, A. (1998 "Tracking Hardness and Size: Measuring and Monitoring ROM Ore Properties at Highland Valley Copper", AusIMM Mine to Mill Conference, Brisbane,Australia, pp113-120.