



The content on this page was automatically generated from the PDF publication document and may contain errors or inaccuracies. Please refer to the original PDF for the most accurate information.
The Liberation Performance of a Grinding Circuit Treating Gold Bearing Ore
S Morrell1, R Dunne1 and W Finch1
ABSTRACT
Understanding how liberated and unliberated minerals behave in comminution and classification circuits is of vital importance to ensure that maximum liberation occurs without unnecessary and costly overgrinding. This paper presents the results of a study carried out by the Julius Kruttschnitt Mineral Research Centre and Newcrest Mining of the liberation performance of Newcrest Mining's New Celebration grinding circuit. Using data from surveys of the circuit, together with QEM*SEM analyses of individual streams, a detailed picture of the liberation and classification of gold-associated pyrite is presented. In addition the relationship between the QEM*SEM analyses and results from laboratory leach tests are also discussed.
Using the survey and QEM*SEM data, mathematical models were constructed of the performance of the ball mill and cyclones, and simulations carried out to investigate ways of improving the performance of the circuit. The results from the more promising scenarios are reviewed.
INTRODUCTION
Although the size distribution of a grinding circuit product and the size reduction performance of the circuit are indications of how well that circuit is providing a suitable feed for subsequent extraction processes, the key to improving its performance in an efficient manner is understanding how the valuable minerals are being liberated. To this end the Julius Kruttschnitt Mineral Research Centre (JKMRC) and Newcrest Mining undertook a study of Newcrest Mining's New Celebration grinding circuit. Plant surveys together with QEM*SEM analysis, assaying and laboratory leach analyses were carried out to provide data which could be used to describe in detail the performance of the circuit. In addition the data were used to generate mathematical models which were used to conduct simulations of the effect of circuit changes.
PLANT DESCRIPTION
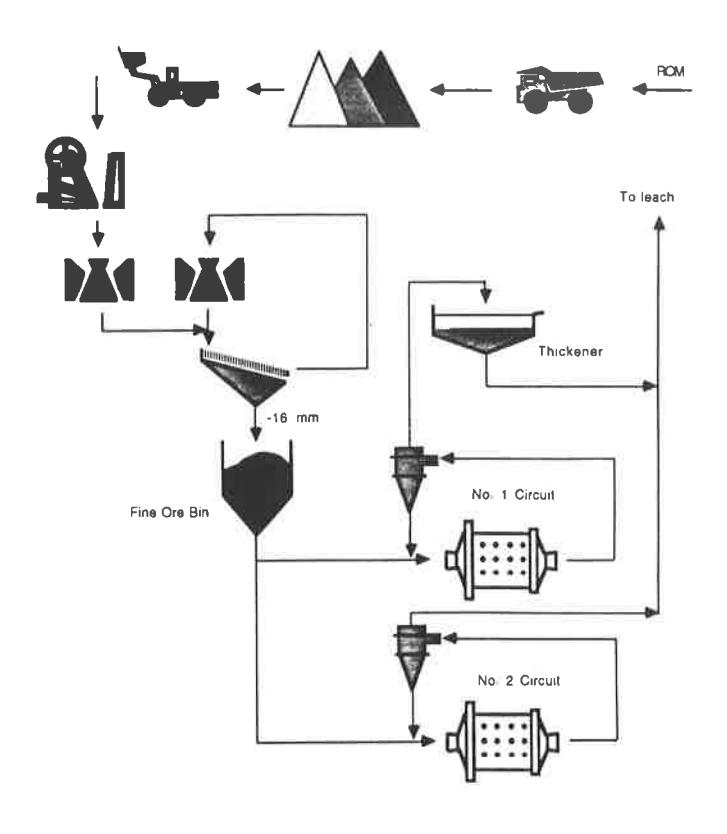
A flowsheet of the comminution circuit is shown in Figure 1. It comprises three stages of crushing followed by a parallel circuit of two closed circuit ball mills. The ball mills and cyclones of each milling circuit are of different dimensions and treat different throughputs. Nominal throughput of the No 1 circuit at the time of the survey program was 80 tph while that for circuit No 2 was 115 tph. Details of the mills and cyclones are shown below: Further details can be found in Delaney et al (1992)
No 1 Circuit
| Ball Mill: length (m) diameter (m) ball load ball size (mm) speed (% of critical) |
No 1 Circuit
4.88 3.54 0.42 77 - 80 |
No 2 Circuit
5.49 4.12 0.42 77 - 80 |
|---|---|---|
| Cyclones number in use diameter (m) |
3
0.381 |
7
0.254 |
1. JKMRC, Isles Road, Indooroopilly 4068.
GEOLOGY AND MINERALOGY
Ore for the treatment plant is derived from a number of sources (Norris, 1990). Blending of ores is important ensuring optimum milling throughput (mixing of oxidised and hard fresh ores) and also to provide the required pulp viscosity of the suspension flowing through the leach and adsorption tanks (Delaney et al, 1992). During the survey period the sulphide ore, which accounted for 80 per cent of the blend, was from the Hampton Boulder deposit.
Gold mineralisation in the Hampton Boulder is associated within a mafic ultramafic schist sequence. Gold is found in quartz-sericite-pyrite veinlet sets and at the surface of disseminated pyrite.
A mineralogical examination of a sulphide laboratory flotation concentrate from the central zone of the deposit (Vaughan, 1990) showed most of the pyrite to be less than 80 \( \mu m \) in size. A number of larger grains of pyrite were also present. Gold was contained as both free grains are included in or attached to pyrite. Of the total grains counted 75 per cent were free. The free gold grains appear to be larger, up to 170 \( \mu m \) but mostly in the 40 \( \mu m \) range, while the maximum gold grain size included in or associated with pyrite was 20 \( \mu m \) .
SURVEY DATA
A total of six surveys of the plant's grinding circuits were conducted by JKMRC and New Celebration staff. The sizing and mass flow results from this program were used to generate a mass balance around the ball mill and cyclone circuits. From one of the surveys of the No 1 circuit, samples were taken of the new feed, cyclone underflow and cyclone overflow streams for size-by-size QEM*SEM analysis, assaying and laboratory gold leach testing. QEM*SEM provides a quantitative description of the composition of the mineral grains present in a sample. In particular it gives the proportion of liberated and composite particles.
The survey data and QEM*SEM data were then combined to generate a mass balance around the grinding circuit which included flowrate and size data for the bulk ore, liberated pyrite and unliberated pyrite.
From the QEM*SEM results the 90 - 100 per cent liberation class was chosen to describe fully liberated pyrite. All other pyrite was designated as unliberated. As QEM*SEM analysis is only generally applicable in the size range -425 + 10 \( \mu m \) , assumptions had to be made about the amount and liberation state of pyrite above and below these sizes. These assumptions were:
- all pyrite in the -10 μm fraction was liberated,
- all pyrite in the +425 µm fraction was unliberated,
- the pyrite distribution followed that of sulphur from assaying.
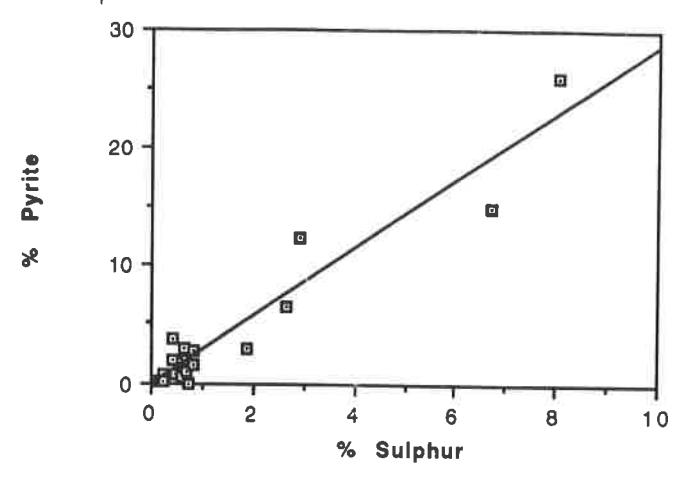
In the latter case, supporting evidence can be seen from the association between the sulphur assay and the pyrite concentration determined by QEM*SEM analysis in the -425 \( \mu m \) + 10 \( \mu m \) size fractions (Figure 2). A simple linear regression equation was developed from these data and used to estimate the amount of pyrite in the + 425 \( \mu m \) and -10 \( \mu m \) fractions.
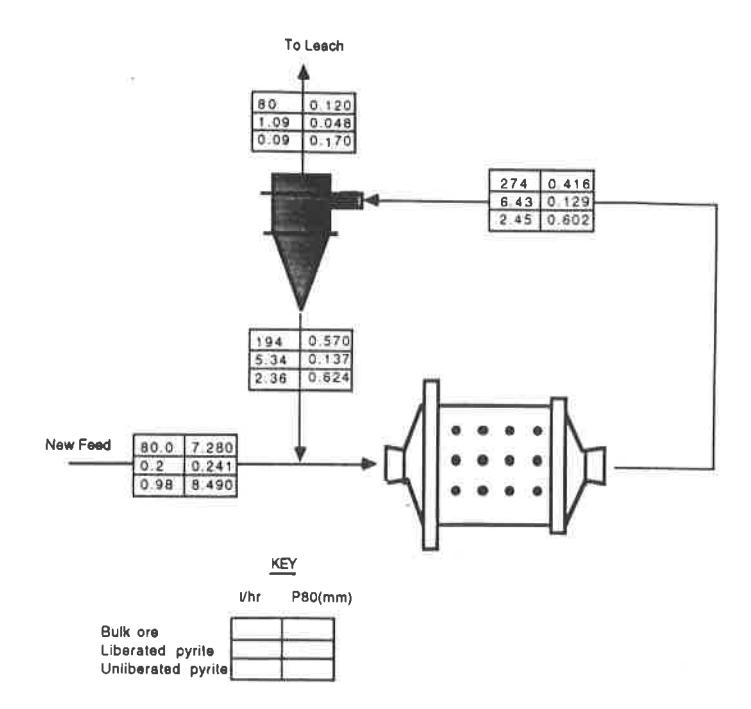
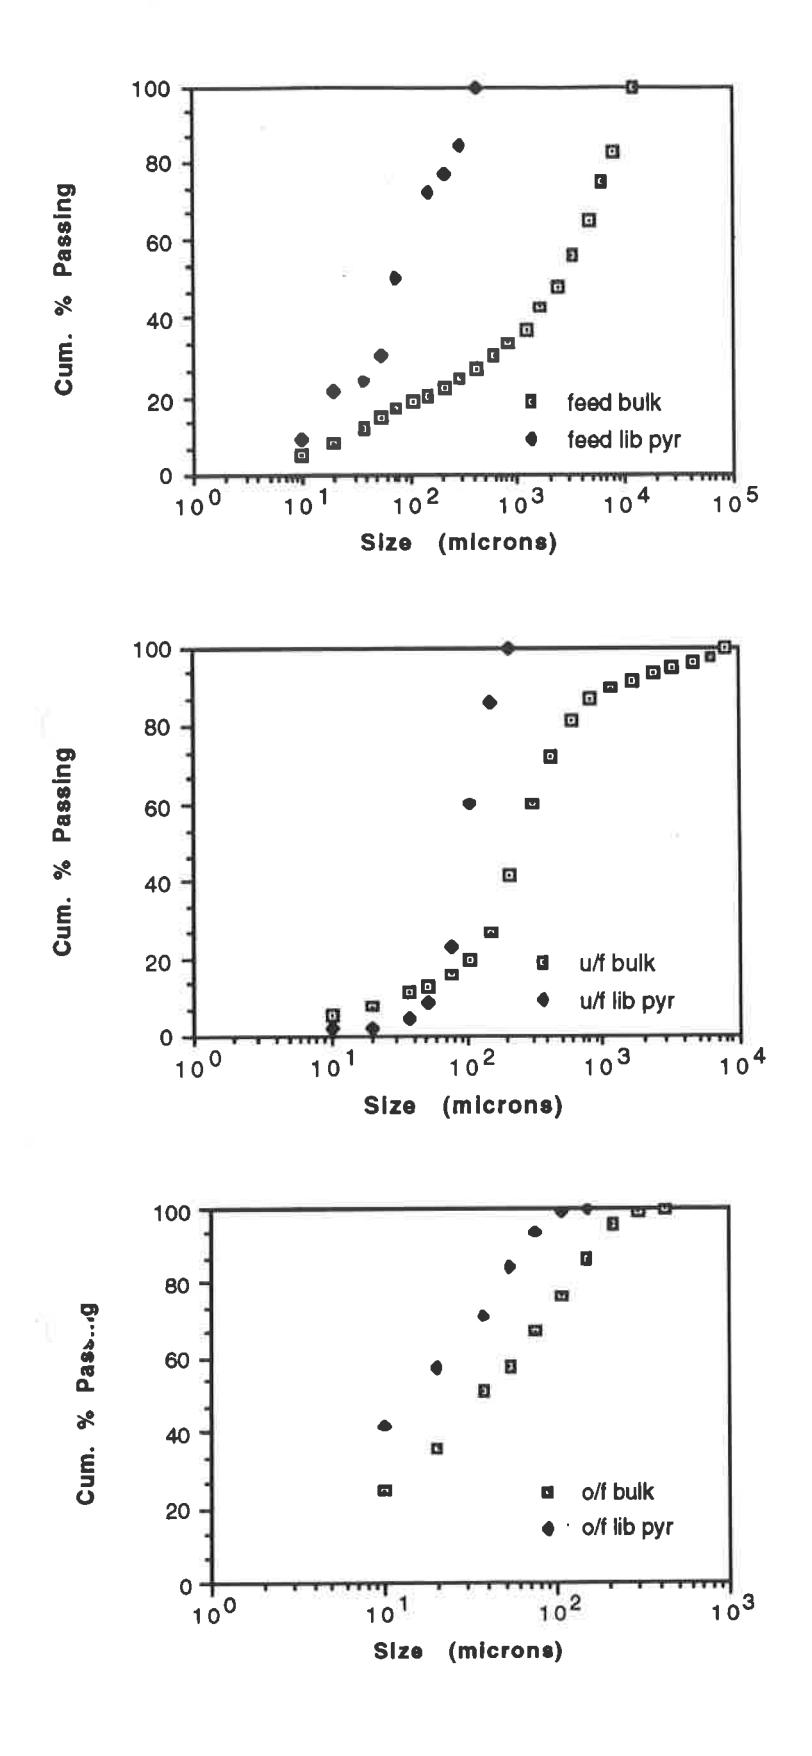
The resulting mass balance is summarised in Figure 3. The size distribution of the bulk ore and liberated pyrite are also shown in Figure 4 for the new feed, cyclone overflow and underflow. It can be seen from these data that the recycle load of liberated pyrite (based on the cyclone overflow flow rate of liberated pyrite) was 500 per cent. This compared to the bulk ore figure of 250 per cent. The reason for this difference is the higher sg of pyrite (5.0) compared to that of the bulk ore (2.74) and the effect this has on the hydrocyclone separation performance, which is well known. Hydrocyclones separate denser materials at a finer cut point and in consequence pyrite, once liberated, tends to report to the cyclone underflow in preference to the lower sg host rock. The net result is a much finer liberated pyrite size distribution. Hence the p80 of the liberated pyrite in the cyclone overflow was found to be 48 µm compared to that of the bulk ore of 120 µm.
ASSOCIATION BETWEEN GOLD, PYRITE AND LEACH RECOVERY
The mineralogical association between the gold and pyrite results in a relationship between the amount of pyrite and the amount of gold in a given size fraction. In addition the degree of liberation of the pyrite and the size of the pyrite is related to the recovery of gold. This latter relationship is a consequence of the enhanced liberation of gold which results as the liberated pyrite itself is ground finer.
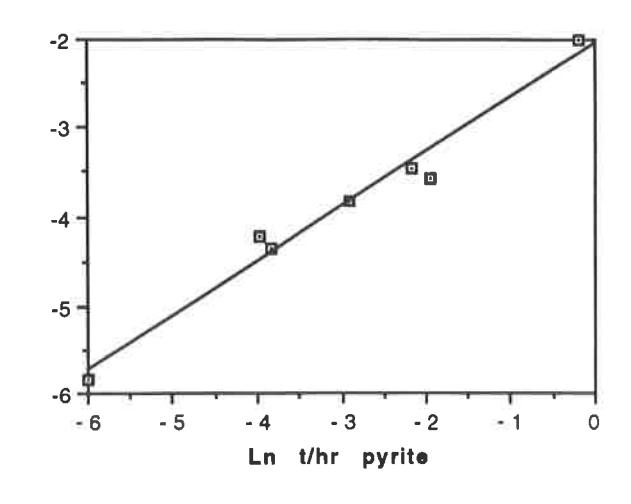
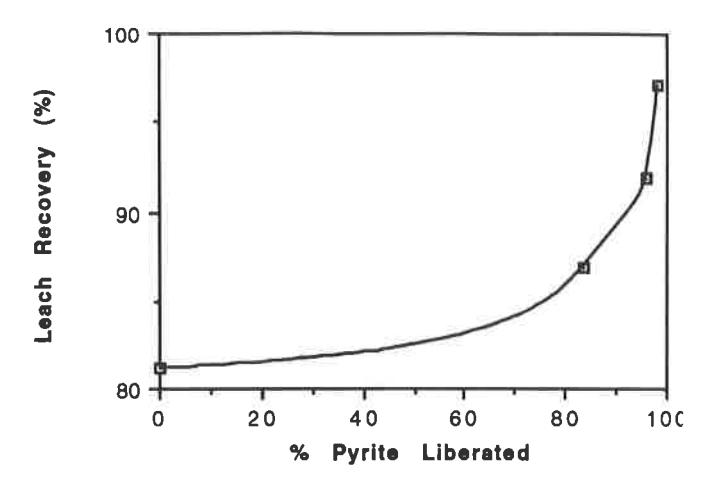
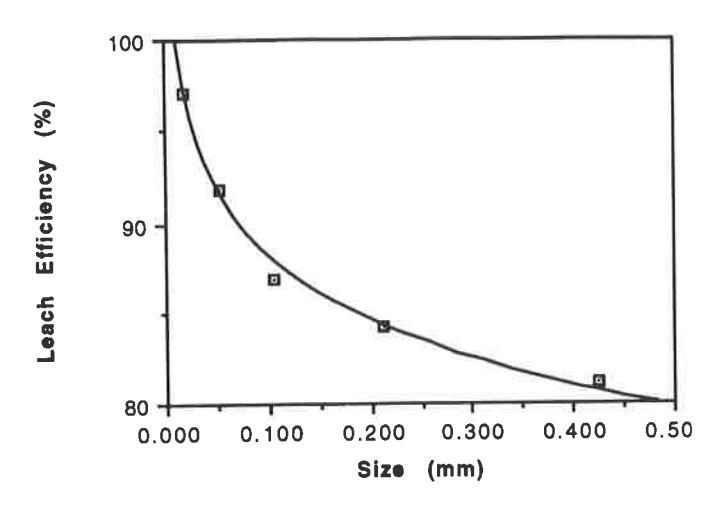
These relationships are seen in Figures 5 - 7. Figure 5 illustrates the relationship between the gold flowrate in the cyclone overflow and that of pyrite. Figure 6 shows the size-by-size laboratory leach recovery of gold compared to the percentage of pyrite liberated in the same size fractions for the cyclone overflow. Figure 7 shows the size dependency of the leach recovery efficiency. If size-by-size gold assays for the cyclone overflow are known then an overall gold recovery figure, based on laboratory leaching, can be determined from the leach test results and cyclone overflow size distribution. If gold assays are not known but the size-by-size pyrite distribution is, then an estimate of the overall gold recovery can be made by using the relationship shown in Figure 5 to determine the size-by-size gold content of the stream.
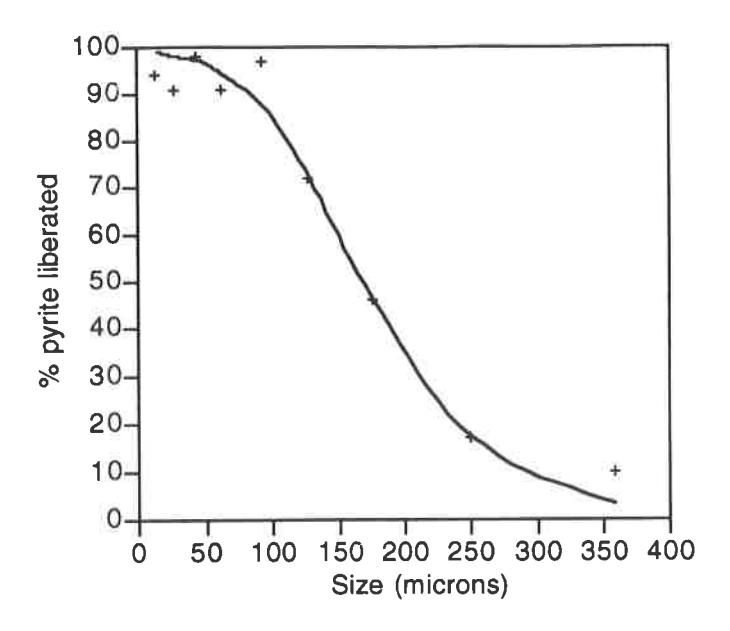
The dependence of the gold recovery efficiency on size is to some extent a reflection of the degree of liberation of pyrite, which is itself size dependent. In general the finer the size the higher will be the percentage of pyrite liberated. This is clearly evident in Figure 8.
LIBERATION MODELLING
To enable simulations to be conducted on the effect of circuit changes on liberation, simple mathematical models were constructed of the ball mill and cyclones.
Ball mill model
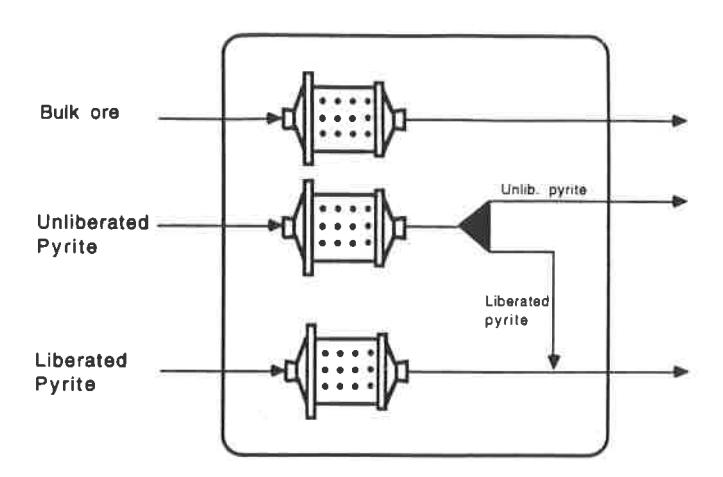
The conceptual liberation model for the ball mill is shown in Figure 9. It comprises three parallel streams representing pyrite, unliberated pyrite and the remaining ore fraction. During grinding a proportion of the unliberated pyrite is liberated and joins the pyrite stream. The amount of pyrite which is liberated within the mill will depend upon how fine the host rock is ground. This relationship between grind size and liberation is assumed to be represented by the plot in Figure 8 which can be modelled using a simple classification curve (Lynch, 1977). To describe how each of the streams is ground in the mill, Whiten's perfect mixing ball mill model was used (Whiten, 1974). Both the classification curve and ball mill model parameters were fitted using the JKMRC's non-linear fitting routine 'NLF'.
The breakage rate distribution was assumed to be the same for all streams and was fitted using the bulk ore feed and product data obtained during the survey program. The mean residence time of each stream, however, was assumed to be different, particularly in the case of the much denser, liberated pyrite which would be expected to remain longer in the mill than a less dense material. The residence times of the pyrite streams were fitted to match the mass balanced flows of material around the grinding circuit.
In the case of the appearance function (breakage distribution function) the same values were assumed for all streams. These were obtained from pendulum breakage testing of the bulk ore (Narayanan and Whiten, 1983).
Cyclone model
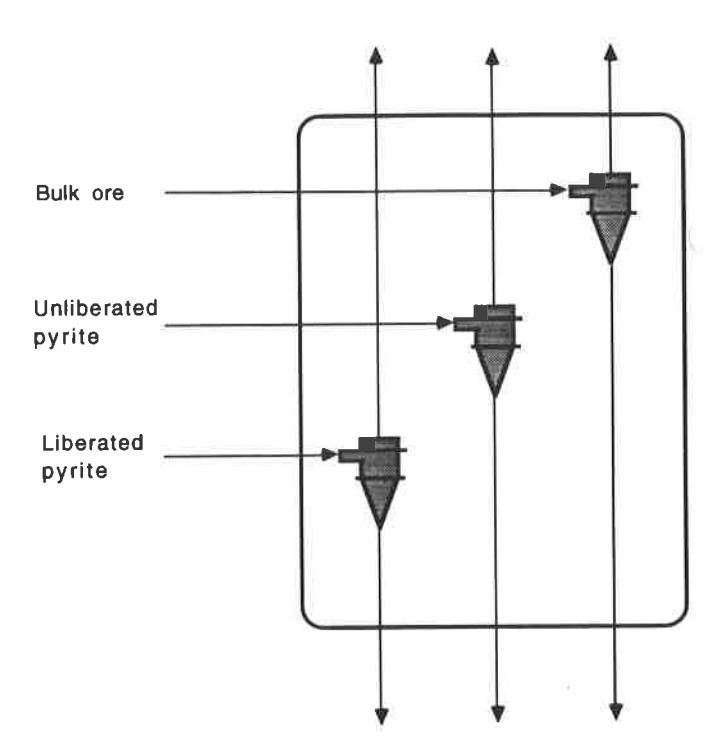
A similar parallel stream structure was adopted for modelling of the cyclone (Figure 10). A simple classification equation (Lynch, 1977) was used for each cyclone. As was expected the pyrite stream was found to generate a classification cut point much finer than bulk ore. Table 1 shows the corrected cut point ( \( d_{50c} \) ) and the efficiency curve sharpness ( \( \alpha \) ) which was fitted to the data.
| Parameter | Liberated Pyrite | Bulk Ore |
|---|---|---|
| d50c (mm) | 0.04762 | 0.1594 |
| α | 4.23 | 3.10 |
Quality of data fit
The quality of the data fit that the models provide is shown in Table 2. It can be seen that the liberated pyrite and bulk ore data fits are very good. However the size distribution fits for the unliberated pyrite are not quite as good. It should be remembered, however, that according to the sulphur-pyrite correlation the majority of the unliberated pyrite is in the + 425 \( \mu \) m size fraction for which QEM*SEM data are not available. In addition, the concentrations of unliberated pyrite in the cyclone overflow are very small and hence errors in determining their magnitude using QEM*SEM are relatively high.
| Liberated Pyrite |
Unliberated
Pyrite |
Bulk Ore | ||||
|---|---|---|---|---|---|---|
| Obs | Fitted | Obs | Fitted | Obs | Fitted | |
| Ball Mill | ||||||
| Discharge t/hr | 6.43 | 6.46 | 2.45 | 2.49 | 274 | 280 |
| p 80 (mm) | 0.129 | 0.129 | 0.602 | 1.43 | 0.416 | 0.430 |
| Cyclone | 1 | |||||
| Overflow t/h | 1.09 | 1.09 | 0.09 | 0.09 | 80 | 80 |
| p 80 (mm) | 0.048 | 0.047 | 0.170 | 0.255 | 0.120 | 0.121 |
| Cyclone | ||||||
| Underflow t/hr | 5.34 | 5.37 | 2.36 | 2.40 | 194 | 200 |
| p80 (mm) | 0.137 | 0.139 | 0.624 | 1.53 | 0.570 | 0.588 |
GOLD RECOVERY PREDICTIONS
By using the gold-pyrite correlation shown in Figure 5 it is possible to predict the amount of gold in each size fraction in the cyclone overflow from a knowledge of the flows and size distribution of pyrite. If the laboratory leach efficiencies are then applied, a theoretical gold recovery can be determined. This technique was applied to the pyrite data from mill No 1 which was fitted using the ball mill/cyclone liberation model. The results were compared to those obtained using gold assay data. The results are shown in Table 3 and show good agreement.
| Gold Recovery (%) | ||
|---|---|---|
| Observed | 93.3 | |
| Predicted | 92.9 | |
Model validation
To validate the liberation and gold recovery prediction models, data were taken from surveys of the No 2 circuit which used a different mill, different cyclones and treats approximately 45 per cent more throughput than No 1 circuit. Only the bulk ore cyclone and mill model parameters were fitted using original survey data for this circuit. Parameters for the liberated and unliberated pyrite streams were estimated using scaling factors determined from the No 1 circuit. The models were then used to predict the pyrite size distribution in the cyclone overflow and the gold recovery efficiency that would be obtained. Samples were taken from the cyclone overflow of the No 2 circuit and subjected to leach testing to determine the true laboratory-based gold recovery efficiency.
Table 4 shows the observed and predicted gold recovery for No 2 circuit. For comparison purposes the No 1 circuit data are repeated.
| Gold Recovery Efficiency (%) | ||
|---|---|---|
| Observed | Predicted | |
| No 1 Circuit | 93.3 | 92.9 |
| No 2 Circuit | 91.3 | 91.2 |
It can be seen that good agreement exists between the predicted and observed values.
The difference between the gold recovery of the two circuits can be attributed to the differences in cyclone overflow size distributions that each was observed to produce. From simulations it was found that this was particularly noticeable in the pyrite fraction where the No 1 circuit produced 65 per cent of pyrite in the -38 \( \mu m \) fraction compared to 50 per cent for circuit No 2.
SIMULATIONS
A large number of simulations were conducted which were aimed at increasing circuit throughput and/or reducing the final grind size. It is not the intention of this paper to review this work in its entirety but to concentrate on one novel solution which has a potential application in the base metal industry as well.
Cyclone and fine screen combinations
Although in the case of the New Celebration plant the concentration of pyrite in the recycle load is an advantage in that it promotes increased gold liberation, the large ball size in the mill causes this process to be carried out inefficiently. Ideally the circuit should be designed such that the pyrite should be removed soon after liberation and treated in a separate circuit more suited to fine grinding, eg one incorporating a tower mill.
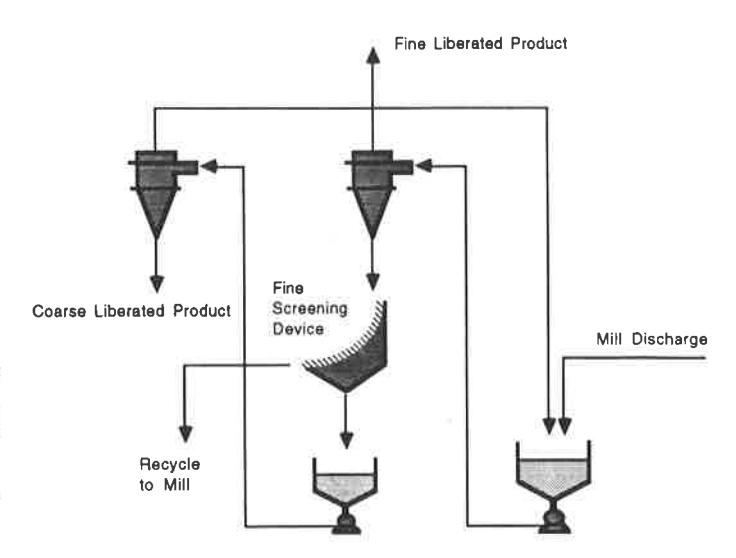
Theoretically one way to remove liberated relatively dense material from a grinding circuit is to combine cyclones and screens in a classification circuit such as that shown schematically in Figure 11.
The cyclone underflow typically contains a relatively fine fraction of denser material mixed with the much coarser lighter material. By screening the cyclone underflow it should be possible to remove the liberated dense mineral via the screen underflow and allow the coarser host rock to report via the overflow to the mill. The screen underflow will also contain some of the finer fractions of the host rock. However the size distributions of both liberated dense mineral and host rock will be far more evenly matched than in the cyclone underflow. By taking the screen underflow and passing it through a second cyclone, the separating action of the cyclone will tend to be on the basis of density. Its underflow will therefore have a relatively high concentration of coarse liberated mineral.
To determine the likely effect of such a classification circuit, simulations were run of the New Celebration No 1 circuit with the flow sheet design as shown in Figure 12. The objective was
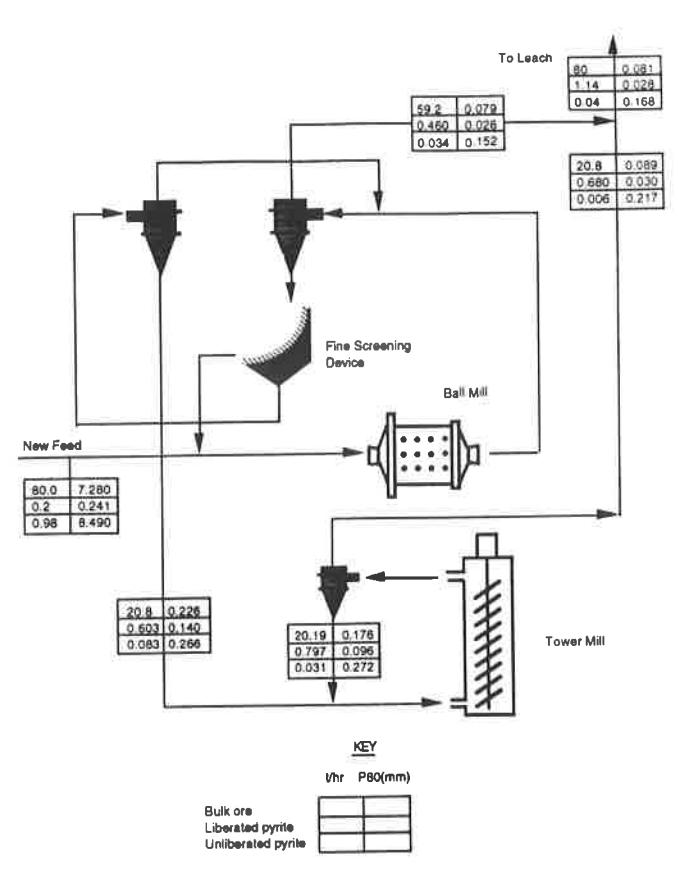
to grind the majority of pyrite to -0.038 mm to improve gold recovery. A tower mill was configured to receive the coarse liberated pyrite stream from the classification circuit. For this purpose a model based on data from Hellyer Mine's tower mills was used
The results of the simulation in terms of the pyrite flows and size distribution in the final product are shown in Table 5. The existing circuit data are also shown for comparison purposes.
|
Existing
Circuit |
New Circuit
Simulations |
||
|---|---|---|---|
| Bulk | t/hr | 80 | 80 |
| p80 (mm) | 0.121 | 0.081 | |
| Unliberated Pyrite | t/hr | 0.09 | 0.04 |
| p 80 (mm) | 0.255 | 0.168 | |
| Liberated Pyrite | t/hr | 1.09 | 1.14 |
| p 80 (mm) | 0.047 | 0.028 |
The simulations indicated that the reduction in the flows around the primary grinding circuit resulted in the primary mill being underutilised. In an existing plant this could be used to increase throughput or grind finer. When designing a new circuit a smaller mill, drawing about 33 per cent less power, would be used. In this case the saving in primary mill power more than matches the estimated power draw of the additional tower mill. This results in a slightly reduced overall grinding power requirement. For the purposes of this exercise a circuit with a smaller primary mill was chosen for simulation.
It can be seen that the liberation of pyrite increases and that the liberated pyrite is ground very much finer. These results were used to predict the expected gold recovery which indicated that recovery would increase from 92.9 per cent to 94.6 per cent.
CONCLUSIONS
Through a combination of plant surveys and analytical techniques a picture of the liberation behaviour of the New Celebration grinding circuit was developed.
By using mathematical modelling techniques changes to the plant design were explored and their likely impact on gold recovery assessed. This work indicated that potential improvements in recovery were possible.
The project highlighted the gains in efficiency which could be realised through changes to the way classification is carried out. These changes involved combining cyclones with fine screening devices to remove coarse liberated mineral from the primary grinding circuit. The ability of such circuits to work, however, relies on achieving adequate screening performance at cut points down to 0.1 mm. Devices are currently available which their manufacturers claim can work well at these sizes. KHD's Micro-Screen and Krebs' VariSieve are two such devices which are currently under evaluation at the JKMRC.
ACKNOWLEDGEMENTS
The authors would like to thank the staff of the New Celebration gold mine for their co-operation and assistance and the mine management for permission to publish this paper. The efforts of J Mutambo of the JKMRC and I Mitchell of New Celebration in conducting the plant surveys is also gratefully acknowledged.
REFERENCES
Delaney G, Martins V and Dunne R, 1992. Plant Practice at the New Celebration Gold Mine, International Conference on Extractive Metallurgy of Gold and Base Metals, Kalgoorlie, pp 95-102, (The Australasian Institute of Mining and Metallurgy: Melbourne).
Lynch, A J, 1977. Mineral crushing and grinding circuits - their simulation, optimisation, design and control, (Elsevier).
Narayanan S S and Whiten, W J, 1983. Breakage characteristics of ore for ball mill modelling, Proc Australas Inst Min and Metall, 286:589-599.
Norris, N. D., 1990. New Celebration Deposits, in Geology of Australia and Papua New Guinea (Ed: F. E. Hughes), pp 449-454 (The Australasian Institute of Mining and Metallurgy: Melbourne).
Vaughan, J P, 1990. A Mineralogical Examination of Sulphide Concentrates from the New Celebration Gold Mine, Western Australian School of Mines, Kalgoorlie.
Whiten, W J, 1974. A matrix theory of comminution machines, Chemical Engineering Science, 29:(588-599)31-39.