



The content on this page was automatically generated from the PDF publication document and may contain errors or inaccuracies. Please refer to the original PDF for the most accurate information.
THE MODELLING OF AUTOGENOUS AND SEMI-AUTOGENOUS MILLS
Homero Delboni Jr.' and Steve Morrell 1- Research Scholar, 2- Manager Comminution Research Julius Kruttschnitt Mineral Research Centre University of Queensland, Brisbane, Qld, Australia.
ABSTRACT
The Julius Kruttschnitt Minerals Research Centre (JKMRC) has been involved in the study and modelling of industrial autogenous (ag) and semi-autogenous (sag) mills for over 20 years. Recent research at the JKMRC has developed a new aglsag mill model which is based on charge dynamics. The model relates charge motion and composition to power draw and size reduction. Size reduction is described by considering impact and abrasionlattrition as separate processes. These are linked to the energy available in the mill, the charge size distribution and the relative motion of the grinding media. Ore specific energybreakage relationships are described using laboratory data which are obtained from breakage tests over a wide range of energies and particle sizes. Slurry transport is described using the JKMRC's latest model which incorporates the effects of grate design. This paper describes the overall structure of the model together with its main sub-processes.
BACKGROUND
In grinding mills the kinetic energy that the rotation of the mill shell imparts to the grinding media is subsequently transferred to ore particles with which they are in contact, so causing breakage. The kinetic energy of these breakage events is related to both the size and velocity of the grinding media whilst the frequency of these events is associated with the number of grinding media and the rate at which they circulate within the mill. The process is a discrete one as it comprises many individual collisions or breakage "eventsn. The products of these breakage events may then leave the mill via the discharge grate due to entrainment by slurry, or remain to undergo further breakage.
In ball mills the grinding media is comprised exclusively of steel balls which remain unchanged regardless of feed conditions. The equilibrium size distribution of most ball charges follow a predictable pattern (Auaroni, 1987) and are very similar to one another, regardless of the mill and ore being treated. This greatly simplifies the task of determining the rate at which breakage events are generated. However in sag mills and in partcular ag mills the grinding media derive from the feed ore. The feed ore hardness and size distribution therefore dictate the number and size distribution of the grinding media which will vary greatly from mill to mill and ore type to ore type. It is this factor which has remained central to the problems facing modellers of ag and sag mills. To some extent this problem has been addressed in the existing JKMRC model through the use of correlations between the breakage rate distribution and operating conditions (Morrell and Morrison, 1996). However this approach does not take into account the interaction between feed, charge and the breakage rate distribution and hence treats the symptoms of the problem rather than the cause. Its robustness is therefore limited by the range of data used to generate the correlations and by the relatively simple parameterisation of the complex interactions inside aglsag mills that such an approach engenders.
It follows from these arguments that for modelling purposes it is necessary to have a description of at least the following:
*frequency of breakage events for each size fraction and its relationship to the charge
- ➤ energy associated with each breakage event and its relationship to the charge
-
Size distribution of the products from each breakage event
- ➤ classification performance of the grate
- · Frelationship between slurry hold-up in the mill and its flowrate out of the mill
In the following paper the way that each of these is incorporated in the new JKMRC model is discussed in detail.
CHARGE MOTION
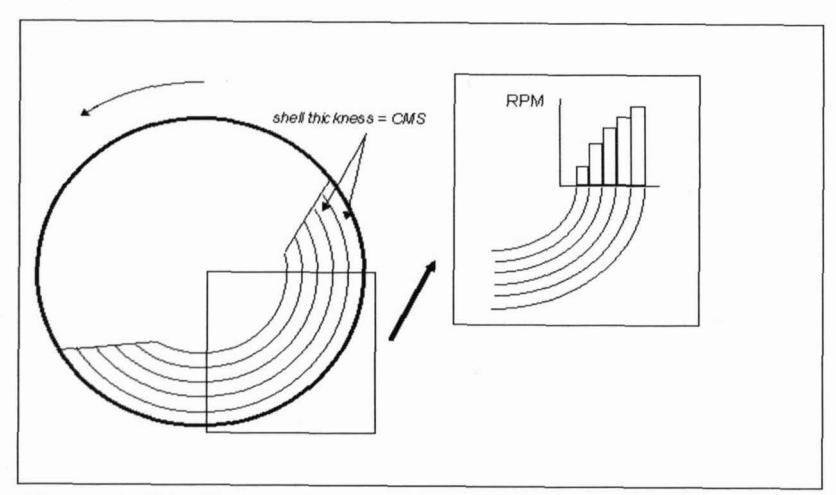
In the modelling approach described in this paper the motion and size distribution of the charge is related to the rate at which breakage events occur as well as their energy. Modelling of the charge motion is based on the approach adopted by Morrell in the development of his "D-model" (Morrell, 1993) for predicting the power draw of tumbling mills. In this model the grinding media charge is represented by a series of concentric layers or 'shells'. It is hypothesised that although the grinding media in a mill comprise a distribution of sizes, for the purposes of describing the charge motion there exists a mean size which is characteristic of the entire distribution - a characteristic media size (CMS). Therefore each shell has a mean width which is equal to the CMS. The charge is set in motion by the transfer of momentum from the mill shell to the outermost shell of the charge. Motion is subsequently transferred throughout the charge by successive contacts between contiguous shells of particles. As a consequence of slip between these shells a loss of rotational rate (rpm) occurs from the mill shell to the centre or 'kidney' of the charge. Schematically this is illustrated in Figure 1.
For the bulk of the charge the location of the toe and shoulder for each shell is modelled using empirical equations derived from measurements taken of the true position of these points in a laboratory mill, as is the degree of slip between each shell (Morrell, 1993). Delboni has modified this description by incorporating Powells equations (Powell, 1991) for describing the trajectory of particles in contact with the lifters. Powells equations also allow the effect of the angle of the lifter on the trajectory to be determined.
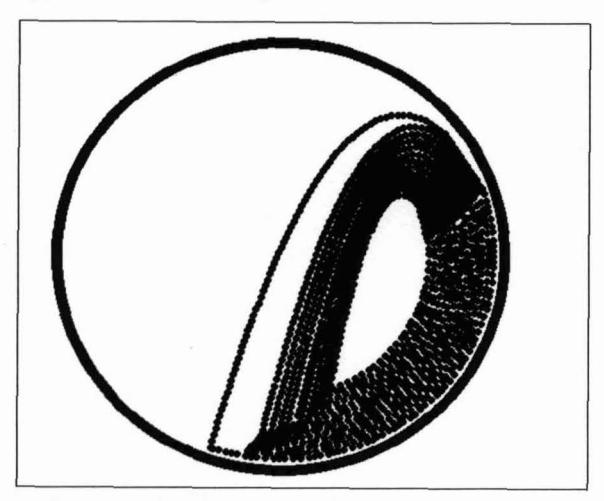
The net result is a model which predicts the motion of the grinding charge as well as the power draw under a wide range of operational and design conditions, and includes the effect of such factors as particle size, lifter geometry, mill filling and mill speed. Apart from the shell structure of the charge no assumptions are made about the shape that the charge takes up. However a lifelike prediction of the charge motion is provided by the model and is typified by that shown in Figure 2.
BREAKAGE FREQUENCY AND ENERGY
The slip between the shells causes a shearing motion and creates the conditions necessary for attrition breakage where relatively small particles are nipped between grinding media as they slide against one another. Impact breakage occurs predominantly in the vicinity of the toe of the charge where the grinding media impact after falling from the shoulder of the charge. The D-model differentiates between the power associated with each of these mechanisms and provides seperate estimates of impact and attrition power. The grinding media are viewed as as "contactors" in the model and are used to determine the input energy for breakage in each of these modes. An estimate of the total frequency of breakage events in each mode is also provided by the model using the rate at which the charge rotates as well as the rate at which the shells slide against one another.
The separation of impact from attrition breakage is a departure from the way most models treat breakage. Untill now it has been usual to describe breakage in terms of a single rate distribution as shown in Figure 3.
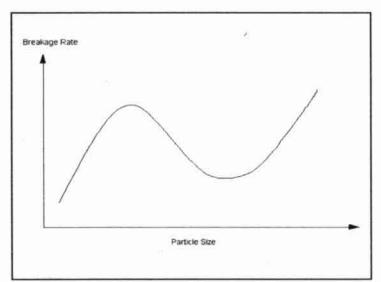
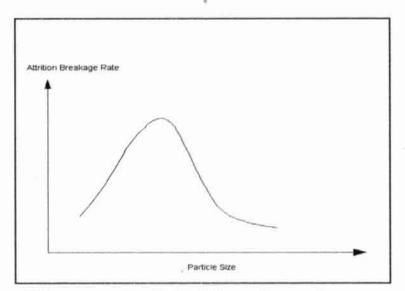
Various modes of breakage have then been assiged to different parts of the distribution (Stanley, 1974; Morrell et al, 1996). In this most recent model from the JKMRC, breakage is described by two separate distributions which are illustrated schematically in Figures 4 and 5. Both curves theoretically extend over the whole range of particle sizes though in reality the impact rate only reaches significant values above a certain particle size but increases steadily as the particle size increases.
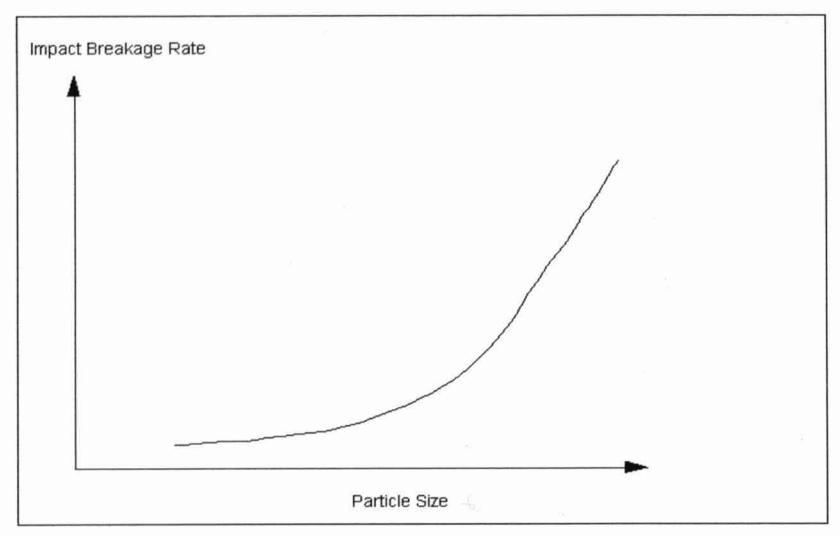
It is believed that impact breakage is only important for larger particle sizes - typically those of the grinding media. For very large particle sizes the specific energy for breakage is low and hence only surface material is broken off the parent particle. This is typically referred to as chipping and abrasion breakage. As the particle size reduces the specific energy increases until it is sufficiently large that fractures propagate through the body of the particles, causing size reduction similar to that experienced in conventional crushers. The specific energy at which the first fractures begin to propogate can be measured quite accurately (Bourgeois et al 1992, Briggs and Bearman, 1996). Hence if the energy imparted by the mill is known the size of particle which first experiences this type of breakage can be calculated. Particles just bigger than this size are often referred to as the 'critical size' due to their build-up in the charge.
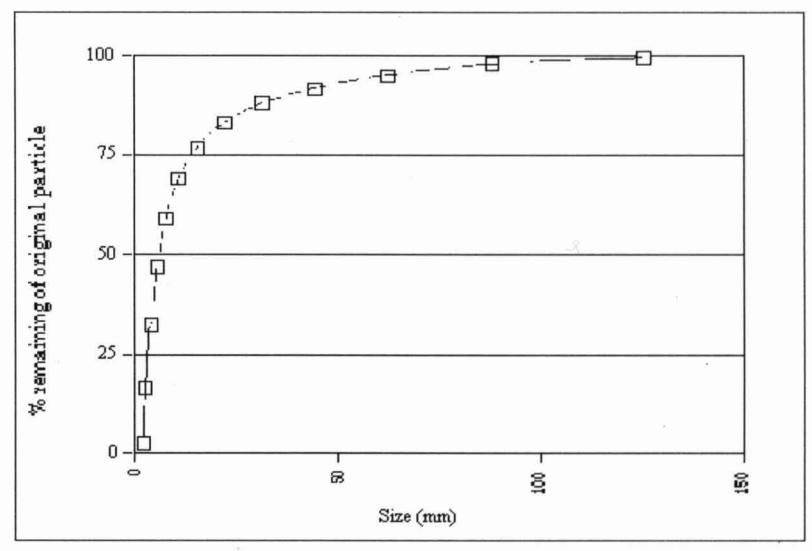
It should be noted that the shape of the impact breakage frequency curve does not change at the critical size. However the shape of the product size distribution curve will change quite dramatically. This is illustrated in Figure 6 where the model's predictions of the size dependence of the breakage product distribution is given for an autogenous pilot scale mill treating a very competent coppertgold bearing ore.
The total number of breakage events provided by the contactors (grinding media) will be distributed amongst the rocks which receive the contacts (contactees) as will the input energy. It is therefore necessary to have functions which describe the way the total breakage frequency and energy is disributed amoungst the size fractions of the contactees. Once this is done it is then possible to estimate both the specific energy of breakage as well as the frequency of breakage of each size fraction. Underlying each of these functions is the assertion that the breakage frequency is dictated by the surface area of the grinding media, whilst the probability that a contactee will be involved in a collision with an contactor is related to the surface area of the contactee. It is further assumed that a contactee can only be broken by contactors which are rocks of equal or greater size and steel balls which can be of any size.
BREAKAGE FREQUENCY
Given the definition of contactor and contactee used in the model it follows that the fraction of breakage events received by a given size class is a weighted frequency based on the surface area of balls and rocks greater than or equal to the size class.
Mathematically this can be represented by the function F,. This is equally applicable to the impact and attrition breakage frequency distributions.
$$ F_{i} = A_{i} \left[ \sum_{j=1}^{i} \left( \frac{A_{j}}{\sum_{k=j}^{n} A_{k}} \right) + \left( \frac{A_{B}}{\sum_{k=1}^{n} A_{k}} \right) \right] $$ (1)
where
A, = total surface area of size fraction i
A, = total surface area of ball charge
The specific breakage frequency ie the rate at which a particle is contacted and broken will be proportional to F, as well as the rate at which the charge circulates within the mill. Hence if ri is the specific breakage frequency then: ri cc F, rpm.
IMPACT BREAKAGE ENERGY
The rate at which breakage energy is imparted is related to the motion of the charge. From the shell description used by the model the mean energy associated with each impact can be estimated from:
Average Energy per Impact:
$$ E_{cs} = (kWh/impact) = \frac{\sum_{1}^{n} P_{I}}{\sum_{1}^{n} N_{I}} $$ (2)
where
PI = impact power asociated with shell I (kW)
N, = number of impact contacts per unit time given by shell I
This average energy is associated with the characteristic media size of the grinding charge (CMS). As impact at the toe occurs in a bed of particles the impact energy will be shared amoungst a number of impactees depending on their surface area. The specific energy for impact is therefore given by:
➤ Specific Energy per Impact:
$$ E_{csi} = (kWh/t) = \left(\frac{E_{cs}}{m_i}\right) \left[\frac{x_i}{CMS_c}\right]^2 $$ (3)
where
xi = impactee particle size
mi = mass of particle i
As the model assumes that each size fraction can only be broken by rocks greater than or equal to its own size or steel balls, then the input energy which causes breakage will also vary with each size class. This can be represented by the function - \( K_i \) - which is a weighted surface area and density term:
$$ K_{i} = \frac{A_{oi+}(CMS_{oi})^{3}\rho_{o} + A_{b}(CMS_{b})^{3}\rho_{b}}{A_{t}(CMS_{c})^{3}\rho_{o}} $$ (4)
where
Aoi+ = surface area of particles equal to or larger than i
Ab = total surface area of the ball charge
At = total surface area of the grinding media
\( CMS_{oi} \) , \( CMS_{b} \) , \( CMS_{c} \) = characteristic media size of particles equal to or coarser than size i, ball charge and the entire grinding media charge respectively (m)
\( \rho_o \) , \( \rho_b \) = density of the ore and balls respectively (t/m3)
ATTRITION BREAKAGE ENERGY
At this stage of the model's development attrition breakage is considered to occur only in size classes which do not contribute to the grinding media. In addition this type of breakage is not considered to occur in a bed of particles but as single particle events. Hence the specific energy for attrition breakage is calculated from:
Average energy per attrition event: $$ E_{css} = \frac{\sum_{1}^{n} P_{s}}{\sum_{1}^{n} N_{s}} $$ (5)
Specific energy per attrition event: $$ E_{cssi} = \frac{E_{css}}{m_i} $$ (6) where:
P, = power absorbed by shell S due to shear motion N, = number of attrition contacts per unit time provided by shell S
V, = relative velocity of shell S
L = mill length
CMS = characteristic media size of the entire grinding media charge
ORE BREAKAGE CHARACTERISATION
The model relies on ore breakage characterisation data which are obtained from laboratory breakage tests using the JKMRC's drop-weight impactor. This device is able to accomodate particles in the size range 10-100mm ie covering the range of sizes typically found in the grinding media of ag and sag mills. It is used to measure the product sizes from breaking rocks in this size range at a range of specific energies. These results are augmented with autogenous tumbling tests using a 300mm diameter laboratory mill. In this mill the breakage energy is very small and results in size reduction typical of abrasion and chipping. Using a charge motion model, the energy that is imparted to the rocks as they tumble is estimated. From the resultant product sizings and the grinding time the product size after each tumble is determined. An abrasionlchipping product size and associated specific energy is therefore calculated. The impact and tumbling tests provide an ore specific "map" of the way a rock breaks for a wide range of particle sizes and specific energies. These data are assembled in a size-by-size matrix relating specific energy to product size distribution. This is incorporated in the model which, after determining the appropriate specific energy for a breakage event, uses it to estimate the resultant product size distribution.
SLURRY TRANSPORT AND CLASSIFICATION
Transport of slurry through the mill is described by a function which relates the hold-up of slurry, grate design, grate open area and mill speed to the volumetric discharge rate through the grate (Morrell and Stephenson, 1996):
where
Jp = fractional slurry hold-up
D = mill diameter (m)
\( \gamma \) = mean relative radial position of the grate apertures = \( \frac{\sum r_i a_i}{r_m \sum a_i} \)
ai = open area of all holes at a radial position ri
\( r_m \) = radius of mill inside the liners.
A = total area of the grate apertures (m2)
Q = volumetric flowrate out of the mill (m3/hr)
To describe the classification of particles by the grate Leung's approach was used (Leung,1987) in which the classification efficiency (Ci) is reresented as follows
$$ C_{i} = \frac{\ln\left(\frac{x_{i}}{x_{g}}\right)}{\ln\left(\frac{x_{m}}{x_{g}}\right)} \qquad x_{g} > x_{i} > x_{m} $$ (8b)
NEW AG/SAG MILL MODEL STRUCTURE
The structure of the new model is shown schematically in Figure 7.
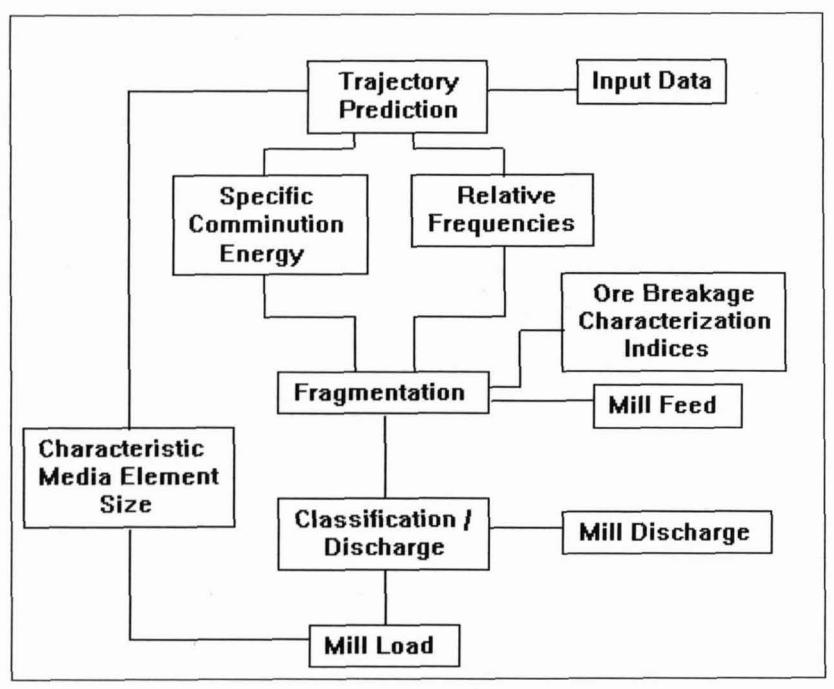
Mathematically the various sub processes are brought together in the following equations:
$$ f_{i} - d_{i}s_{i} + \sum_{j}^{i-1} s_{j} \left( a_{ij}^{imp} r_{j}^{imp} + a_{ij}^{att} r_{j}^{att} \right) - $$ $$ s_{i} \left[ r_{i}^{imp} \left( 1 - a_{ii}^{imp} \right) + r_{i}^{att} \left( 1 - a_{ii}^{att} \right) \right] = $$
where
fi = volumetric flowrate of size i material entering the mill
pi =volumetric flowrate of size i material discharged from the mill
di = discharge rate of size I
Ci = classification function (equation 8a - 8c)
= specific impact breakage frequency function
=k Fi rpm
F = breakage frequency parameter
fff = specific attrition breakage frequency function
si = volume of size i material in the mill
a? = appearance function refering to the mass fraction of size j which appears at size i, from breakage after an impact event
aiff = appearance function referring to the mass fraction of size j which appears at size i, from breakage after an attrition event
Q = volumetric flowrate of slurry
y = grate design parameter
A = grate open area
4 = fraction of critical speed
D = mill diameter
V,,, = mill volume
z = calibration constraint
The model operates in an iterative manner in a way that it is believed that a real mill does. Following input of design, operational, and ore breakage characterisation data the model begins execution by making an initial estimate of the specific breakage energy and breakage frequency using the trajectory model and a load size distribution equal to that of the feed. A discharge rate is estimated using the hold-up - flowrate model after which the model calculates a new load size distribution, load volume and product size distribution. The model then iterates again until the load size distribution, load volume and product size distribution stabilises.
INITIAL MODEL RESULTS
One of the objectives of the development of this model was to relate the breakage frequency and energy to the motion of the charge, its make-up in terms of steel and rocks and water, and its size distribution.
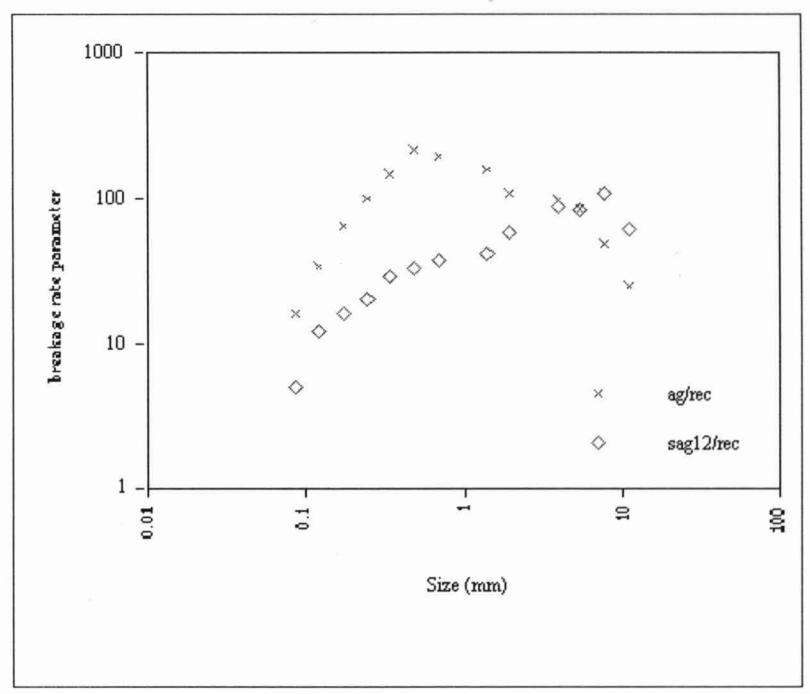
By so doing it was hoped that a more lifelike mathematical model would be created which, unlike existing models, would not be dependent upon fitted parameters which were functions of design and operating conditions. An indication as to whether this objective has been met comes from the breakage frequency parameter (F.). This has to be back-calculated from feed, charge and product data using equations 9 & 10. If the model executes in the reguired manner then F, should be independent of operating conditions ie the relationships and assumptions made elsewhere in the model take account of the effects of changing operating conditions. Figure 8 shows plots of F, for impact breakage which were fitted to data obtained from a 6' x 2' pilot ag/sag mill treating a very competent copper/gold ore. The figure shows the results together with the 95% confidence intervals from 2 extreme cases - ag and sag with 12% balls. The results are very encouraging in that the relationships are almost identical.
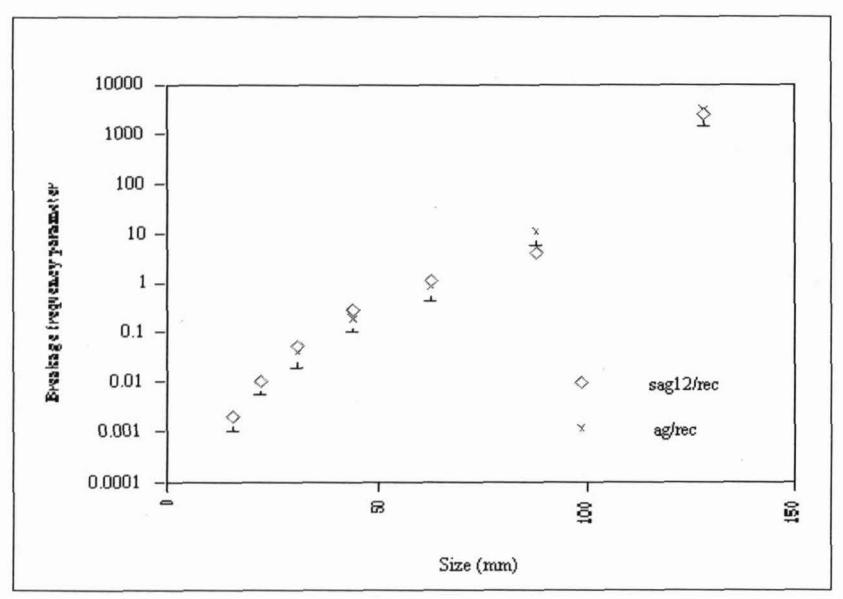
Figure 9 shows the back-calculated attrition breakage frequency curves for the same data sets. Research is still underway into the description of this type of breakage in the model. At this stage it is clear that there is a strong dependence on operating conditions.
CONCLUSIONS
A new ag/sag mill model has been developed which is based on the dynamics of the grinding charge as well as its size distribution and composition. The effects of changes in such operating conditions as feedsize distribution and ball charge level are inherently described within the model as is the effect of changes to the height and shape of the lifters. Slurry transport and classification are described using recently developed relationships between the slurry hold-up and flowrate out of the mill. Initial results using pilot scale data indicate that the model accounts for ball charge and load size distribution effects very well.
Further development of the model is currently underway, particularly in defining the relationship between attrition breakage and load characteristics.
REFERENCES
Leung K, 1987. An energy based, ore specific model for autogenous and semi-autogenous grinding mills. PhD thesis. University of Queensland.
Morrell, S, 1993. The prediction of power draw in wet tumbling mills. PhD thesis. University of Queensland.
Stanley G G, 1974. The autogenous mill - a mathematical model derived from pilot and industrial scale experiment. PhD Thesis. University of Queensland.
Morrell S, Finch W M, Kojovic T, Delboni H Jr., 1996. Modelling and simulation of large diameter autogenous and semiautogenous mi1ls.lnt.J. Mineral Process. In press.
Briggs C A and Bearman R A, 1996. An investigation of Rock Breakage and Damage in Comminution Equipment, Minerals Engineering Vol 9, No.5, pp 489 - 497.
Bourgeois F, King R P & Herbst J A, 1992. Low - Impact - Energy Single Particle Fracture Comminution - Theory and Practise. Ed: Kawatra S K, SME, Littleton, Colorado, Chapter 8, pp 99 - 108.
Morrell S and Stephenson 1, 1996. Slurry discharge capacity of autogenous and semi-autogenous mills and the effect of grate design. 1nt.J. Mineral process. In press.
Powell M S, 1991. The effect of liner design on the motion of the outer grinding elements in a rotary mill. 1nt.J. Mineral Process., 31, 163 - 193.
Azzaroni A, 1987. Considerations on the performance of grinding balls in operating conditions and eventual effects in determining the wear law factors. 5th symposium on grinding, Armco, Chile, SAMI, Vina del Mar.