



The content on this page was automatically generated from the PDF publication document and may contain errors or inaccuracies. Please refer to the original PDF for the most accurate information.
The Operation and Interaction of Grates and Pulp Lifters in Autogenous and Semi-Autogenous Mills
S. Morrell and S. Latchireddi
INTRODUCTION
Close circuiting autogenous and semi-autogenous mills is an energy efficient way of grinding and a number of operations have utilised this in the design of their comminution circuits. Due to the large flow of slurry through the mill that results from operating this way the grates and pulp lifters have to be designed to cope. However, the literature has little or no information on how grate and pulp lifter size and design are related to their ability to remove slurry from the mill. Over the last few years the JKMRC has been researching this area and has developed relationships between grate/pulp lifter design and flowrate capacity. At the same time it has determined the major causes of pulp lifter inefficiency and a solution to preventing this inefficiency (the Twin Chamber Pulp Lifter). This paper describes the models that have been developed through this program and uses industrial scale data to illustrate their accuracy. Results from the industrial trials of the Twin Chamber Pulp Lifter are also presented.
PULP LIFTER OPERATION
General
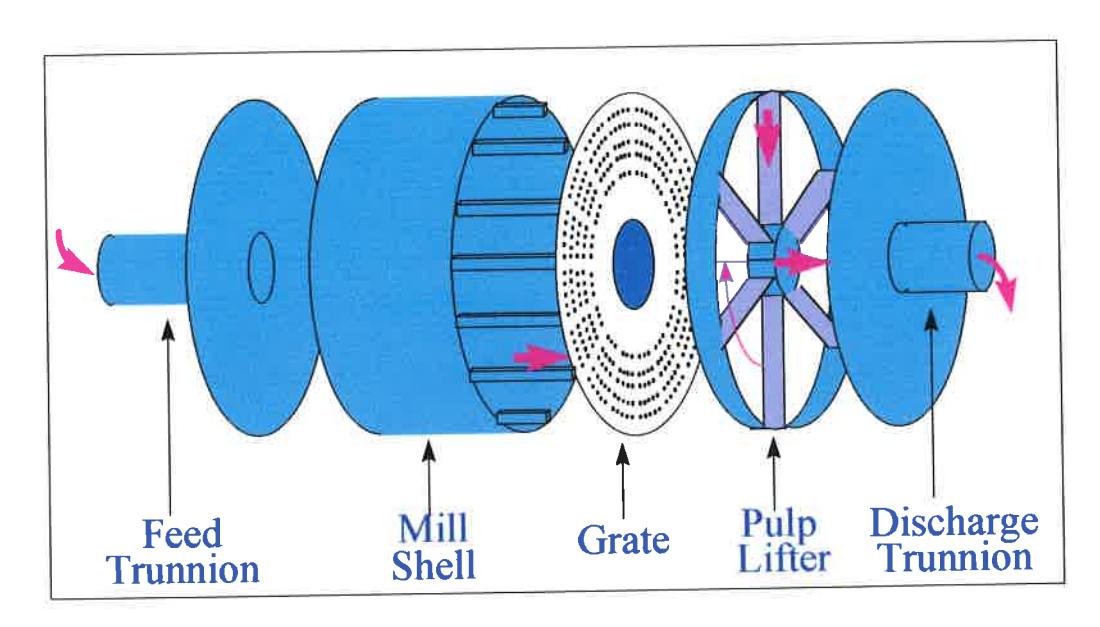
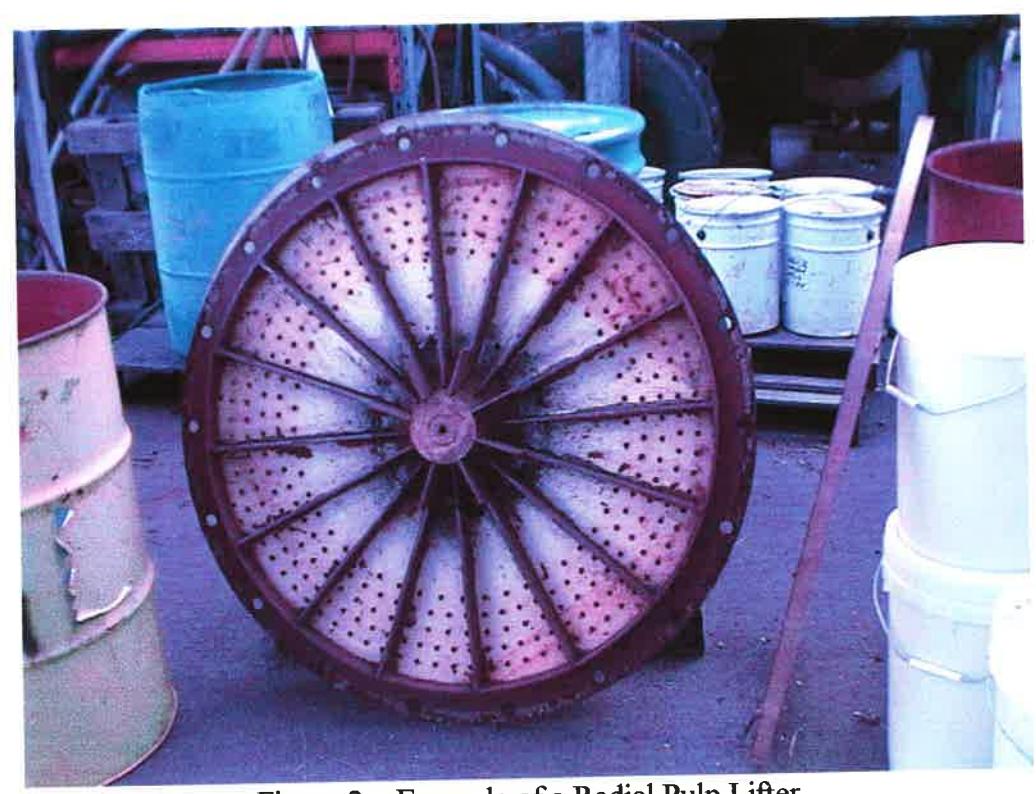
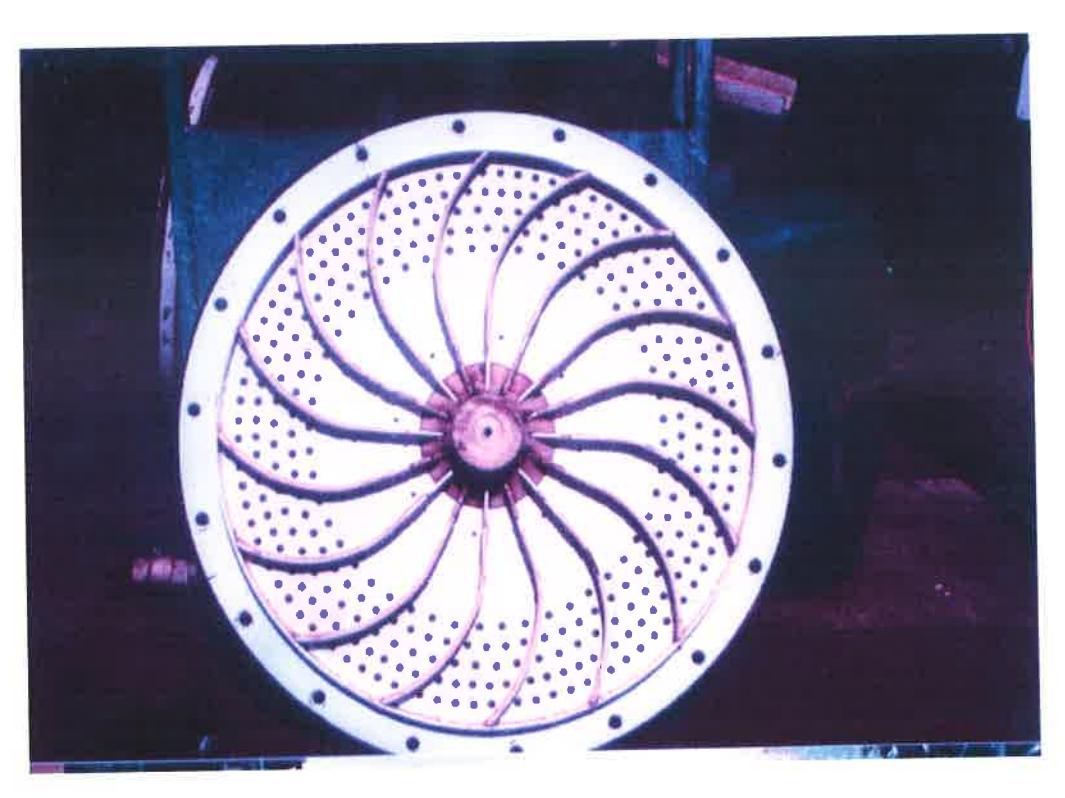
A schematic of a mill/pulp lifter assembly is shown in Figure 1. The purpose of the pulp lifter is to transport the slurry, which has flowed from the grinding chamber through the grates, out of the mill via the discharge trunnion. In Figure 1 the most common design of pulp lifter is shown. This comprises a series of straight radial blades, giving rise to the term radial pulp lifters (RPL). As the pulp lifter moves with the rotation of the mill the slurry is lifted up and eventually slides down the blades towards the centre of rotation of the mill. When it reaches this point it is deflected either by a cone or a curved channel into the discharge trunnion and out of the mill. To help assist transport of the slurry down the blades they are sometimes designed with a curve to them which gives rise to the so-called spiral or curved pulp lifter (CPL) design. Pictures of radial and curved pulp lifters (for a pilot mill) are shown in Figures 2 and 3.
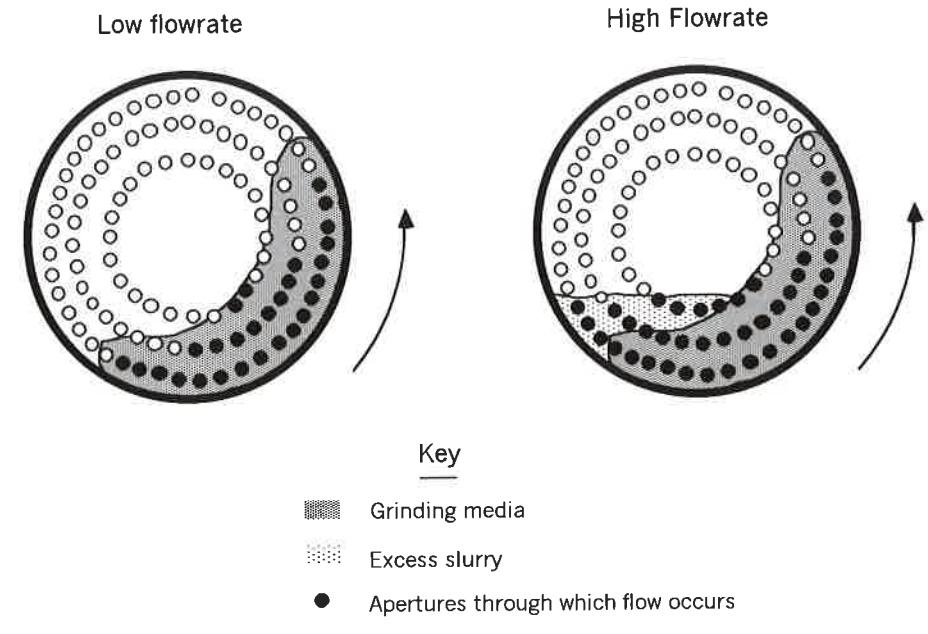
The driving force for the slurry to enter the pulp lifters via the grates is the slurry head which builds up in the grinding chamber. This slurry is referred to as (slurry) hold-up and it occupies the interstices of the rock/ball grinding charge. As the flowrate into the mill is progressively increased the mill will come to equilibrium with a higher and higher slurry hold-up. At the same time the rock level will also increase. Eventually a point will be reached where the slurry hold-up is greater than the volume of the interstices in the grinding charge and at this point a so-called slurry pool will form. This is shown schematically in Figure 4. Further increases in flowrate into the mill will cause the slurry pool to increase until slurry starts to spill out of the feed trunnion. The effect of the slurry pool is to depress the power draw of the mill and to reduce grinding efficiency The influence of the slurry pool on power draw is (Morrell and Kojovic, 1996). particularly noticeable in ag and sag mills which are closed with cyclones or fine screens This can be seen from the and which have limited grate/pulp lifter flow capacity. following empirical equation which was developed from data from a sag mill in closed circuit with DSM screens (Morrell, 1989).
Power (kW) = 495 + (12.19 * charge mass) - (693.1 * recycle fraction)
where recycle fraction is the recycle tonnage rate divided by the total feedrate to the mill and charge mass is measured in tonnes. In this equation it is not the recycle load per se which influences the power but the total volumetric flowrate of slurry which is directly related to the recycle load. In closed circuits the slurry flowrate through the mill is relatively high and hence results in a relatively high slurry hold-up. As both flowrate and hold-up increase as the recycle load increases, this results in an increase in the mass of the mill contents. However, if a slurry pool has formed this also results in a drop in power draw.
Relationship Between Flowrate and Design
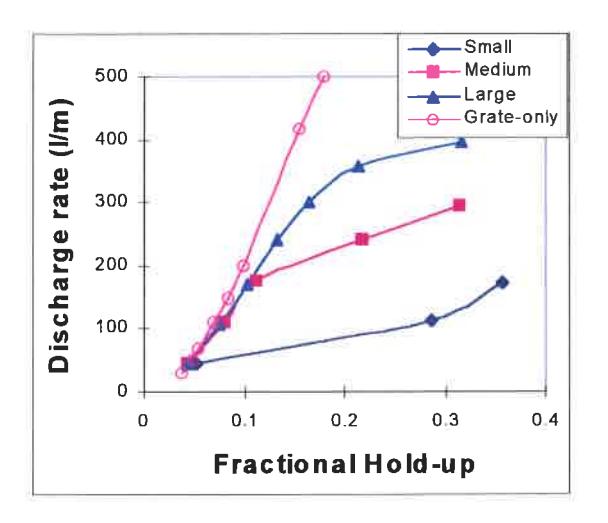
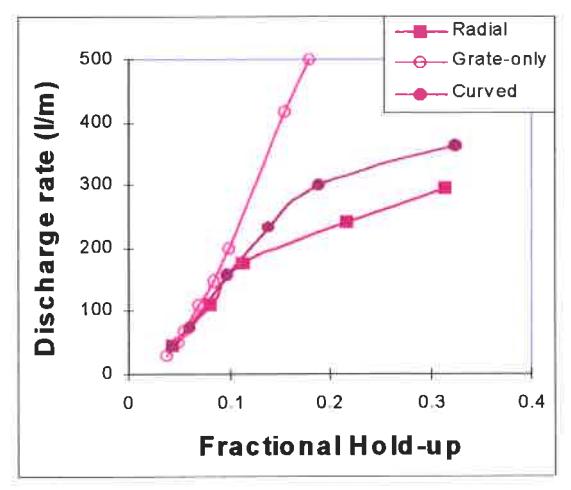
From a purely transport viewpoint the ideal performance is obtained by running the mill with a grate-only discharge mechanism. Under these circumstances the slurry hold-up for a given flowrate will be a minimum. If pulp lifters are added and they have sufficient discharge capacity the slurry hold-up will be equal to that of a grate-only discharge mechanism. If not, the hold-up will be greater. The degree of deviation indicates the inefficiency of the pulp lifter discharge mechanism. Typically as the depth of the pulp lifter increases the performance of the grate/pulp-lifter assembly gets closer to that of the grate-only discharge system. This is illustrated in Figure 5 where pilot data are shown for a range of pulp lifter sizes (small, medium and large). The figure also illustrates the superiority of the curved over the radial design.
Pulp Lifter Inefficiency
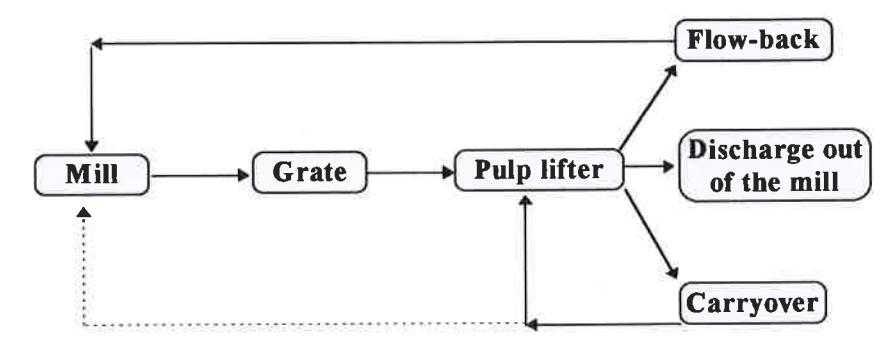
The inefficiency of conventional designs of pulp lifters with respect to grate-only performance may be attributed to flow-back and carry-over processes. This is illustrated schematically in Figure 6.
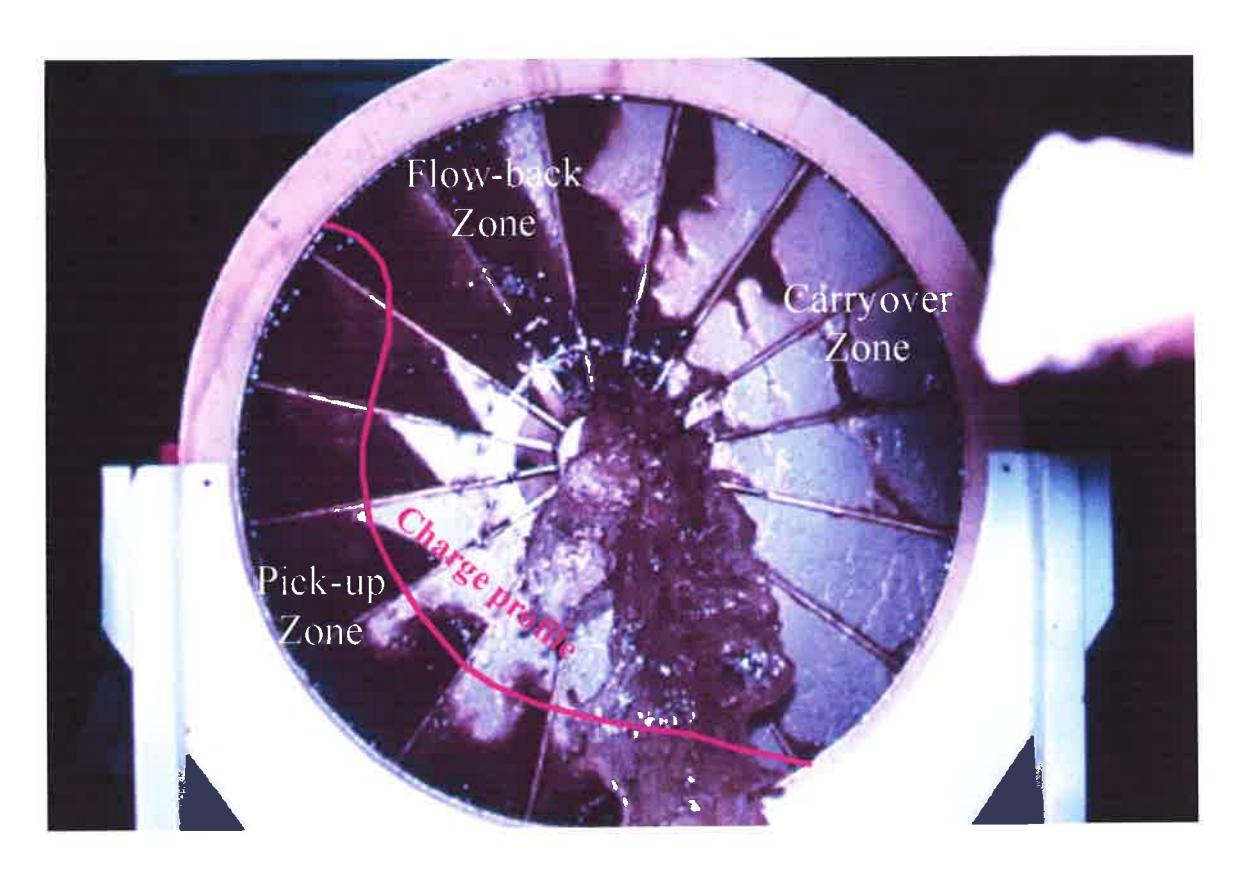
Both flow-back and carry-over processes are further illustrated in Figure 7, where the grate-pulp lifter assembly is divided into three different zones based on the operation of the pulp lifter during each revolution of the mill. The picture shown in Figure 7 comes from a 1m pilot scale mill. When the mill is operating, the charge and the slurry inside the mill typically occupy the pick-up zone. Each segment of the grate-pulp lifter first passes through this zone, where slurry flows through the grate and accumulates in the pulp lifter chamber. As the mill rotates further, the pulp lifter and the slurry contained in it are raised up to the flow-back zone where the slurry begins to flow down the radial face. However, once the grate-pulp lifter segment leaves the pick-up zone, the grinding media charge and associated slurry will be no longer sit against the face of the grate inside the mill. As a result the slurry in the pulp lifter also flows back into the mill via the same grate holes through which it left the mill. This phenomenon is called flow-back. If the slurry inside the pulp lifter is not discharged completely before entering the final zone, it is carried over to the next cycle. This, however, only tends to occur at high mill speeds (ie 85-90% of critical).
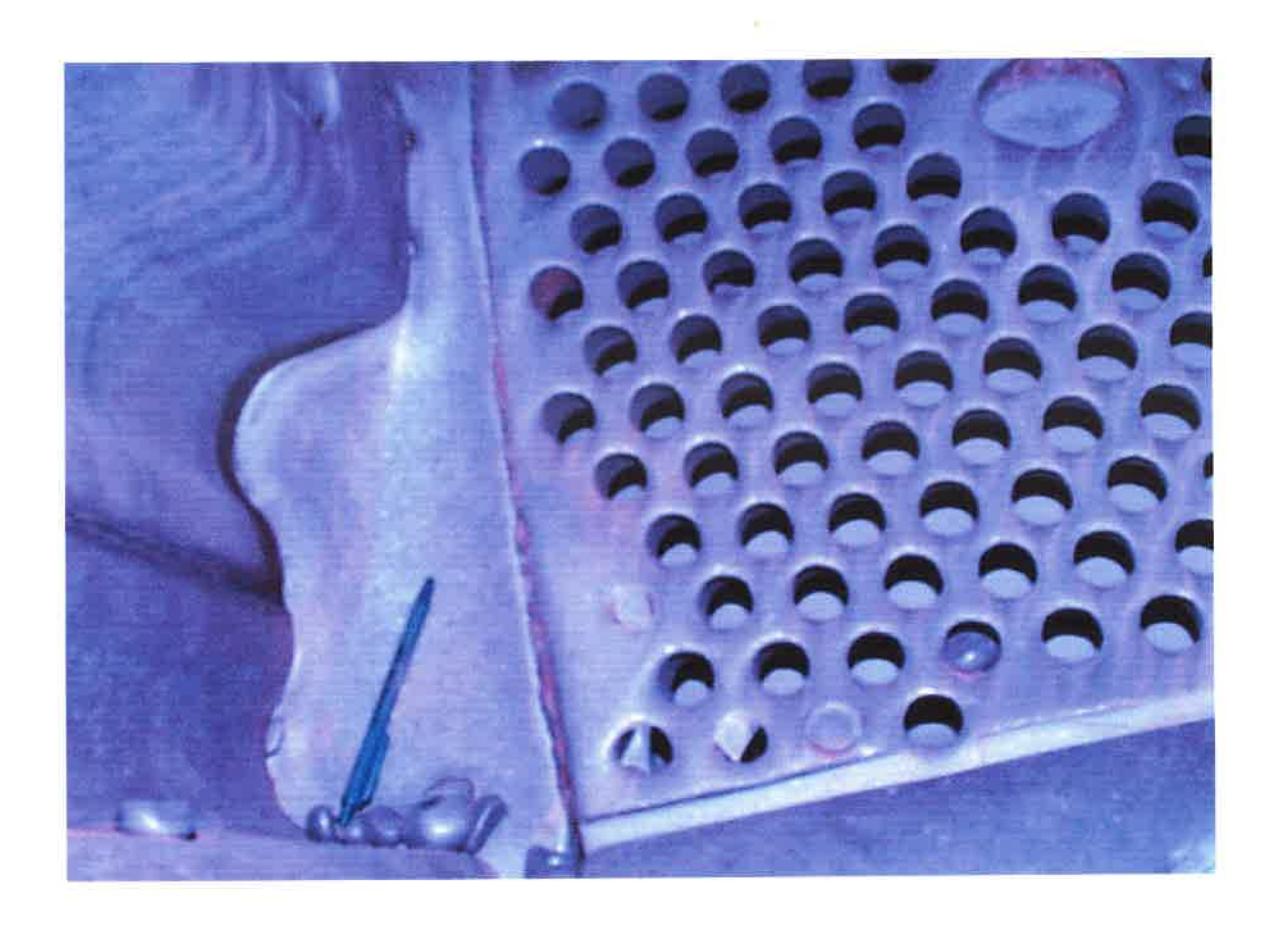
Wear patterns can often indicate that flowback is occurring. Figure 8 illustrates this well. The pen shown in the picture has been placed to indicate that the mill is turning in the direction that the pen tip is pointing. Flowback can be seen to have worn a broad channel in the outer part of the grate where the pen is sitting. Other signs can be found by examining wear of the grate holes on the pulp lifter side of the grate. Where flowback is significant, the edges of the holes will be rounded rather than sharp.
Factors Affecting Flow-back
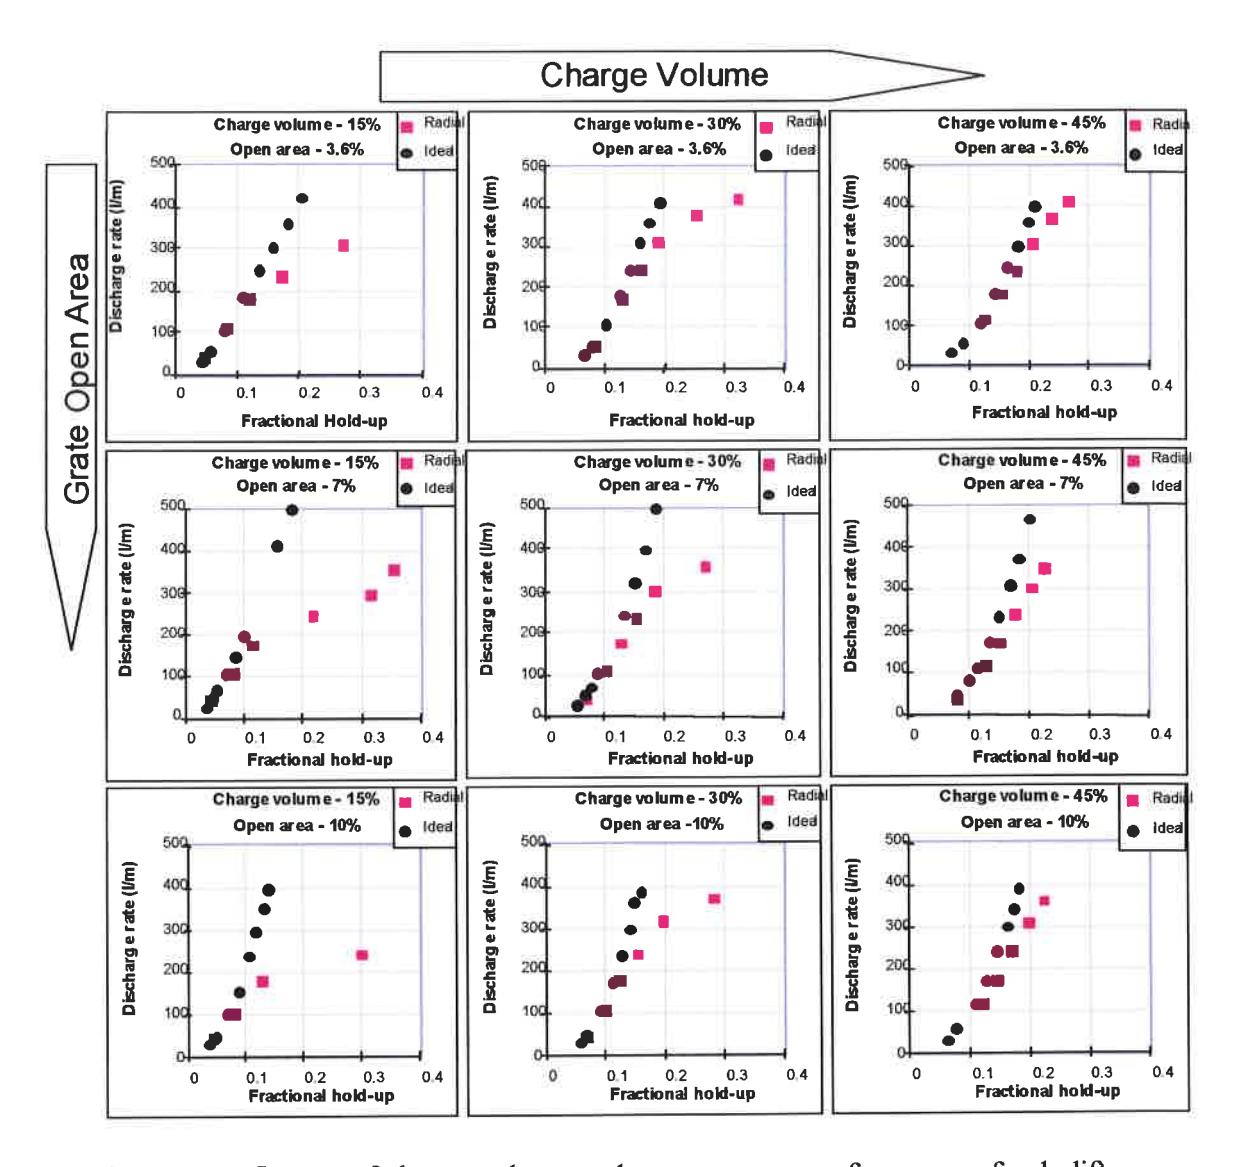
The previous discussion suggests that the flow-back of slurry from the pulp lifter into the mill is influenced by the presence (or lack of it) of the grinding charge against the grate as well as the grate open area. This is clearly observed in the experimental results shown in Figure 9 which were obtained by varying charge volume and open area. In the case of charge (grinding media) volume, much higher flowrates are obtained for a given slurry hold-up when a larger charge volume is present. This is due to the fact that the flow-back zone is reduced as the grinding charge is increased. In the case of open area the results indicate that for a given pulp lifter and charge volume, increasing grate open area beyond a certain point either has no effect or reduces flowrate out of the mill. This is due to the fact that, whereas increasing open area increases flow from the grinding chamber into the pulp lifters, flowback also increases and may do so to a greater extent.
Preventing Flow-back
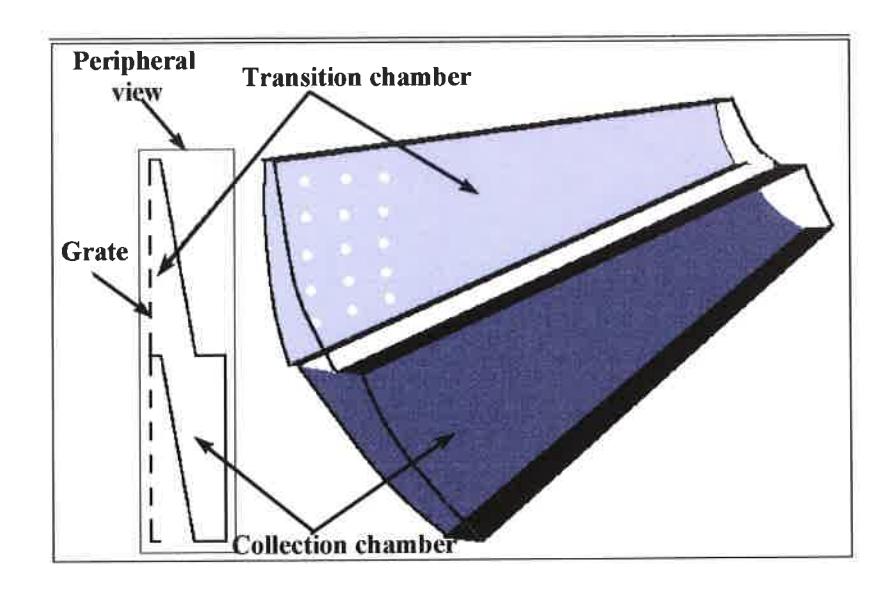
The only way to overcome the major inefficiency of conventional pulp lifter designs is to ensure that little or no flow-back of slurry occurs once the slurry has entered the pulp lifter. This has been achieved by a new design of pulp lifter called the Twin Chamber Pulp Lifter – or TCPL (Latchireddi, 1997) a schematic of which is shown in Figure 10.
In the Twin Chamber Pulp Lifter the slurry enters the section exposed to the grate - called the transition chamber, and then flows into the lower section - called the collection chamber. This latter chamber is not exposed to the grate. This mechanism ensures that the slurry is unable to flow or drain backwards into the mill, and hence the flow-back process is prevented up to the capacity of the collection chamber.
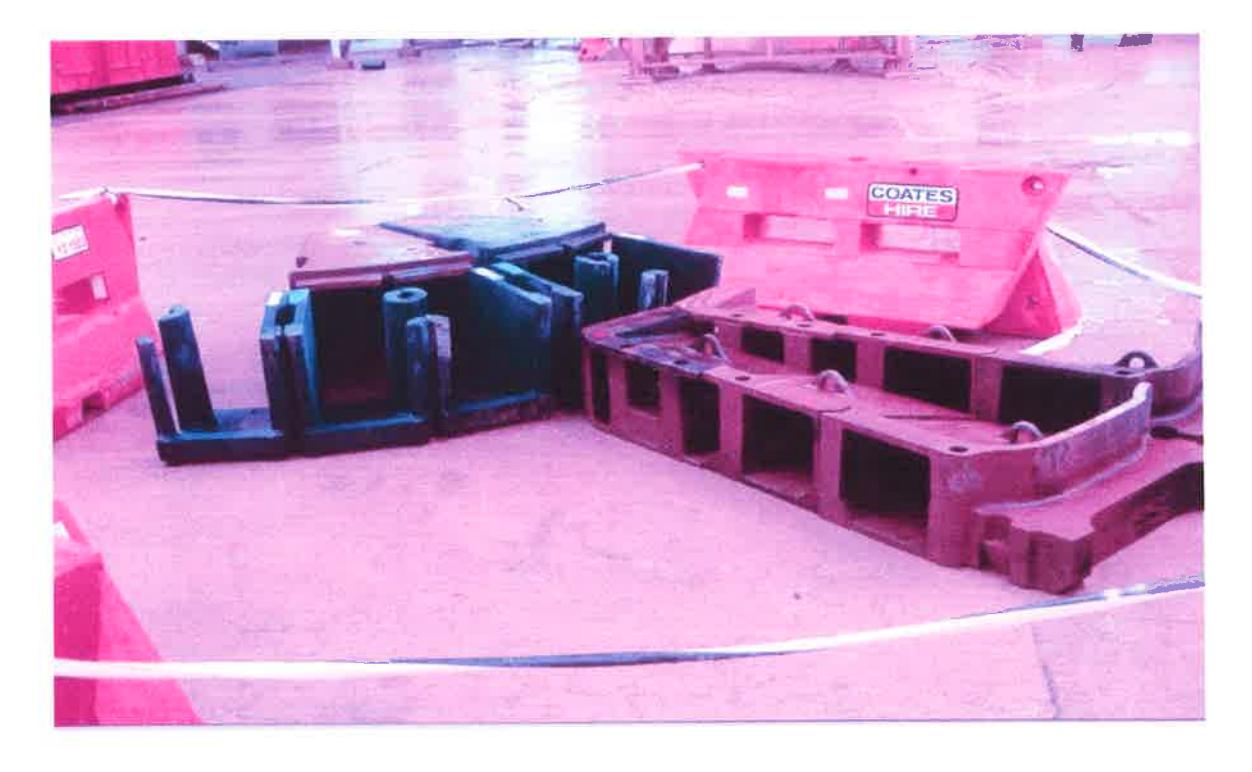
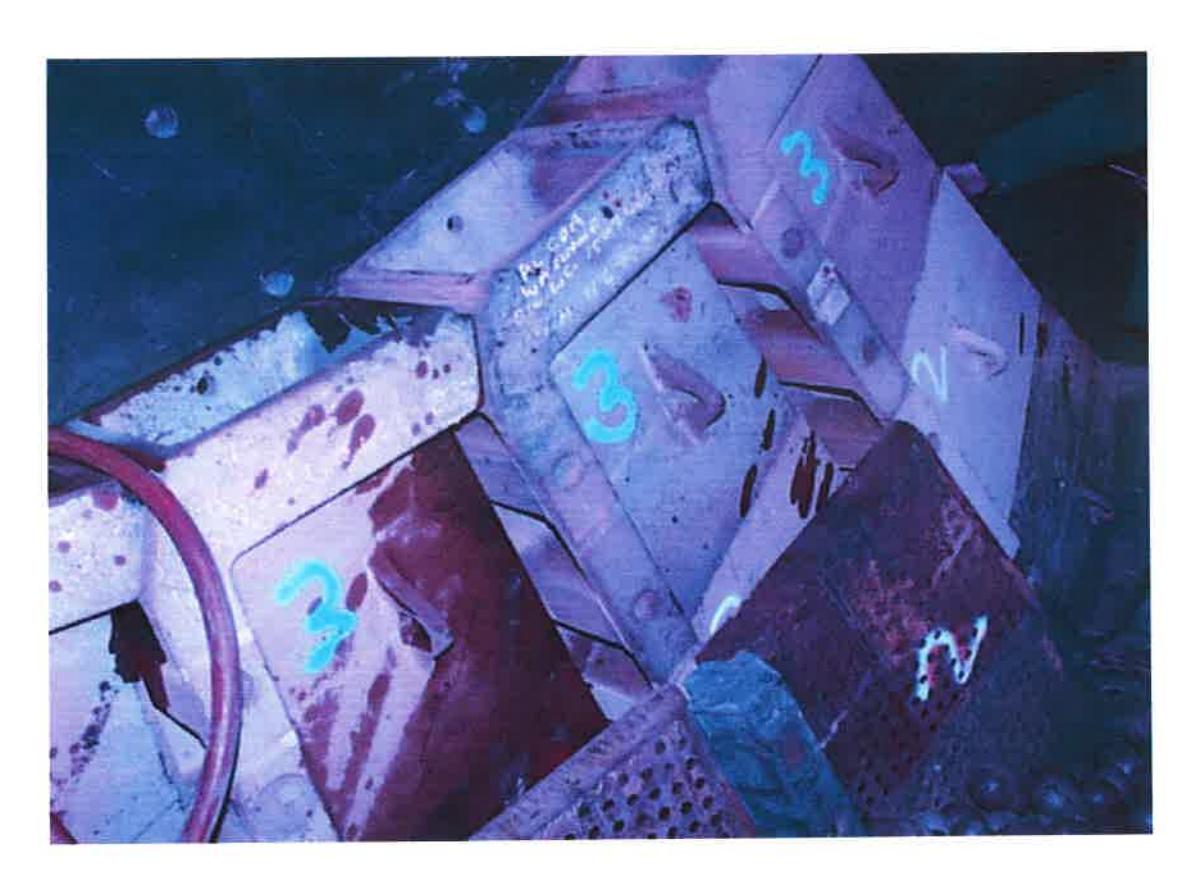
Pictures of a TCPL assembly that was installed in one of Alcoa's mills are shown in Figures 11 and 12. The use of these pulp lifters resulted in a significant throughput increase.
In its initial development a pilot scale TCPL was fabricated and tests were conducted in a 1m diameter SAG mill at the JKMRC. To evaluate its performance, the relationship between hold-up and flowrate was obtained with this new design and compared with radial and curved pulp lifters as shown in Figure 13.
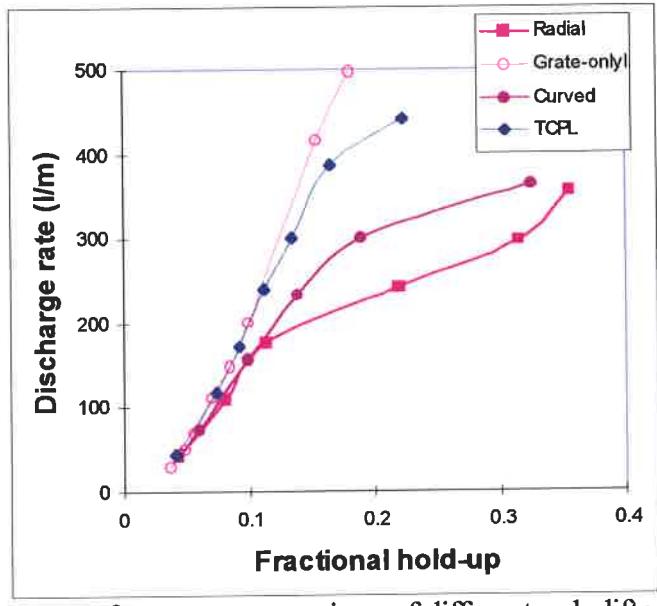
The mill discharge rates using the TCPL were close to the ideal grate-only values and were significantly better than those of the radial and curved pulp lifters. Importantly, the experimental results also indicated that the discharge rates of TCPL remained close to ideal values at all operating conditions (Latchireddi, 1997; Latchireddi and Morrell, 1997b). Based on these results an engineering study was then mounted by Alcoa who produced detailed drawings for a TCPL and subsequently installed a set in one of their Wagerup refinery sag mills (see later).
MODELLING OF PULP LIFTER PERFORMANCE
Pilot Data
Referring to Figure 6, slurry transportation in AG/SAG mills can be summarised under the following headings:
- 1. Flow through the grate into pulp lifter gives the volumetric flow that a discharge pulp lifter has to handle
- 2. Flow-back gives the inefficiency of the discharge pulp lifters
- 3. Carryover occurs at high critical speeds
- 4. Flow out of pulp lifters into the discharge trunnion actual mill discharge.
Of these four streams, the first and last are directly measurable, but there is no direct way of measuring the flow-back and carryover fractions. Additionally, the carryover fraction, if present, ultimately goes back into the mill at the end of a revolution and hence can be treated as flow-back. The total flow-back can be estimated as the difference between grate-only and grate-pulp lifter discharge systems.
The only literature available on flow through AG/SAG mills is by Moys (1986) and Morrell & Stephenson (1996) who developed models for grate-only discharge assemblies. Both were based on limited data and included only a few variables. The influence of charge volume and pulp lifter specifications, which play a critical role in slurry transport, were not explicitly incorporated in either model. However, the model proposed by Morrell & Stephenson (1996) was simple in form and hence its general structure was adopted for modelling of grate/pulp-lifter assemblies.
Laboratory and pilot programmes were initially conducted and determined that the slurry hold-up \( (H_p) \) is dependent on the open area (OA), grate design (GD), mill speed (CS), flowrate (Q), charge volume (CV) and pulp lifter specifications such as size (PLS), number (NPL) and design (PLD). This can be expressed mathematically as:
$$ H_{p} = f(OA, CV, CS, Q, GD, PLS, NPL, PLD) $$ (1)
Analysis of experimental results has shown that the hold-up—discharge rate relation for each size of pulp lifter is different and also varies with the design. Hence, the basic
equation form for each is similar but with some of the exponents being functions of design. The basic equation used was that proposed by Morrell and Stephenson (1996):
$$ H_p = k(NPL)^a (GD)^b (OA)^c (CV)^d (CS)^e Q^f $$ (2)
where, \( H_p = \) the net fractional slurry hold-up inside the mill \( = H_g - H_d \)
\( H_g \) = gross fraction of mill volume occupied by slurry
\( H_d \) = dead fraction of mill volume occupied by slurry
OA = fractional open area
CV = fractional charge volume
CS = fraction of critical speed Q = flowrate ( \( m^3 \text{ hr}^{-1} \) )
Q = flowrate (m3 hr-1). GD = grate design in terms of mean relative radial position of the
grate holes
k = coefficient of resistance
a,b,c,d,e,f = model parameters
The value of 'GD' is a weighted radius position which is expressed as a fraction of the mill radius and is calculated using the formula proposed by Morrell & Stevenson (1996).
where.
\( a_i \) = open area of all holes at a radial position \( r_i \)
\( r_{m} \) = radius of mill inside the liners
To estimate the 'dead' fraction of slurry hold-up \( (H_d) \) the following relation was developed based on the laboratory data.
where \( R_n \) is the radial position of outermost row of holes as a fraction of mill radius.
The parameter values c,d,e and were found to be associated with grate/pulp lifter design and were fitted to experimental data using the equations shown in Table 1.
| Parameter | Equation | R 2 |
|---|---|---|
| С | (0.076/PLS) - c go | 0.995 |
| d | d go - 1.77 * e (-0.72*PLS) | 0.997 |
| е | \( e_{go} + e^{(-0.07*PLS)} \) | 0.991 |
| k | k go * e (3.5/PLS) | 0.991 |
The parameter \( k_{go} \) varies with slurry rheology and the shape and size of the holes in proportion to grate thickness.
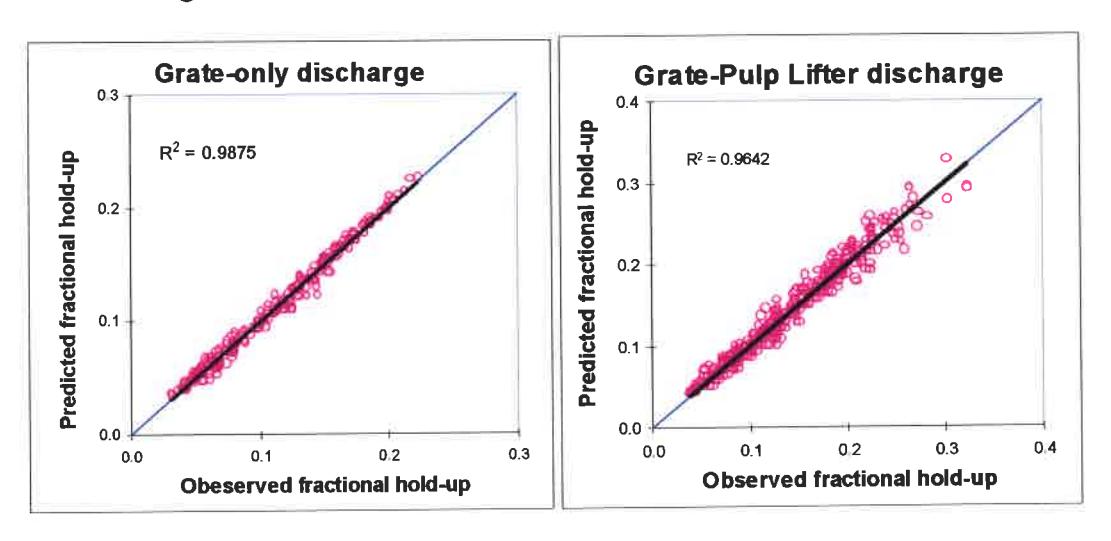
Plots comparing the observed and predicted values of all the pilot data sets using the above regression equations for both grate-only and grate-pulp lifter discharge systems are shown in Figure 14.
Full Scale Data
To validate the model equations flowrate and hold-up data from a number of industrial circuits were collected. A total of 21 data sets were obtained. The range of some important operating and design variables covered are given below:
| Variable | Range | ||
|---|---|---|---|
| Diameter (m) | 4 | to | 12.2 |
| Length/Diameter ratio | 0.34 | to | 1.56 |
| Grate open area (%) | 3.37 | to | 14.7 |
| Pulp lifter size (% ML) | 3.15 | to | 10.45 |
| Number of pulp lifters | 20 | to | 36 |
| Critical speed (%) | 70 | to | 83 |
| Flowrate (m 3 /hr) | 90 | to | 2540 |
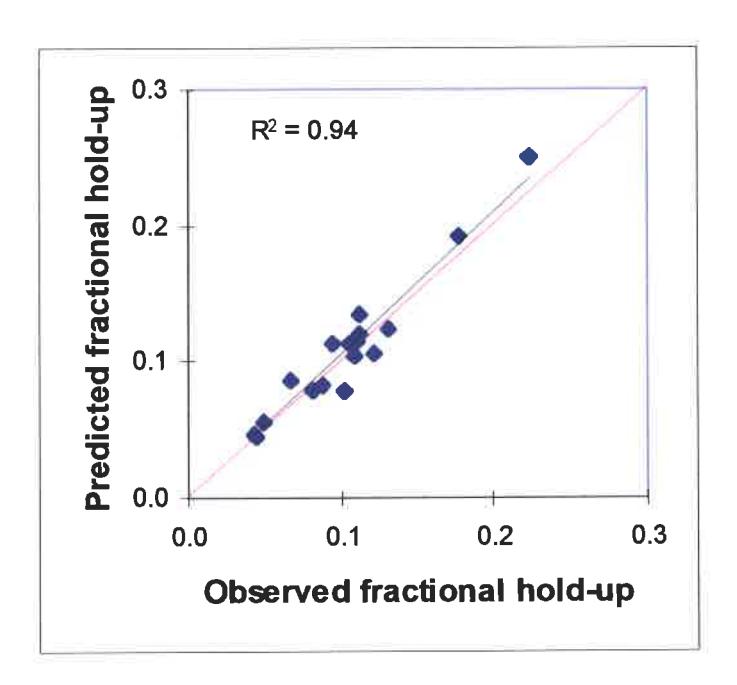
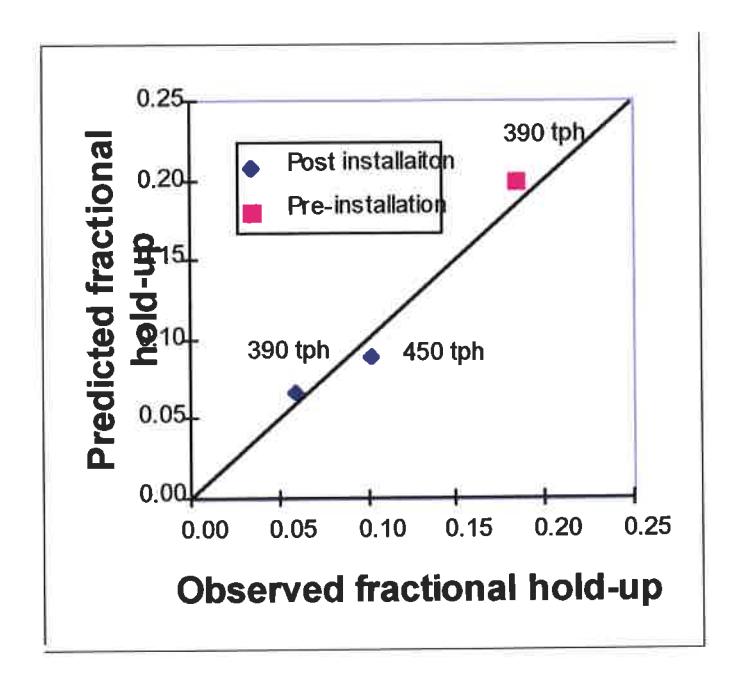
The data from the industrial mills were compared with model predictions. When using the value of \( k_{\rm go} \) , which was derived from the pilot data, it was found that the model trended well but was offset. This was attributed to the fact that the pilot data was for water whilst the industrial data was related to slurry with much higher viscosities. The parameter \( k_{\rm go} \) was therefore fitted to the industrial data. Accordingly the \( k_{\rm go} \) value was found to have shifted from 0.04 to 0.053. The observed and predicted results are shown in Figure 15. As only one installation currently uses the TCPL design (Alcoa's 7.7m diameter Wagerup mill), observed and model predictions for it are shown separately in Figure 16. Of particular note in Figure 16 is the fact that prior to the installation of the TCPL throughput was 390 tph and hold-up was very high. Post installation of the TCPL the same throughput was achieved but with a much lower slurry hold-up. Although not shown in the graph the lower slurry hold-up was also associated with a much lower rock charge level. This was subsequently taken advantage of by increasing throughput to 450 tph.
CONCLUSIONS
A model has been developed which for the first time incorporates grate and pulp lifter design aspects and which relates the slurry hold-up in AG/SAG mills to flow capacity.
The model has been validated with data from industrial mills of up to 12 m in diameter including mills operating in both open and closed circuit.
For design purposes the proposed equations can be rearranged to estimate the flow capacity of AG/SAG mills for a given set of operating conditions and to determine the size of pulp lifter required to handle a given flow capacity.
The industrial trials of the twin chamber pulp lifter in a 7.7 m diameter SAG mill at the Wagerup operations of Alcoa have conclusively demonstrated the benefits of TCPL in avoiding slurry pool formation which resulted in increasing the mill throughput by more than 15 percent.
ACKNOWLEDGEMENTS
The authors are grateful to ALCOA for conducting the first full scale trials of TCPL and permitting publication of the results, ANI Ltd for providing the pilot scale mill. The scholarship provided by AUSAID and the contribution of the sponsors of the AMIRA P9L project are gratefully acknowledged.
REFERENCES
- Latchireddi, S. R. and Morrell, S., 1997a. A laboratory study of the performance characteristics of mill pulp lifters. Minerals Engineering, Vol.10, No.11, pp. 1233-1244.
- Latchireddi, S. R. and Morrell, S., 1997b. International Patent Application No. PCT/AU97/00418, Twin Chamber Pulp Lifters for Grate Discharge Mills.
- Morrell, S. and Kojovic, T., 1996. The influence of slurry transport on the power draw of autogenous & semi-autogenous mills, Proc. of Int. Conf. Autogenous and Semi-autogenous Grinding Technology, 1996, Vancouver, B.C: 378-389.
- Morrell, S. and Stephenson, I., 1996. Slurry discharge capacity of autogenous and semi-autogenous mills and effect of grate design. Int.J.Min.Proc., 46(1-2):53-72.
- Morrell, S., 1993. The prediction of power draw in wet tumbling mills, PhD Thesis, University of Queensland, Australia.
- Moys, M.H., 1986. The effect of grate design on the behaviour of grate-discharge grinding mills. Int.J.Min.Proc., 18: 85-105.