



The content on this page was automatically generated from the PDF publication document and may contain errors or inaccuracies. Please refer to the original PDF for the most accurate information.
Tracking and Quantifying Value from 'Mine to Mill' Improvement
A Scott 1 , S Morrell 2 and D Clark 3
ABSTRACT
'Mine to Mill' improvement involves optimising the chain of rock breakage processes from the in situ rock in the mine to the output of the concentrator. A growing number of paper studies and case histories from metalliferous mines (AusIMM, 1998; JKMRC, 1998; Clark and Scott, 2002) demonstrate that generating more breakage in the pit and the primary crusher can lead to benefits to milling that result in significant improvements to the economic performance of a mining project. However, unless the 'value' of doing this (benefit over cost?) can be appropriately quantified, the approach cannot be effectively managed and the increases in blasting and monitoring costs cannot be justified.
Mining operations have traditionally been organised into the separate departments of geology, mining and processing based on the specialist skills required and the different professional disciplines involved. Process optimisation across these boundaries has commonly been frustrated by management requirements to minimise the costs incurred by each department without adequate reference to the 'value' being created. Companies have tended to discard positions that provide a technical over-view of the value chain, reducing the number of people with the opportunity to influence practices across these process boundaries.
This paper discusses these issues and identifies measures required to quantify and manage the 'value' provided by 'Mine to Mill' improvement generated by the intense blasting of ore.
INTRODUCTION
Cost versus value from blasting
In everyday language, 'value' is a very personal assessment of the worth of something. In business it is a description of monetary or material worth. The value of ore in the ground can be estimated based on the expected revenue derived from its mineral products less the costs required to mine the ore, process it and transport the resulting saleable products to their future owners.
Throughout the world, most mine blasts are assessed to be satisfactory based on the absence of problems rather than on the basis of the value that they add to the mining operation. Modern accounting systems have little difficulty tracking and reporting the cost of these operations. It is much more difficult to measure the benefit that is derived or the value that is added.
The value contributed by a blast will be maximised if:
- blasting operations are safe;
- batters and mine slopes are formed that meet the short- and long-term operational requirements of the mine;
- excavation rates are maximised and bench floors and benches can be excavated to design;
- rock fragments are pre-conditioned or weakened by blasting;
- the proportion of fines (eg particles smaller than the grate size of the mill) is maximised; and
- targeted crushing rates can be achieved at a closed side setting that produces mill feed with the desired coarse size distribution.
- 1. FAusIMM, Scott Mine Consulting Services Pty Ltd, PO Box 5126, Kenmore East Qld 4069.
- 2. MAusIMM, SMCS Pty Ltd.
- 3. WMC Resources Pty Ltd.
Exactly what represents 'maximum', 'desired' or 'meeting operational requirements' is specific to any particular mine and must be determined from an understanding of the overall economics of the operation.
Risks
There are a number of potential risks associated with the design of the high intensity blasts required to achieve downstream comminution benefits. These include:
- wasting money;
- cratering or early release of stemming allowing the early escape of explosion gases and reducing the effective work done by the explosive;
- fly-rock;
- excessive movement of the muck and dilution of ore;
- noise; and
- damage to slopes and benches.
The design of these intense blasts must focus on eliminating or managing these risks.
Impediments to 'Mine to Mill' improvement
Common impediments to the successful optimisation of rock breakage throughout the mining and processing chain include:
- A paradigm shift – It is necessary to break established rules of thumb regarding blasting practices and target performance.
- Mismatch between 'pain' and 'gain' – Increased blasting costs are readily observed and reported by the mine, whereas the benefits from an increase in throughput are more difficult to measure and are enjoyed by the mill. Corporate performance targets and reward structures may not encourage a mining manager to risk additional expenditure without being able to claim the subsequent benefits. If a contractor is responsible for excavation, then benefits from improved excavation performance may also fail to materialise on the mining report card.
- Sensitivity to damage and dilution Intense blasting may tend to increase blast damage or dilution if field practices are not of a high standard.
- Lack of proof The most effective way to kill off a new idea is for the production reporting system to be blind to the benefits generated by a change in practice.
Measurement
To be effective, measurements need to be of the right thing, of sufficient accuracy and to be reported to the right people in the right form at the right time. Not all mining measures meet these criteria.
There has been rapid development of the industry's measurement capability based on global positioning system (GPS), radio telemetry and computer database technologies. However there have been many examples of operations that suffer from an overload of data and a shortage of useful information. Many production databases become 'black holes' into which data are absorbed and never seen again. Most companies end up having to write custom software to interrogate these databases to extract the information they need.
In practice, most mines only achieve a fraction of the potential promised by their production monitoring and reporting systems. This shortfall in performance is often due to a failure to support these systems in terms of their maintenance and calibration. While some systems (eg drill performance and truck payload monitoring) have not always been found to provide the accuracy or reliability required to drive process optimisation, the information that is available is seldom fully utilised to manage the mining process. Most data is simply accumulated and reviewed later in an historical context rather than being relied upon to guide operating practices. This is in contrast with most process plants where on-line measurements are increasingly being used as part of the process control system.
Available mine monitoring technology still falls short of being adequate for process control. GPS and communications technologies probably meet the standards required provided there is adequate satellite coverage. Data describing overall production performance is available from mine monitoring systems but measurements of quality (eg size, hardness and moisture) and quantity (eg truck payloads, stockpile capacity and conveyor tonnages) still lack the accuracy required for detailed production optimisation.
Some operator input is invariably required by mine monitoring systems. The concept of 'garbage in – garbage out' applies to the quality of the resulting information. A very effective approach used in some mines is to ensure that the data that is being collected is made available to the operators concerned in a form that helps them to do their job. This means that they have a vested interest in the inputs that are required.
Uncertainty
Measurements made in the field are inevitably subject to uncertainty and have to be interpreted with an appreciation of their reliability. As an example, the following relative uncertainties could be expected for measurements in a surface metalliferous mine given reasonable conditions and regular calibration checks:
Volume to be mined ±1 per cent Survey ±1 per cent Density ±3 per cent Plan to actual ±1 per cent Truck factor ±5 per cent Truck count ±1 per cent Weightometer values ±3 per cent Moisture content ±30 per cent
Where a parameter is derived from a combination of measurements, the individual uncertainties propagate through the calculation and can be estimated for the outcome. For practical purposes, if two parameters are added or subtracted, then the absolute uncertainties are added and if the two parameters are multiplied or divided then the relative uncertainties are added.
These values lead to the measurement uncertainties shown on Figure 1 for measurement systems commonly used in the production chain. Mine planning and survey systems allow quite accurate estimates to be made of the volume of ground to be mined and actually mined. Uncertainty in the values used for density and variation between the actual volume mined and the volume planned to be mined contribute most to the uncertainty of these estimates.
The dry tonnage of the production trucked is vulnerable to uncertainty in the truck factor used or the accuracy of the truck weighing system. The moisture content is also likely to be only roughly known. The same variables affect estimates of the
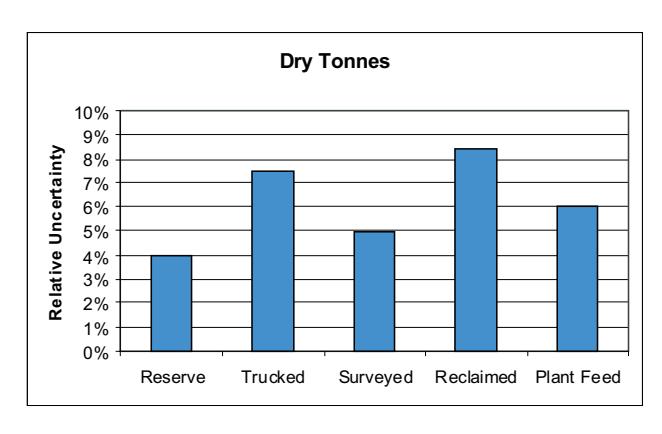
tonnage reclaimed from stockpiles and plant feed data are vulnerable to calibration errors or drift of weightometers and uncertainty with respect to moisture content.
It is a fundamental problem that changes of say five per cent in mill throughput may be worth millions of dollars to an operation but may not be discernable within the background variability and uncertainty inherent to the measurements made by the production monitoring system.
The uncertainty of these measures can be improved by engineering the measurement system to suit the reliability required. However, interpreting the value added by optimising 'Mine to Mill' breakage generally requires reference to longer-term trends rather than short-term changes in measured performance.
QUANTIFYING MINE TO MILL PERFORMANCE
Important measures for the management and assessment of rock breakage and comminution include:
- the breakage characteristics of the ore,
- blast performance,
- excavation performance,
- tracking through stockpiles,
- fragmentation,
- crushing performance,
- grinding performance, and
- cost.
These are discussed in the following sections.
Ore breakage characteristics
The breakage characteristics of the ore need to be understood if the blasting and comminution processes are to be optimised. Blast fragmentation is largely controlled by the material strength of the rock and the structure of the rock mass. Rock mass structure is important because it has a strong influence over the coarse end of the fragmentation curve and hence the excavation and crushing performance expected for the run-of-mine (ROM) ore. A detailed description of rock mass structure is complicated by its statistical nature and the limited access generally available for it to be observed prior to mining. Access to mining faces allows structure to be mapped and tools are becoming available to observe and analyse relevant features remotely (Poropat, 2001). Significant progress has been made with the modelling of structure driven by research into mass mining technologies at the Julius Kruttschnitt Mineral Research Centre (Brown, 2002; Harries, 2001).
The author has had considerable success utilising an estimate of the 'larger' natural blocks in the rock mass in the design of blasting operations and the prediction of blast fragmentation. For the purposes of blast design the 80 per cent passing size of the in situ structure is found to be useful and can be adequately estimated from observation of a representative face or from un-biased fracture frequency data.
The substance strength of the rock affects blasting, crushing and milling performance. However, the strength of rock varies with the size of the rock being considered (Hoek and Brown, 1980). On a scale relevant to blasting, it is the strength of the in situ blocks that is relevant while crushing is controlled by the remaining strength of the blast fragments. Grinding tends to deal with the strength of the intact rock material substantially free of structural defects.
The strength of a rock mass is conventionally described in qualitative terms in mining geomechanics. Terms such as rock block strength and bulk strength are used to describe strength estimates that include the effect of defects that may or may not be regarded as significant by those primarily focused on slope design and stability issues.
Rock material strength is traditionally measured in the laboratory using prepared specimens of uniform dimension. The resulting test values of unconfined compressive strength, tensile strength or shear strength may not appropriately represent the actual breakage criteria for the rock in the mine. However, other properties from these tests such as Young's modulus and Poisson's ratio are important parameters for some breakage models.
A number of field ratings have been defined based on the response to a blow from a hammer, scratch of a knife, etc (Berkman, 2001). These ratings can be very useful in the characterisation of rock mass strength and its variability, but can lack consistency when determined by different people.
Comminution parameters are required that relate the degree of breakage to the energy consumed. Appropriate parameters are generated by the JKMRC Drop Weight Test (JKMRC, 1996) and traditional abrasion tests.
The Point Load Strength (PLS) index (Brook, 1985) has been found by the authors to provide a very useful guide to blasting requirements. Despite its 'crudeness', the ease with which the test can be performed on either core or hand samples from the field means that enough tests can be performed to provide a reliable measure of effective strength. The index has also been found to correlate quite well with the more sophisticated energy based breakage tests used to characterise crushing and grinding performance (Figure 2).
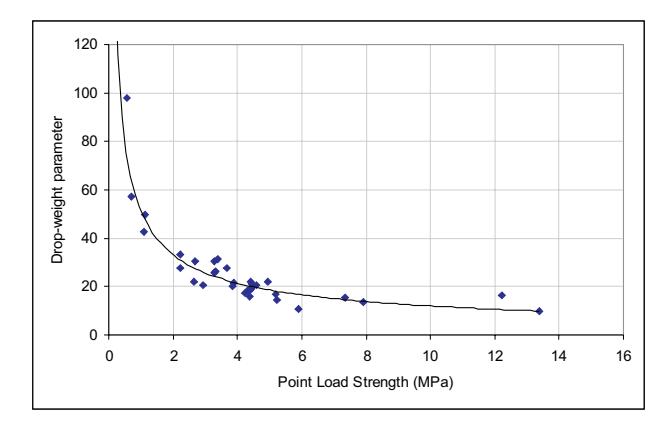
Because of its simplicity, Point Load Strength can be used to map the strength of the ore within a given mining volume if systematic sampling and testing is carried out. This attribute of strength can then be tracked through the production chain in the same way as grade or any other significant descriptor.
Indirect measures may also be used to map the strength of the rock substance. Considerable work continues to be applied to derive measures of rock competence from blast hole drills (Segui and Higgins, 2001; Hendricks and Peck, 1990) but few mines that have invested in these systems have managed to make routine use of the data for this purpose. Geophysical properties also have significant potential but tend to be collected only during exploration or during specific investigative programs.
Greater value can undoubtedly be gleaned from geological data than is routinely utilised. The mechanical properties of some orebodies can be effectively correlated with lithology or extent of alteration (Clark and Scott, 2002). Insights into the formation and structural history of a deposit may guide the interpretation of the available data to improve the estimation of rock properties in areas yet to be mined. It is very much a question of putting the engineering or scientific effort in to the analysis in order to get the benefits from it.
Blast implementation and performance
It is important to quantify a number of parameters associated with the implementation and performance of each blast as part of the management of 'Mine to Mill' operations. Intense blasts must be designed and implemented to a high standard if problems with fly-rock, bench damage and excessive dilution are to be avoided. Experience has shown that these outcomes can be effectively managed, but the operations are vulnerable if field controls are poor.
All mines have some sort of checklist or rating system by which blast performance is assessed. For intense blasts, particular emphasis should be given to the performance of stemming and any tendency towards cratering or fly-rock, damage and the distribution of swell in the muckpile. Observation of videos taken from a suitable vantage point and conventional survey techniques are adequate for these measurements providing they are undertaken consistently and routinely.
Observations of problems such as cratering or damage can be used to drive the refinement of blast designs, especially with regard to the distribution of explosive energy and detailed blast initiation timing. Qualitative measures of back-break should be routine and designs should be tested by quantitative measures of blast vibration and the response of mine benches and slopes. The distribution of muckpile swell is relevant to the 'looseness' required for efficient excavation and in interpreting mechanisms for ore dilution.
Excavation performance
Conventionally, blast designs are refined (reduced in cost) until any obvious digging problems are avoided. The result can be a long way from the economic optimum and most operations report an increase in excavation efficiency when the intensity of blasting is increased.
Considerable investigation has been undertaken into the effect of fragmentation on the time and energy required to fill an excavator bucket (Williamson et al , 1983; Sari, 1998). While this is an obvious component of 'digability' it is not the only important factor associated with the impact of blasting on excavation performance. Table 1 shows the factors affecting shovel productivity and how they may vary for a 'good' blast and for a 'poor' blast.
| Effect | ||
|---|---|---|
| Good blast | Poor blast | |
| Swing out | Same | Same |
| Dump time | Same | Same+ |
| Swing back | Same | Same |
| Prepare face and spot bucket | Low | High |
| Wait on auxiliary equipment | Low | High |
| Bucket fill time | Low | High |
| Bucket load | Even | Erratic |
| Truck load | Even | Erratic |
| Wait at crusher | Low | High |
The time to swing out to the truck and back to the face will be essentially independent of the quality of the blast. The dump time into a truck may be a little longer if the bucket contains large fragments, which require careful placement in the truck tray. Otherwise the dump time should be independent of the quality of the blast.
A poor blast will result in a tight muckpile, which will require additional face preparation. It is likely that the shovel will have to rake the face from time to time to gather loose fragments at the toe of the face. The assistance of a bulldozer may also be required. This additional face preparation time is an important aspect of the effect of blast performance on shovel productivity and should not be ignored in any comparison.
The bucket fill time would be expected to be lower in a poor blast. However, owing to the efforts put into face preparation, the actual fill time may be no worse than for a good blast. What is likely to vary is the consistency of bucket fill. Bucket loads will tend to be lighter, and will certainly be more variable in poor muck. This variability then translates to variable truck loads or the need, from time to time, for an extra pass to achieve an adequate truck payload.
Coarser muck will be slower to crush leading to an increased waiting time at the crusher.
Raw productivity measures such as tonnes per hour are therefore not sufficient on their own to quantify the improvements in excavation productivity arising from more intense blasts. Measures are also required of:
- what the shovel is doing ie idle, wait on dozer, face preparation, relocating, maintenance, operating, etc;
- total time to load each truck; and
- the number of bucket loads into each truck.
The force or energy required to load each bucket and the weight of each bucket would be more direct measures of the 'digability' of the muckpile. However, these parameters are difficult to measure and calibrate and do not have as strong an influence on the productivity of the overall system as the parameters listed above. Some operator input will probably be required to capture these data even with the more sophisticated monitoring systems becoming available.
To complement these shovel data, the following truck data are also required:
- load on each truck;
- truck waiting time at the shovel;
- travel time; and
- truck waiting time at crusher.
An effective GPS tracking system is required to tie these two data sources together and to gain an overall view of the efficiency of the operation.
Material tracking
Tracking the movement of material through the production process is a source of considerable confusion in many operations. The task is relatively straightforward if there is a single production stream and minimal stockpiling between the mining source and process stream. However, most operations mine from a number of sources and ensure continuity of feed by providing stockpiles prior to crushing and milling. Accounting for the tonnage in a stockpile is still a challenge despite modern equipment monitoring capability, and tracking the properties of the material placed on the stockpile and taken from it is an even greater challenge.
Some operations (eg KCGM's Fimiston operations and WMC's Mt Keith mine) go to considerable trouble to blend the ROM ore so that a consistent feed can be provided to the crusher and mills. The technical benefits of this strategy (Scott and McKee, 1994) are indisputable, but it creates a real challenge to track material through the process. Some success is being achieved using GPS data to match the source of a truck load of ore (and its associated characteristics) to its location in the stockpile so that the blended stockpile properties can be calculated and 'scheduled' as that part of the stockpile is reclaimed and fed into the comminution system.
Detailed stockpile accounting such as that described above is still an 'add-on' to the basic pit monitoring tools. The uncertainty of these predictions or the extent to which detail is blurred by the inherent measurement difficulties has yet to be assessed. Mount Keith (Clark and Scott, 2002) has gone to the trouble of sampling the stockpile itself to rebuild a model of hardness to guide the interpretation of subsequent mill performance.
Classic conical stockpiles of crushed mill feed behave relatively simply during periods of steady state cone geometry where ore tends to funnel fairly directly through to the feeders. However, when the stockpiles are being drawn down there is little relationship between the ore being placed on the stockpile and the ore being drawn. The dynamics of stockpile behaviour and the flow of fragmented rock can be tackled with the emerging distinct element and particle flow codes. Focused effort will be required by researchers and instrumentation companies to tackle this problem and create a robust tool to model and track the passage of material through these processes.
Fragment size
The assessment of blast fragmentation is usually based on the number of large fragments or boulders that are encountered in the muck pile. Because only the surface of the muckpile (which is a small and biased sample of the material that lies within the muckpile) can be seen and because it is difficult to physically measure objects with awkward shapes like broken rocks, the measurement of blast fragmentation is not easily achieved.
The distribution of particle sizes is conventionally presented on the basis of the weight of the material that is smaller than any particular size. The average size is regarded as the size for which 50 per cent of the particles are lighter and 50 per cent are heavier. A fragment size distribution is conventionally plotted with the cumulative weight per cent passing any given size against the logarithm of that size. The logarithm of size is chosen so that adequate detail can be observed in the fine end of the fragmentation curve.
It is very tempting to manually observe a muckpile and to form an impression of the average size or the 80 per cent passing size. However, these parameters are very difficult to 'guesstimate' because they are based on weight. It is possible to form an impression of the most common block size or to suggest that one muckpile is finer or coarser than another, but it is beyond the ability of the human brain to calibrate such estimates by weight. Measurement is therefore required if any quantitative decisions are to be made based on particle size.
Image analysis techniques for the estimation of the fragment size distribution of blasted muck have been under development for the last ten or fifteen years. For the last five years or so these techniques have been able to achieve a useful standard in terms of repeatability and accuracy. A digital image of the fragments is required and these are analysed by a computer to define the edges of the visible particles. Once defined, the system calculates the dimensions of the visible particle and assigns a representative size to each particle. The systems are imperfect in that in any pile of rock fragments, only some of the fragments are fully visible, the others being partially obscured by the fragments above. The edge detection algorithms are not perfect and good quality images (clear of dust and sharp shadows) are required if reliable results are to be achieved.
Because the measurement of size is initially made as an area, the third dimension must be estimated in order to derive a volume and hence a mass. The exact definition of size also varies between fragmentation assessment systems, but in general they attempt to replicate the measurements that would have resulted from physical sieving.
Any image analysis system will have a cut-off size below which particles cannot be individually identified or measured. The vendors of these systems utilise techniques based on the percentage of the image that cannot be resolved and assumed curves for the distribution of size in the fine fractions to extend the observable particle sizes below the observable threshold. These approaches have proved to be satisfactory provided these estimates are calibrated by comparison with physical analyses of adequate samples.
Despite all of the drawbacks identified above, the estimation of fragment size distribution using image analysis can be reliably achieved to a standard that is adequate when analysing open cut mining performance. The quality of the measurement will be strongly influenced by how well individual particles can be seen and whether the sample analysed is a fair representation of the material in question. The following are listed in order of increasing reliability:
- images of the excavation face,
- images of the muckpile,
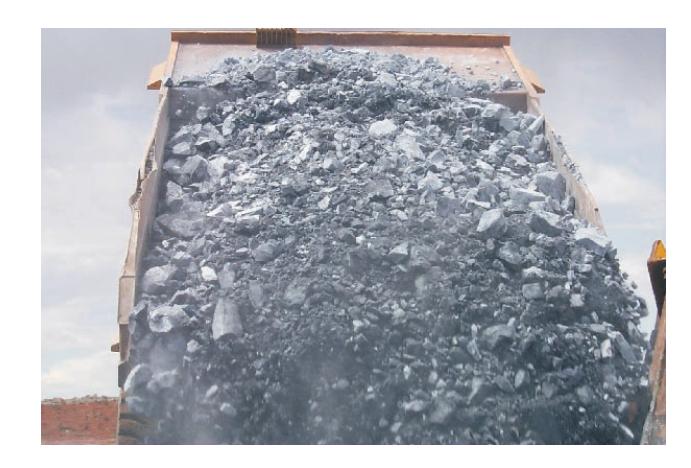
- images of the truck load,
- images of the truck tipping, and
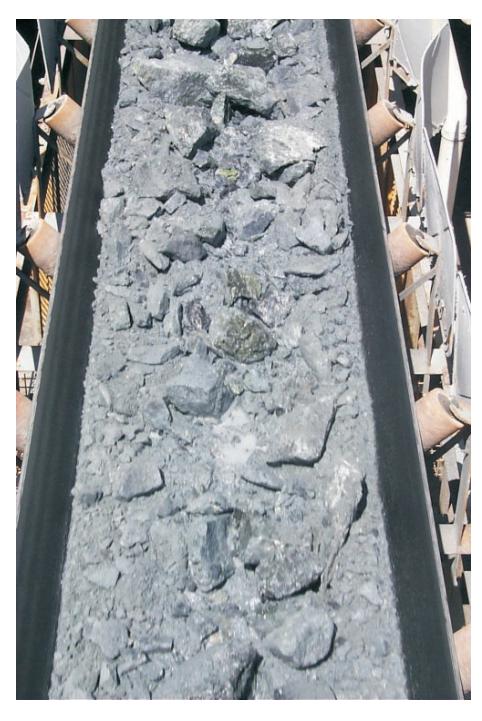
- images of the ore on a conveyor.
Being human, it is difficult to avoid making judgement about what is seen in the muckpile, in the face or on a truck. But in statistical terms these impressions are heavily flawed because of the biased view provided of the fragments. Only the last two approaches provide reasonable measures for long-term use in managing production or assessing performance in a quantitative sense.
Similarly, some useful data can be acquired using hand held cameras in an ad hoc program of measurement (Figures 3 and 4). However, the resulting data need to be regarded as indicative only. The quality of the result depends heavily on the consistency and effort made in acquiring the images. Reliable fragmentation data can be obtained from well-engineered permanent installations where images are collected under consistent presentation of the ore and lighting. Successful examples include KCGM, Mt Keith, Mt Newman and Hamersley Iron.
Crushing performance
In a conventional primary crusher – milling system, the task of the crusher is to prepare a suitable mill feed size distribution from the ROM ore in a single process. As this crushing process will generate few fines, the fines content of the mill feed is largely determined by blasting while the crusher defines the coarse end of the feed size distribution.
Crushing costs are most strongly affected by the hourly running costs and maintenance costs. If the same tonnage of feed can be crushed to a smaller top size in a shorter period of time (higher throughput) and with reduced wear, then significant gains can be made. The top size of the crusher product is controlled by the closed side setting of the crusher, but reducing this usually results in a reduction in throughput. This can be countered by providing finer, weaker ROM ore from intense blasts. Figure 5 shows operating data reported by Clark and Scott (2002) for WMC's Mount Keith operation.
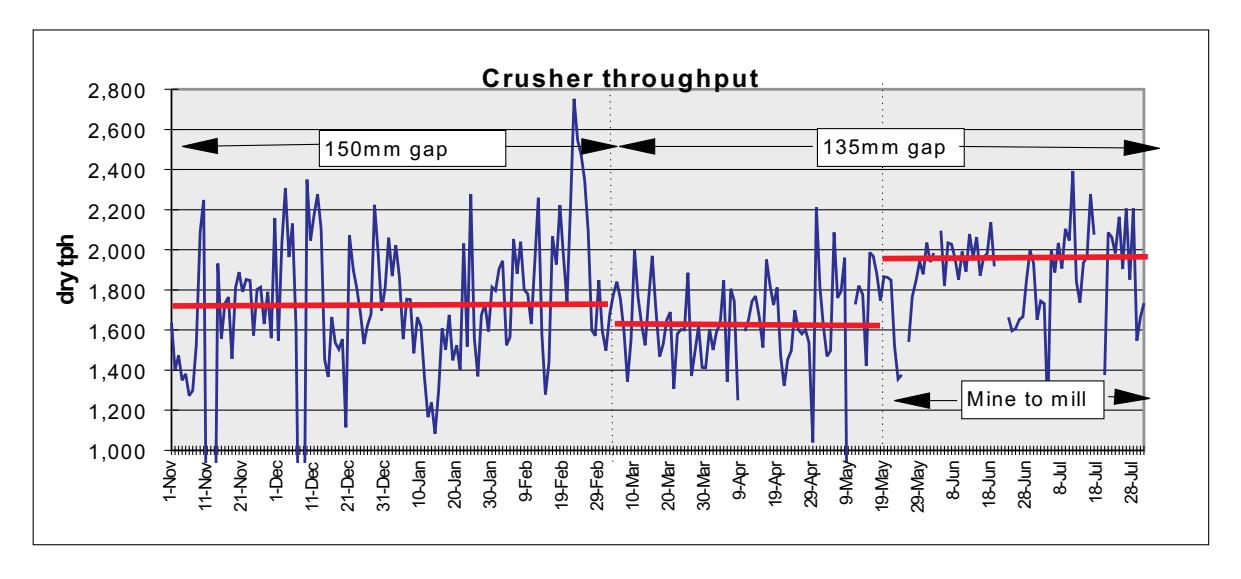
The higher throughput achieved at the reduced crusher gap is a result of the improved fragmentation achieved by intense blasting. The effectiveness of the effort expended in blasting can be assessed by monitoring the throughput achieved for ores of different hardness.
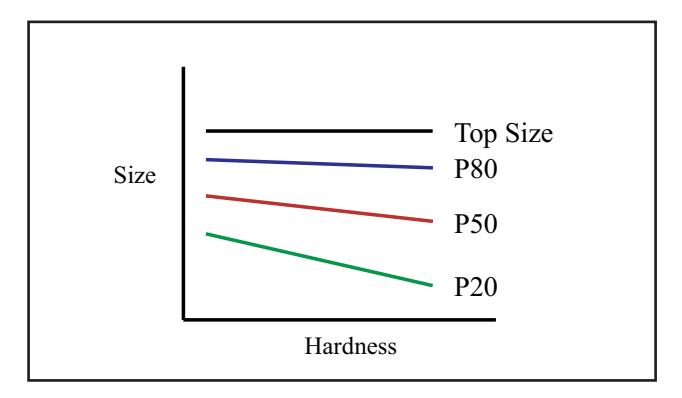
Online particle size measurement systems can report size for various percentages of the material in the crusher product and the mill feed. In order to normalise these size distributions against varying ore types, data from these systems can be plotted against the point load strength index. The size reported on the crusher product conveyor is expected to provide trends like that shown on Figure 6. The effectiveness of intense blasts can be gauged by a reduction in the sizes reported on such a plot.
Once base line performance has been established for these relationships it is possible to quantify the improvement that has been achieved in breakage performance.
Grinding performance
Grinding performance is controlled both by the hardness and the size distribution of the feed ore (Simkus and Dance, 1998). It is important to measure the 'grindability' of the ore so that milling performance can be correctly interpreted if the properties of the feed ore change either because of the inherent properties of the ore or because of changes to the mining process. Spot or routine feed samples can be tested to check against the ore properties tracked through the production process from the mine.
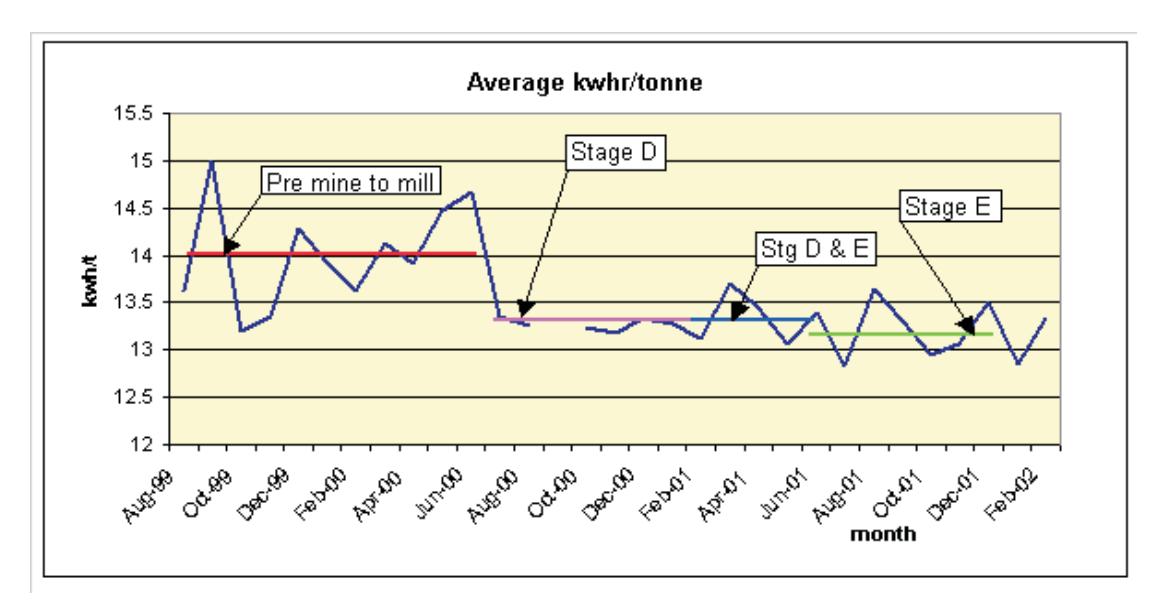
The most basic measure of performance is the energy consumed to grind each tonne of ore. Figure 7 shows the kWhr/t observed at Mt Keith as reported by Clark and Scott (2002) showing a step change when utilising intense blasts. Other influences such as different ore hardness from different stages of the pit development are also apparent. This change in energy consumption was accompanied by a seven per cent increase in mill throughput.
Milling is a complex transformation process and there are many other influences over throughput and energy consumed than are accounted for here. Changes in lifter design, ball load, transfer size and a host of more complex operating parameters can affect throughput and these also need to be taken into account when interpreting the influence of blasting on overall performance.
Cost
The overall cost of a mining operation tends to be measured and reported quite precisely. However it is much more difficult to subdivide these costs into components that relate to the unit operations that are managed and controlled by mine and mill personnel on a daily basis. For example, it is unhelpful to be able to report the amount of emulsion, ammonium nitrate and fuel oil consumed in a month by blasting operations if this cannot be broken down into the quantities of different types of explosive used in each blast.
Cost comparisons for the use of different blast designs are needed that cover the blasts themselves, the cost of clean up and wall control, secondary breakage, excavation, handling, crushing and milling. These costs need to be expressed in engineering terms and not just in terms driven by convenient accounting codes or warehouse inventory practices. Neither engineers nor accountants are in a position to establish such a reporting system on their own.
Quantifying value
Ultimately, the value generated by a change to operating practice can be measured from the net revenue earned by following that strategy compared with the net revenue earned by maintaining the status quo. Figure 8 shows a plot of the estimated increase in net revenue generated by a 15 per cent ($0.05/t) and a 30 per cent ($0.10/t) increase in blasting intensity for a theoretical operation. The components of the improvement from direct savings in
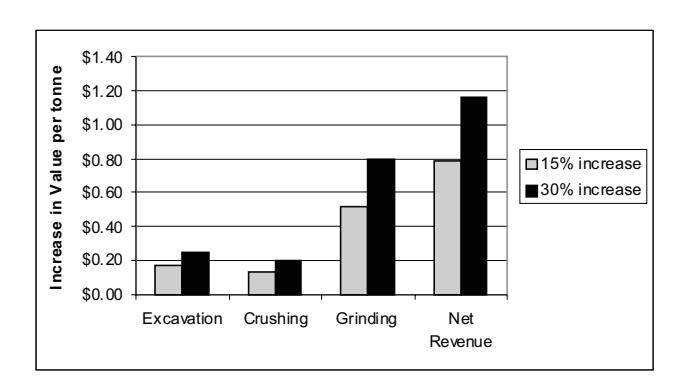
excavation, crushing and grinding are also shown. The values shown should be viewed as being indicative only, but the general trends are a true reflection of observed field results.
An improvement in net revenue of over $1 for the expenditure of approximately $0.10 constitutes a good investment. However, the simple analysis shown makes no allowance for an increase in revenue arising from increased mill throughput. Marketing and financial expertise are also required to evaluate the value to the operation of additional throughput. These numbers are often guesstimated by field personnel or consultants but are rarely generated or validated by a team with the range of expertise required to produce reliable estimates.
There is no doubt that an optimum point will exist where an increase or decrease in blasting intensity will result in a reduction in overall 'value' from the investment in blasting. This optimum point is unlikely to be achieved by applying the practices established by independently minimising the cost of each component process. Experience to date demonstrates that, providing adequate rock mass, mine and plant performance data are available; modelling can be used to provide useful guidance as to where this optimum point will lie. Continual tuning and refinement will be required in the field to establish and maintain optimum performance and an appropriate balance between component operations. This on-going refinement depends on field measurement and tracking of 'value' throughout the rock breakage and comminution chain.
CONCLUSIONS
This discussion results in the following conclusions:
- Optimising the performance (minimising the cost) of each operation in the rock breakage and comminution chain is unlikely to result the maximum value being realised by an operation.
- Appropriate characterisation of the orebody and modelling the performance of each process can guide the optimisation of the rock breakage and comminution system.
- Demonstrating whether any change to the process adds value depends on being able to measure performance in both physical and economic terms.
- Current mine monitoring and reporting systems may not be set up to measure performance to the accuracy required to quantify the value of 'Mine to Mill' improvement.
- Focussed observations of rock mass characteristics, blasting, excavation, crushing and milling performance are required to manage 'Mine to Mill' improvement. The overall benefits are more likely to be observed as longer term trends in performance rather than immediate responses to short-term changes.
- Because 'Mine to Mill' initiatives affect the revenue side of the value equation, higher-level business parameters relating to finance and marketing are also critical to the assessment of its value.
REFERENCES
AusIMM, 1998. Proceedings Mine to Mill '98 (The Australasian Institute of Mining and Metallurgy: Melbourne).
Berkman, D, (Ed) 2001. Field Geologists' Manual (The Australasian Institute of Mining and Metallurgy: Melbourne).
Brook, N, 1985. The Equivalent Core Diamater Method of Size and Shape Correction for Point Load Testing, Int Journ Rock Mech Min Sci and Geomech Abs, Vol 22, No 2.
Brown, E T, 2002. Block Caving Geomechanics , JKMRC Monograph No 3, (University of Queensland).
Clark and Scott, 2002. Milling throughput improvements at Mt Keith Operations, WMC Resources Limited, Institute for International Research (IRR) Mine to Mill Conference, Perth, August.
Harries, N J, 2001. Rock Mass Characteristics for Cave Mine Engineering, PhD Thesis, University of Queensland.
- Hendricks, C and Peck, J, 1990. Integrated Drill and Shovel Performance Monitoring towards Blast Optimisation, in Proceedings Third International Symposium on Rock Fragmentation by Blasting , Brisbane.
- Hoek and Brown, 1980. Underground Excavations in Rock (Institution of Mining and Metallurgy: London).
- JKMRC, 1996. Mineral Comminution Circuits Their Operation and Optimisation (JKMRC, University of Queensland).
- JKMRC, 1998. Optimisation of mine fragmentation for downstream processing. Final Report – AMIRA project.
- Poropat, G, 2001. New methods for mapping the structure of rock masses, in Proceedings Explo 2001, pp 253-260 (The Australasian Institute of Mining and Metallurgy: Melbourne).
- Sari, M, 1998. Factors Affecting Machine Loading Performance A Practical Study, MSc Thesis, University of Arizona.
- Scott, A and McKee, D J, 1994. The inter-dependence of mining and mineral beneficiation processes on the performance of mining projects, in Proceedings 1994 AusIMM Annual Conference , pp 303-306 (The Australasian Institute of Mining and Metallurgy: Melbourne).
- Segui, J B and Higgins, M, 2001. Blast design using measurement while drilling parameters, in Proceedings Explo 2001 , pp 231-235 (The Australasian Institute of Mining and Metallurgy: Melbourne).
- Simkus, R and Dance, A, 1988. Tracking hardness and size: measuring and monitoring ROM ore properties at Highland Valley Copper, in Proceedings Mine to Mill 98 , pp 113-119 (The Australasian Institute of Mining and Metallurgy: Melbourne).
- Williamson, S, McKenzie, C and O'Loughlin, H, 1983. Electric shovel performance as a measure of blast efficiency, in Proceedings First International Symposium on Rock Fragmentation by Blasting , (Lulea: Sweden).